

Reports
Reports
The global connected medical devices market size was valued at USD 78.6 Billion in 2025 and is projected to reach USD 381.1 Billion by 2036, expanding at a CAGR of 15.4% from 2026 to 2036. The market is expected to witness significant growth in the coming years, owing to increasing chronic diseases incidence, demand for remote patient monitoring, and expanding activity in the development of IoMT-based healthcare infrastructure. The convergence of AI, cloud connectivity, and 5G is transforming the capabilities of devices, allowing real-time data to be shared by patients and providers. Favorable reimbursement policies and expanding telehealth networks across developed and developing countries are expected to further support market growth.
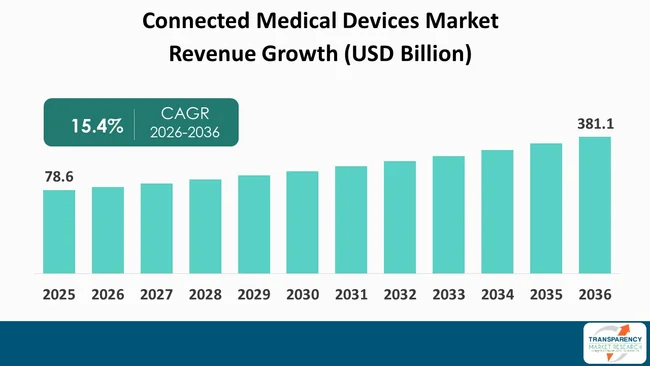
The global connected medical devices market presents significant growth potential, supported by the ongoing transformation of healthcare delivery and reimbursement models. Increasing strain on hospital infrastructure and escalating healthcare costs are driving providers and payers to increasingly embrace decentralized care models, which emphasize continuous monitoring and early intervention rather than reactive treatment. This shift makes connected medical devices industry a key technological enabler of cost containment, continuous patient monitoring, and improved clinical outcomes.
From a competition perspective, differentiation is more dependent on software, data analytics and interoperability, as opposed to just hardware specifications. Established medical device companies are competing to develop platform ecosystems, while technology companies with significant consumer electronics presence are entering the market for wearables and home monitoring to leverage existing distribution channels and brand trust. The blurring of lines between traditional MedTech players and consumer tech is set to heat up competition and further accelerate innovation cycles in the coming years.
A clear regulatory stance concerning data privacy, cybersecurity and cross-border interoperability continues to be a major factor impacting the timing of adoption, especially in those regions where healthcare IT infrastructure is fragmented. Reimbursement schemes are starting to evolve to support remote monitoring applications, although rates of change vary widely across geographies. Those companies that can successfully navigate the complexities of the regulation and demonstrate clear clinical and economic value will have the greatest potential for market domination as the market develops. Strategic partnerships, focused acquisitions, and further investment in AI-led analytics are expected to characterize the next stage of competition in this domain.
Connected medical devices industry are medical equipment and wearables with integrated sensors, connectivity, and software that enable them to send patient data in real time to clinicians, caregivers, or centralized health systems. From diagnostic instruments and therapeutic devices to consumer wearables, connected medical devices market have evolved from niche technologies into an important component of modern healthcare delivery. Through integration with cloud platforms, mobile applications and electronic health records (EHRs), vital signs, chronic conditions and treatment adherence can be monitored continuously outside of the clinical environment.
The adoption has been driven by a general emphasis on preventive and remote care, as health systems look for ways to reduce hospital readmissions and manage escalating costs associated with an aging population and growing chronic disease burden. Improvements in wireless communication standards, miniaturized sensors, and battery efficiency have allowed these devices to become more accurate, cost-effective, and available in various care settings, including acute hospital settings and home-based monitoring. With healthcare players already focusing on connected and data enabled solutions, the market stands at the confluence of medical innovation and digital transformation that is redefining the means of delivering, monitoring and personalizing care throughout the patient journey.
| Attribute | Detail |
|---|---|
| Market Drivers |
|
The growing burden of chronic diseases globally is one of the biggest drivers of connected medical device adoption, as healthcare providers move from episodic care to continuous real-time monitoring. At least 40 million people die each year from non- communicable diseases, including more than 19 million from cardiovascular diseases, over 10 million from cancers, nearly 4 million from chronic respiratory diseases and more than 2 million from diabetes-related deaths. The substantial mortality burden associated with chronic diseases is increasing the need for continuous monitoring and early intervention.
Beyond the toll of death, the cost is staggering: Heart disease and stroke alone killed more than 850,000 Americans in 2024, and are responsible for 1 in 4 deaths, and it costs the health care system 223.2 billion dollars annually and it is associated with 191.5 billion dollars in indirect costs.
Such a broad disease burden across cardiovascular, respiratory, and metabolic diseases is prompting providers, payers, and public health organizations to commit to connected monitoring solutions that can follow patients beyond hospital confines and facilitate earlier intervention to mitigate the downstream expenditure burdens tied to disease progression and acute events.
The increasing need for remote patient monitoring is creating a significant growth opportunity for the connected medical devices market as government payers expand reimbursement coverage and healthcare providers extend virtual care programs beyond hospital settings. As per the Office of Inspector General of the U.S. Department of Health and Human Services, the spending on Medicare reimbursements for remote patient monitoring crossed USD 500 million in 2024 and was on the rise, already having escalated from USD 15 million in 2019 to more than USD 300 million in 2022. This dramatic rise, which is close to a 20-fold increase over the period of three years, highlights the increasing integration of remote monitoring into routine management of chronic and acute conditions.
Program participation has also increased with the increase in funding. The Office of Inspector General reported that in 2022 over 570,000 Medicare beneficiaries were prescribed remote patient monitoring services for conditions including hypertension, diabetes, heart failure, and chronic obstructive pulmonary disease. The Centers for Medicare and Medicaid Services has approved coverage for monitoring services since 2018, and the number of patients receiving services has grown substantially each year, with current billing requirements including health data collection and transmission on at least two days in a 30-day period to qualify for reimbursement.
Momentum continues to build on the regulatory front to lay the groundwork for further adoption. The Centers for Medicare and Medicaid Services' CY 2026 Physician Fee Schedule Final Rule added more remote monitoring and remote therapeutic monitoring billing codes and added new device supply codes for 2 to 15-day monitoring periods, as well as new treatment management codes. The ongoing expansion of reimbursed services, driven by growing enrollee participation, is positioning remote patient monitoring as a sustainable, policy-supported growth area for connected devices in chronic disease management.
| Attribute | Detail |
|---|---|
| Market Opportunities |
|
Increasing penetration in developing countries is significant untapped potential for the connected medical devices market as growing digital infrastructure and government supported healthcare initiatives are paving the way for higher usage beyond the conventional high income countries. According to the International Telecommunication Union, 74% of the world's population, some 6 billion people, were online as of 2025, a small increase from 71% in 2024, with the Asia-Pacific region recording substantial connectivity growth, since it took a 27 percentage-point increase in just 6 years, from 50% to 77%, largely powered by mobile infrastructure investment in India, Southeast Asia, and Pacific Island countries.
The global mobile subscriptions are now 89% mobile broadband subscriptions, as reported by the International Telecommunication Union which provides a conducive connectivity backbone for device-based remote monitoring in areas traditionally limited by fixed infrastructure. Foundation is being reinforced by government-led digital health initiatives. As per India's National Health Authority, over 79.91 crore Ayushman Bharat Health Accounts have been created till August 2025, with more than 67.19 crore health records linked to the platform and more than 6.79 lakh healthcare professionals registered across the country. This scale of digital health identity infrastructure also presents a direct path for connected device integration into mainstream care delivery for a large, previously unreached population base.
Financial inclusion trends are further driving this opportunity, with the global index of the World Bank showing that 84% of adults in low- and middle-income countries now own a mobile phone and 90% of internet users in these countries accessing connectivity through mobile devices. This mobile-first digital foundation is positioning emerging economies as an important source of long-term growth for connected medical device companies seeking expansion beyond mature developed markets.
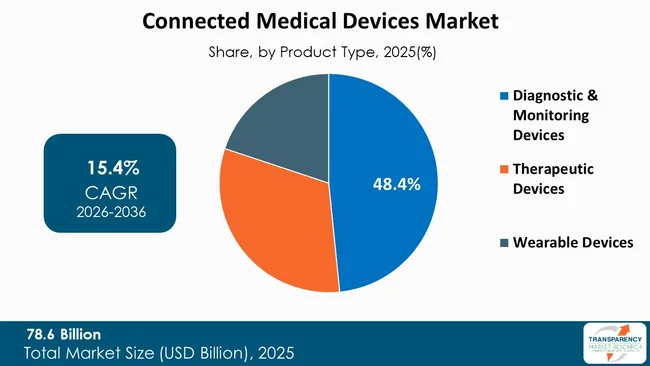
The diagnostic and monitoring devices segment dominated the global connected medical devices market in 2025, accounting for approximately 48.4% of total market revenue, owing to the large size of large population requiring continuous disease monitoring instead of single diagnostic intervention. The International Diabetes Federation estimates that the number of adults living with diabetes worldwide will reach 589 million adults by 2024, giving rise to continuous demand for connected glucose monitoring solutions that enable daily disease management rather than on an occasional basis of clinical testing. This scale of demand has translated directly into regulatory action, with the U.S. Food and Drug Administration clearing several over-the-counter continuous glucose monitoring systems in 2024 and 2025, expanding availability from insulin-dependent patients to a broader population interested in proactive health insights.
Cardiac monitoring is another major application area. The American College of Cardiology and American Heart Association predicted that atrial fibrillation will affect 12 million people by 2030, a condition that often goes undiagnosed because it is asymptomatic, but is typically found with continuous rhythm monitoring. In addition, American Heart Association research has shown that 62% of atrial fibrillation patients had no previous awareness of their disease before being diagnosed, which is the exact reason connected diagnostic and monitoring devices, which can identify abnormalities before an acute event takes place, are important components of cardiovascular monitoring and disease-management pathways.
This confluence of high-prevalence chronic diseases, growing regulatory approvals, and the clinical need to capture data continuously as opposed to episodically makes diagnostic and monitoring devices the largest product category, with diabetes and cardiac applications combined accounting for the majority of segment demand in both hospital and home-care environments.
| Attribute | Detail |
|---|---|
| Leading Region |
|
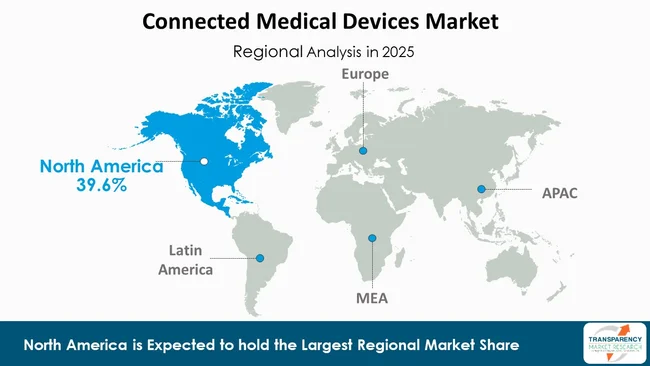
North America dominated the global connected medical devices market in 2025, accounting for approximately 39.6% of total market revenue, supported by an aging population along with well-established reimbursement models and established regulatory pathways for digital health technologies. As per the U.S. Census Bureau, the older population (65 years and above) was 61.2 million in 2024, which is 18% of the total population and is a huge rise from 12.4% in 2004, with this segment of population growing by 13.0% from 2020 to 2024 which is much higher than the 1.4% growth rate of working adults. This demographic transformation is directly broadening the potential patient pool that needs to be requiring continuous monitoring for age-related and chronic conditions. Therefore, one of the core components of the structural advantage that the region possesses over geographies with distinctly younger populations.
In North America, the US is the key growth driver owing to the presence of favorable reimbursement policies, a highly developed healthcare IT infrastructure, and a large pool of physicians who are well-versed in digital monitoring workflows. The Administration for Community Living (ACL) within the U.S. Department of Health and Human Services, indicated that the population of older adults in the country was over 61 million according to the latest Profile of Older Americans, a demographic more likely to live with multiple co-occurring chronic conditions that require them to be device-monitored on an ongoing basis and/or served by episodic care. With established billing codes for remote monitoring services for example applicable to Medicare, the U.S. has thus emerged as the deepest and most closely monitored national market for connected device adoption, and thus adoption benchmarks that other parts of the world are slowly trying to emulate.
The competitive landscape comprises established medical device manufacturers, diagnostics companies, and consumer technology companies competing across clinical monitoring, wearable devices, data analytics, and connected-care platforms. The broad Medtronic portfolio in cardiac rhythm management and diabetes care is underpinned by deep clinical relationships and a comprehensive suite of implantable and wearable monitoring solutions. Abbott Laboratories maintains a strong position in continuous glucose monitoring through its FreeStyle Libre and Lingo product portfolios.
Koninklijke Philips N.V. and GE HealthCare Technologies Inc. have carved out hospital-grade patient monitoring and imaging-integrated connected systems for themselves, relying on decades-old institutional contracts with health systems. These companies focus on glucose biosensing, and position it to obtain early regulatory approvals for over-the-counter monitoring forms, also placing the device in the hands of non-insulin dependent patients. Masimo Corporation and ResMed Inc. have unique positions/strengths such as non-invasive monitoring, and sleep and respiratory therapy devices, respectively, that allow them to develop relatively defensible positions on particular clinical applications Apple Inc. and Samsung Electronics Co., Ltd. has entered the wearable health category, driving consumer-scale distribution and brand trust that will help consumers increasingly use these as fitness rather than clinical-grade monitors, as their platforms add more health sensing capabilities. Together, this tiered competitive construct spanning traditional MedTech depth to consumer tech reach is escalating innovation cycles within the connected medical devices industry arena.
| Attribute | Detail |
|---|---|
| Size in 2025 | USD 78.6 Billion |
| Forecast Value in 2036 | USD 381.1 Billion |
| CAGR | 15.4% |
| Forecast Period | 2026-2036 |
| Historical Data Available for | 2021-2025 |
| Quantitative Units | USD Billion |
| Connected Medical Devices Market Analysis | It includes segment analysis and regional level analysis. Qualitative analysis includes drivers, restraints, opportunities, key trends, value chain analysis and key trend analysis. |
| Competition Landscape |
|
| Format | Electronic (PDF) + Excel |
| Segmentation | Product Type
|
| Regions Covered |
|
| Countries Covered |
|
| Companies Profiled |
|
| Customization Scope | Available upon request |
| Pricing | Available upon request |
The market was valued at USD 78.6 Billion in 2025.
The industry is projected to reach USD 381.1 Billion by 2036.
Escalating burden of chronic diseases and the expansion of Medicare reimbursement for remote and home-based patient monitoring.
The market is anticipated to expand at a CAGR of 15.4% from 2026 to 2036.
North America is expected to maintain the largest market share from 2026 to 2036.
Medtronic plc, Koninklijke Philips N.V., GE HealthCare Technologies Inc., Abbott Laboratories, Boston Scientific Corporation, Siemens Healthineers AG, Johnson & Johnson, Becton, Dickinson and Company, B. Braun SE, Baxter International Inc., Stryker Corporation, Dexcom, Inc., ResMed Inc., Masimo Corporation, Omron Healthcare Co., Ltd., Fitbit LLC, Apple Inc., Samsung Electronics Co., Ltd., Garmin Ltd., and iRhythm Technologies, Inc. among others.
Table 01: Global Connected Medical Devices Market Value (USD Billion) Forecast, by Product Type, 2021 to 2036
Table 02: Global Connected Medical Devices Market Value (USD Billion) Forecast, by Technology, 2021 to 2036
Table 03: Global Connected Medical Devices Market Value (USD Billion) Forecast, by Application, 2021 to 2036
Table 04: Global Connected Medical Devices Market Value (USD Billion) Forecast, by End-user, 2021 to 2036
Table 05: Global Connected Medical Devices Market Value (USD Billion) Forecast, by Country/Sub-region, 2021 to 2036
Table 06: North America Connected Medical Devices Market Value (USD Billion) Forecast, by Product Type, 2021 to 2036
Table 07: North America Connected Medical Devices Market Value (USD Billion) Forecast, by Technology, 2021 to 2036
Table 08: North America Connected Medical Devices Market Value (USD Billion) Forecast, by Application, 2021 to 2036
Table 09: North America Connected Medical Devices Market Value (USD Billion) Forecast, by End-user, 2021 to 2036
Table 10: North America Connected Medical Devices Market Value (USD Billion) Forecast, by Country/Sub-region, 2021 to 2036
Table 11: U.S. Connected Medical Devices Market Value (USD Billion) Forecast, by Product Type, 2021 to 2036
Table 12: U.S. Connected Medical Devices Market Value (USD Billion) Forecast, by Technology, 2021 to 2036
Table 13: U.S. Connected Medical Devices Market Value (USD Billion) Forecast, by Application, 2021 to 2036
Table 14: U.S. Connected Medical Devices Market Value (USD Billion) Forecast, by End-user, 2021 to 2036
Table 15: Canada Connected Medical Devices Market Value (USD Billion) Forecast, by Product Type, 2021 to 2036
Table 16: Canada Connected Medical Devices Market Value (USD Billion) Forecast, by Technology, 2021 to 2036
Table 17: Canada Connected Medical Devices Market Value (USD Billion) Forecast, by Application, 2021 to 2036
Table 18: Canada Connected Medical Devices Market Value (USD Billion) Forecast, by End-user, 2021 to 2036
Table 19: Europe Connected Medical Devices Market Value (USD Billion) Forecast, by Product Type, 2021 to 2036
Table 20: Europe Connected Medical Devices Market Value (USD Billion) Forecast, by Technology, 2021 to 2036
Table 21: Europe Connected Medical Devices Market Value (USD Billion) Forecast, by Application, 2021 to 2036
Table 22: Europe Connected Medical Devices Market Value (USD Billion) Forecast, by End-user, 2021 to 2036
Table 23: Europe Connected Medical Devices Market Value (USD Billion) Forecast, by Country/Sub-region, 2021 to 2036
Table 24: Germany Connected Medical Devices Market Value (USD Billion) Forecast, by Product Type, 2021 to 2036
Table 25: Germany Connected Medical Devices Market Value (USD Billion) Forecast, by Technology, 2021 to 2036
Table 26: Germany Connected Medical Devices Market Value (USD Billion) Forecast, by Application, 2021 to 2036
Table 27: Germany Connected Medical Devices Market Value (USD Billion) Forecast, by End-user, 2021 to 2036
Table 28: U.K. Connected Medical Devices Market Value (USD Billion) Forecast, by Product Type, 2021 to 2036
Table 29: U.K. Connected Medical Devices Market Value (USD Billion) Forecast, by Technology, 2021 to 2036
Table 30: U.K. Connected Medical Devices Market Value (USD Billion) Forecast, by Application, 2021 to 2036
Table 31: U.K. Connected Medical Devices Market Value (USD Billion) Forecast, by End-user, 2021 to 2036
Table 32: France Connected Medical Devices Market Value (USD Billion) Forecast, by Product Type, 2021 to 2036
Table 33: France Connected Medical Devices Market Value (USD Billion) Forecast, by Technology, 2021 to 2036
Table 34: France Connected Medical Devices Market Value (USD Billion) Forecast, by Application, 2021 to 2036
Table 35: France Connected Medical Devices Market Value (USD Billion) Forecast, by End-user, 2021 to 2036
Table 36: Italy Connected Medical Devices Market Value (USD Billion) Forecast, by Product Type, 2021 to 2036
Table 37: Italy Connected Medical Devices Market Value (USD Billion) Forecast, by Technology, 2021 to 2036
Table 38: Italy Connected Medical Devices Market Value (USD Billion) Forecast, by Application, 2021 to 2036
Table 39: Italy Connected Medical Devices Market Value (USD Billion) Forecast, by End-user, 2021 to 2036
Table 40: Spain Connected Medical Devices Market Value (USD Billion) Forecast, by Product Type, 2021 to 2036
Table 41: Spain Connected Medical Devices Market Value (USD Billion) Forecast, by Technology, 2021 to 2036
Table 42: Spain Connected Medical Devices Market Value (USD Billion) Forecast, by Application, 2021 to 2036
Table 43: Spain Connected Medical Devices Market Value (USD Billion) Forecast, by End-user, 2021 to 2036
Table 44: The Netherlands Connected Medical Devices Market Value (USD Billion) Forecast, by Product Type, 2021 to 2036
Table 45: The Netherlands Connected Medical Devices Market Value (USD Billion) Forecast, by Technology, 2021 to 2036
Table 46: The Netherlands Connected Medical Devices Market Value (USD Billion) Forecast, by Application, 2021 to 2036
Table 47: The Netherlands Connected Medical Devices Market Value (USD Billion) Forecast, by End-user, 2021 to 2036
Table 48: Switzerland Connected Medical Devices Market Value (USD Billion) Forecast, by Product Type, 2021 to 2036
Table 49: Switzerland Connected Medical Devices Market Value (USD Billion) Forecast, by Technology, 2021 to 2036
Table 50: Switzerland Connected Medical Devices Market Value (USD Billion) Forecast, by Application, 2021 to 2036
Table 51: Switzerland Connected Medical Devices Market Value (USD Billion) Forecast, by End-user, 2021 to 2036
Table 52: Rest of Europe Connected Medical Devices Market Value (USD Billion) Forecast, by Product Type, 2021 to 2036
Table 53: Rest of Europe Connected Medical Devices Market Value (USD Billion) Forecast, by Technology, 2021 to 2036
Table 54: Rest of Europe Connected Medical Devices Market Value (USD Billion) Forecast, by Application, 2021 to 2036
Table 55: Rest of Europe Connected Medical Devices Market Value (USD Billion) Forecast, by End-user, 2021 to 2036
Table 56: Asia Pacific Connected Medical Devices Market Value (USD Billion) Forecast, by Product Type, 2021 to 2036
Table 57: Asia Pacific Connected Medical Devices Market Value (USD Billion) Forecast, by Technology, 2021 to 2036
Table 58: Asia Pacific Connected Medical Devices Market Value (USD Billion) Forecast, by Application, 2021 to 2036
Table 59: Asia Pacific Connected Medical Devices Market Value (USD Billion) Forecast, by End-user, 2021 to 2036
Table 60: Asia Pacific Connected Medical Devices Market Value (USD Billion) Forecast, by Country/Sub-region, 2021 to 2036
Table 61: China Connected Medical Devices Market Value (USD Billion) Forecast, by Product Type, 2021 to 2036
Table 62: China Connected Medical Devices Market Value (USD Billion) Forecast, by Technology, 2021 to 2036
Table 63: China Connected Medical Devices Market Value (USD Billion) Forecast, by Application, 2021 to 2036
Table 64: China Connected Medical Devices Market Value (USD Billion) Forecast, by End-user, 2021 to 2036
Table 65: Japan Connected Medical Devices Market Value (USD Billion) Forecast, by Product Type, 2021 to 2036
Table 66: Japan Connected Medical Devices Market Value (USD Billion) Forecast, by Technology, 2021 to 2036
Table 67: Japan Connected Medical Devices Market Value (USD Billion) Forecast, by Application, 2021 to 2036
Table 68: Japan Connected Medical Devices Market Value (USD Billion) Forecast, by End-user, 2021 to 2036
Table 69: India Connected Medical Devices Market Value (USD Billion) Forecast, by Product Type, 2021 to 2036
Table 70: India Connected Medical Devices Market Value (USD Billion) Forecast, by Technology, 2021 to 2036
Table 71: India Connected Medical Devices Market Value (USD Billion) Forecast, by Application, 2021 to 2036
Table 72: India Connected Medical Devices Market Value (USD Billion) Forecast, by End-user, 2021 to 2036
Table 73: South Korea Connected Medical Devices Market Value (USD Billion) Forecast, by Product Type, 2021 to 2036
Table 74: South Korea Connected Medical Devices Market Value (USD Billion) Forecast, by Technology, 2021 to 2036
Table 75: South Korea Connected Medical Devices Market Value (USD Billion) Forecast, by Application, 2021 to 2036
Table 76: South Korea Connected Medical Devices Market Value (USD Billion) Forecast, by End-user, 2021 to 2036
Table 77: Australia and New Zealand Connected Medical Devices Market Value (USD Billion) Forecast, by Product Type, 2021 to 2036
Table 78: Australia and New Zealand Connected Medical Devices Market Value (USD Billion) Forecast, by Technology, 2021 to 2036
Table 79: Australia and New Zealand Connected Medical Devices Market Value (USD Billion) Forecast, by Application, 2021 to 2036
Table 80: Australia and New Zealand Connected Medical Devices Market Value (USD Billion) Forecast, by End-user, 2021 to 2036
Table 81: Rest of Asia Pacific Connected Medical Devices Market Value (USD Billion) Forecast, by Product Type, 2021 to 2036
Table 82: Rest of Asia Pacific Connected Medical Devices Market Value (USD Billion) Forecast, by Technology, 2021 to 2036
Table 83: Rest of Asia Pacific Connected Medical Devices Market Value (USD Billion) Forecast, by Application, 2021 to 2036
Table 84: Rest of Asia Pacific Connected Medical Devices Market Value (USD Billion) Forecast, by End-user, 2021 to 2036
Table 85: Latin America Connected Medical Devices Market Value (USD Billion) Forecast, by Product Type, 2021 to 2036
Table 86: Latin America Connected Medical Devices Market Value (USD Billion) Forecast, by Technology, 2021 to 2036
Table 87: Latin America Connected Medical Devices Market Value (USD Billion) Forecast, by Application, 2021 to 2036
Table 88: Latin America Connected Medical Devices Market Value (USD Billion) Forecast, by End-user, 2021 to 2036
Table 89: Latin America Connected Medical Devices Market Value (USD Billion) Forecast, by Country/Sub-region, 2021 to 2036
Table 90: Brazil Connected Medical Devices Market Value (USD Billion) Forecast, by Product Type, 2021 to 2036
Table 91: Brazil Connected Medical Devices Market Value (USD Billion) Forecast, by Technology, 2021 to 2036
Table 92: Brazil Connected Medical Devices Market Value (USD Billion) Forecast, by Application, 2021 to 2036
Table 93: Brazil Connected Medical Devices Market Value (USD Billion) Forecast, by End-user, 2021 to 2036
Table 94: Mexico Connected Medical Devices Market Value (USD Billion) Forecast, by Product Type, 2021 to 2036
Table 95: Mexico Connected Medical Devices Market Value (USD Billion) Forecast, by Technology, 2021 to 2036
Table 96: Mexico Connected Medical Devices Market Value (USD Billion) Forecast, by Application, 2021 to 2036
Table 97: Mexico Connected Medical Devices Market Value (USD Billion) Forecast, by End-user, 2021 to 2036
Table 98: Argentina Connected Medical Devices Market Value (USD Billion) Forecast, by Product Type, 2021 to 2036
Table 99: Argentina Connected Medical Devices Market Value (USD Billion) Forecast, by Technology, 2021 to 2036
Table 100: Argentina Connected Medical Devices Market Value (USD Billion) Forecast, by Application, 2021 to 2036
Table 101: Argentina Connected Medical Devices Market Value (USD Billion) Forecast, by End-user, 2021 to 2036
Table 102: Rest of Latin America Connected Medical Devices Market Value (USD Billion) Forecast, by Product Type, 2021 to 2036
Table 103: Rest of Latin America Connected Medical Devices Market Value (USD Billion) Forecast, by Technology, 2021 to 2036
Table 104: Rest of Latin America Connected Medical Devices Market Value (USD Billion) Forecast, by Application, 2021 to 2036
Table 105: Rest of Latin America Connected Medical Devices Market Value (USD Billion) Forecast, by End-user, 2021 to 2036
Table 106: Middle East and Africa Connected Medical Devices Market Value (USD Billion) Forecast, by Product Type, 2021 to 2036
Table 107: Middle East and Africa Connected Medical Devices Market Value (USD Billion) Forecast, by Technology, 2021 to 2036
Table 108: Middle East and Africa Connected Medical Devices Market Value (USD Billion) Forecast, by Application, 2021 to 2036
Table 109: Middle East and Africa Connected Medical Devices Market Value (USD Billion) Forecast, by End-user, 2021 to 2036
Table 110: Middle East and Africa Connected Medical Devices Market Value (USD Billion) Forecast, by Country/Sub-region, 2021 to 2036
Table 111: GCC Countries Connected Medical Devices Market Value (USD Billion) Forecast, by Product Type, 2021 to 2036
Table 112: GCC Countries Connected Medical Devices Market Value (USD Billion) Forecast, by Technology, 2021 to 2036
Table 113: GCC Countries Connected Medical Devices Market Value (USD Billion) Forecast, by Application, 2021 to 2036
Table 114: GCC Countries Connected Medical Devices Market Value (USD Billion) Forecast, by End-user, 2021 to 2036
Table 115: South Africa Connected Medical Devices Market Value (USD Billion) Forecast, by Product Type, 2021 to 2036
Table 116: South Africa Connected Medical Devices Market Value (USD Billion) Forecast, by Technology, 2021 to 2036
Table 117: South Africa Connected Medical Devices Market Value (USD Billion) Forecast, by Application, 2021 to 2036
Table 118: South Africa Connected Medical Devices Market Value (USD Billion) Forecast, by End-user, 2021 to 2036
Table 119: Rest of Middle East and Africa Connected Medical Devices Market Value (USD Billion) Forecast, by Product Type, 2021 to 2036
Table 120: Rest of Middle East and Africa Connected Medical Devices Market Value (USD Billion) Forecast, by Technology, 2021 to 2036
Table 121: Rest of Middle East and Africa Connected Medical Devices Market Value (USD Billion) Forecast, by Application, 2021 to 2036
Table 122: Rest of Middle East and Africa Connected Medical Devices Market Value (USD Billion) Forecast, by End-user, 2021 to 2036
Figure 01: Global Connected Medical Devices Market Value (USD Billion) Forecast, 2021 to 2036
Figure 02: Global Connected Medical Devices Market Value Share Analysis, by Product Type, 2025 and 2036
Figure 03: Global Connected Medical Devices Market Attractiveness Analysis, by Product Type, 2026 to 2036
Figure 04: Global Connected Medical Devices Market Revenue (USD Billion), by Diagnostic & Monitoring Devices, 2021 to 2036
Figure 05: Global Connected Medical Devices Market Revenue (USD Billion), by Therapeutic Devices, 2021 to 2036
Figure 06: Global Connected Medical Devices Market Revenue (USD Billion), by Wearable Devices, 2021 to 2036
Figure 07: Global Connected Medical Devices Market Value Share Analysis, by Technology, 2025 and 2036
Figure 08: Global Connected Medical Devices Market Attractiveness Analysis, by Technology, 2026 to 2036
Figure 09: Global Connected Medical Devices Market Revenue (USD Billion), by Bluetooth, 2021 to 2036
Figure 10: Global Connected Medical Devices Market Revenue (USD Billion), by Wi-Fi, 2021 to 2036
Figure 11: Global Connected Medical Devices Market Revenue (USD Billion), by CellularNFC, 2021 to 2036
Figure 12: Global Connected Medical Devices Market Revenue (USD Billion), by Zigbee, 2021 to 2036
Figure 13: Global Connected Medical Devices Market Value Share Analysis, by Application, 2025 and 2036
Figure 14: Global Connected Medical Devices Market Attractiveness Analysis, by Application, 2026 to 2036
Figure 15: Global Connected Medical Devices Market Revenue (USD Billion), by Cardiology, 2021 to 2036
Figure 16: Global Connected Medical Devices Market Revenue (USD Billion), by Diabetes Management, 2021 to 2036
Figure 17: Global Connected Medical Devices Market Revenue (USD Billion), by Neurology, 2021 to 2036
Figure 18: Global Connected Medical Devices Market Revenue (USD Billion), by Respiratory, 2021 to 2036
Figure 19: Global Connected Medical Devices Market Revenue (USD Billion), by Sleep Apnea, 2021 to 2036
Figure 20: Global Connected Medical Devices Market Revenue (USD Billion), by Others, 2021 to 2036
Figure 21: Global Connected Medical Devices Market Value Share Analysis, by End-user, 2025 and 2036
Figure 22: Global Connected Medical Devices Market Attractiveness Analysis, by End-user, 2026 to 2036
Figure 23: Global Connected Medical Devices Market Revenue (USD Billion), by Hospitals & Clinics, 2021 to 2036
Figure 24: Global Connected Medical Devices Market Revenue (USD Billion), by Home Healthcare, 2021 to 2036
Figure 25: Global Connected Medical Devices Market Revenue (USD Billion), by Ambulatory Surgical Centers, 2021 to 2036
Figure 26: Global Connected Medical Devices Market Revenue (USD Billion), by Diagnostic Centers, 2021 to 2036
Figure 27: Global Connected Medical Devices Market Value Share Analysis, by Country/Sub-region, 2025 and 2036
Figure 28: Global Connected Medical Devices Market Attractiveness Analysis, by Country/Sub-region, 2026 to 2036
Figure 29: North America Connected Medical Devices Market Value (USD Billion) Forecast, 2021 to 2036
Figure 30: North America Connected Medical Devices Market Value Share Analysis, by Product Type, 2025 and 2036
Figure 31: North America Connected Medical Devices Market Attractiveness Analysis, by Product Type, 2026 to 2036
Figure 32: North America Connected Medical Devices Market Value Share Analysis, by Technology, 2025 and 2036
Figure 33: North America Connected Medical Devices Market Attractiveness Analysis, by Technology, 2026 to 2036
Figure 34: North America Connected Medical Devices Market Value Share Analysis, by Application, 2025 and 2036
Figure 35: North America Connected Medical Devices Market Attractiveness Analysis, by Application, 2026 to 2036
Figure 36: North America Connected Medical Devices Market Value Share Analysis, by End-user, 2025 and 2036
Figure 37: North America Connected Medical Devices Market Attractiveness Analysis, by End-user, 2026 to 2036
Figure 38: North America Connected Medical Devices Market Value Share Analysis, by Country/Sub-region, 2025 and 2036
Figure 39: North America Connected Medical Devices Market Attractiveness Analysis, by Country/Sub-region, 2026 to 2036
Figure 40: U.S. Connected Medical Devices Market Value (USD Billion) Forecast, 2021 to 2036
Figure 41: U.S. Connected Medical Devices Market Value Share Analysis, by Product Type, 2025 and 2036
Figure 42: U.S. Connected Medical Devices Market Attractiveness Analysis, by Product Type, 2026 to 2036
Figure 43: U.S. Connected Medical Devices Market Value Share Analysis, by Technology, 2025 and 2036
Figure 44: U.S. Connected Medical Devices Market Attractiveness Analysis, by Technology, 2026 to 2036
Figure 45: U.S. Connected Medical Devices Market Value Share Analysis, by Application, 2025 and 2036
Figure 46: U.S. Connected Medical Devices Market Attractiveness Analysis, by Application, 2026 to 2036
Figure 47: U.S. Connected Medical Devices Market Value Share Analysis, by End-user, 2025 and 2036
Figure 48: U.S. Connected Medical Devices Market Attractiveness Analysis, by End-user, 2026 to 2036
Figure 49: Canada Connected Medical Devices Market Value (USD Billion) Forecast, 2021 to 2036
Figure 50: Canada Connected Medical Devices Market Value Share Analysis, by Product Type, 2025 and 2036
Figure 51: Canada Connected Medical Devices Market Attractiveness Analysis, by Product Type, 2026 to 2036
Figure 52: Canada Connected Medical Devices Market Value Share Analysis, by Technology, 2025 and 2036
Figure 53: Canada Connected Medical Devices Market Attractiveness Analysis, by Technology, 2026 to 2036
Figure 54: Canada Connected Medical Devices Market Value Share Analysis, by Application, 2025 and 2036
Figure 55: Canada Connected Medical Devices Market Attractiveness Analysis, by Application, 2026 to 2036
Figure 56: Canada Connected Medical Devices Market Value Share Analysis, by End-user, 2025 and 2036
Figure 57: Canada Connected Medical Devices Market Attractiveness Analysis, by End-user, 2026 to 2036
Figure 58: Europe Connected Medical Devices Market Value (USD Billion) Forecast, 2021 to 2036
Figure 59: Europe Connected Medical Devices Market Value Share Analysis, by Product Type, 2025 and 2036
Figure 60: Europe Connected Medical Devices Market Attractiveness Analysis, by Product Type, 2026 to 2036
Figure 61: Europe Connected Medical Devices Market Value Share Analysis, by Technology, 2025 and 2036
Figure 62: Europe Connected Medical Devices Market Attractiveness Analysis, by Technology, 2026 to 2036
Figure 63: Europe Connected Medical Devices Market Value Share Analysis, by Application, 2025 and 2036
Figure 64: Europe Connected Medical Devices Market Attractiveness Analysis, by Application, 2026 to 2036
Figure 65: Europe Connected Medical Devices Market Value Share Analysis, by End-user, 2025 and 2036
Figure 66: Europe Connected Medical Devices Market Attractiveness Analysis, by End-user, 2026 to 2036
Figure 67: Europe Connected Medical Devices Market Value Share Analysis, by Country/Sub-region, 2025 and 2036
Figure 68: Europe Connected Medical Devices Market Attractiveness Analysis, by Country/Sub-region, 2026 to 2036
Figure 69: Germany Connected Medical Devices Market Value (USD Billion) Forecast, 2021 to 2036
Figure 70: Germany Connected Medical Devices Market Value Share Analysis, by Product Type, 2025 and 2036
Figure 71: Germany Connected Medical Devices Market Attractiveness Analysis, by Product Type, 2026 to 2036
Figure 72: Germany Connected Medical Devices Market Value Share Analysis, by Technology, 2025 and 2036
Figure 73: Germany Connected Medical Devices Market Attractiveness Analysis, by Technology, 2026 to 2036
Figure 74: Germany Connected Medical Devices Market Value Share Analysis, by Application, 2025 and 2036
Figure 75: Germany Connected Medical Devices Market Attractiveness Analysis, by Application, 2026 to 2036
Figure 76: Germany Connected Medical Devices Market Value Share Analysis, by End-user, 2025 and 2036
Figure 77: Germany Connected Medical Devices Market Attractiveness Analysis, by End-user, 2026 to 2036
Figure 78: U.K. Connected Medical Devices Market Value (USD Billion) Forecast, 2021 to 2036
Figure 79: U.K. Connected Medical Devices Market Value Share Analysis, by Product Type, 2025 and 2036
Figure 80: U.K. Connected Medical Devices Market Attractiveness Analysis, by Product Type, 2026 to 2036
Figure 81: U.K. Connected Medical Devices Market Value Share Analysis, by Technology, 2025 and 2036
Figure 82: U.K. Connected Medical Devices Market Attractiveness Analysis, by Technology, 2026 to 2036
Figure 83: U.K. Connected Medical Devices Market Value Share Analysis, by Application, 2025 and 2036
Figure 84: U.K. Connected Medical Devices Market Attractiveness Analysis, by Application, 2026 to 2036
Figure 85: U.K. Connected Medical Devices Market Value Share Analysis, by End-user, 2025 and 2036
Figure 86: U.K. Connected Medical Devices Market Attractiveness Analysis, by End-user, 2026 to 2036
Figure 87: France Connected Medical Devices Market Value (USD Billion) Forecast, 2021 to 2036
Figure 88: France Connected Medical Devices Market Value Share Analysis, by Product Type, 2025 and 2036
Figure 89: France Connected Medical Devices Market Attractiveness Analysis, by Product Type, 2026 to 2036
Figure 90: France Connected Medical Devices Market Value Share Analysis, by Technology, 2025 and 2036
Figure 91: France Connected Medical Devices Market Attractiveness Analysis, by Technology, 2026 to 2036
Figure 92: France Connected Medical Devices Market Value Share Analysis, by Application, 2025 and 2036
Figure 93: France Connected Medical Devices Market Attractiveness Analysis, by Application, 2026 to 2036
Figure 94: France Connected Medical Devices Market Value Share Analysis, by End-user, 2025 and 2036
Figure 95: France Connected Medical Devices Market Attractiveness Analysis, by End-user, 2026 to 2036
Figure 96: Italy Connected Medical Devices Market Value (USD Billion) Forecast, 2021 to 2036
Figure 97: Italy Connected Medical Devices Market Value Share Analysis, by Product Type, 2025 and 2036
Figure 98: Italy Connected Medical Devices Market Attractiveness Analysis, by Product Type, 2026 to 2036
Figure 99: Italy Connected Medical Devices Market Value Share Analysis, by Technology, 2025 and 2036
Figure 100: Italy Connected Medical Devices Market Attractiveness Analysis, by Technology, 2026 to 2036
Figure 101: Italy Connected Medical Devices Market Value Share Analysis, by Application, 2025 and 2036
Figure 102: Italy Connected Medical Devices Market Attractiveness Analysis, by Application, 2026 to 2036
Figure 103: Italy Connected Medical Devices Market Value Share Analysis, by End-user, 2025 and 2036
Figure 104: Italy Connected Medical Devices Market Attractiveness Analysis, by End-user, 2026 to 2036
Figure 105: Spain Connected Medical Devices Market Value (USD Billion) Forecast, 2021 to 2036
Figure 106: Spain Connected Medical Devices Market Value Share Analysis, by Product Type, 2025 and 2036
Figure 107: Spain Connected Medical Devices Market Attractiveness Analysis, by Product Type, 2026 to 2036
Figure 108: Spain Connected Medical Devices Market Value Share Analysis, by Technology, 2025 and 2036
Figure 109: Spain Connected Medical Devices Market Attractiveness Analysis, by Technology, 2026 to 2036
Figure 110: Spain Connected Medical Devices Market Value Share Analysis, by Application, 2025 and 2036
Figure 111: Spain Connected Medical Devices Market Attractiveness Analysis, by Application, 2026 to 2036
Figure 112: Spain Connected Medical Devices Market Value Share Analysis, by End-user, 2025 and 2036
Figure 113: Spain Connected Medical Devices Market Attractiveness Analysis, by End-user, 2026 to 2036
Figure 114: The Netherlands Connected Medical Devices Market Value (USD Billion) Forecast, 2021 to 2036
Figure 115: The Netherlands Connected Medical Devices Market Value Share Analysis, by Product Type, 2025 and 2036
Figure 116: The Netherlands Connected Medical Devices Market Attractiveness Analysis, by Product Type, 2026 to 2036
Figure 117: The Netherlands Connected Medical Devices Market Value Share Analysis, by Technology, 2025 and 2036
Figure 118: The Netherlands Connected Medical Devices Market Attractiveness Analysis, by Technology, 2026 to 2036
Figure 119: The Netherlands Connected Medical Devices Market Value Share Analysis, by Application, 2025 and 2036
Figure 120: The Netherlands Connected Medical Devices Market Attractiveness Analysis, by Application, 2026 to 2036
Figure 121: The Netherlands Connected Medical Devices Market Value Share Analysis, by End-user, 2025 and 2036
Figure 122: The Netherlands Connected Medical Devices Market Attractiveness Analysis, by End-user, 2026 to 2036
Figure 123: Switzerland Connected Medical Devices Market Value (USD Billion) Forecast, 2021 to 2036
Figure 124: Switzerland Connected Medical Devices Market Value Share Analysis, by Product Type, 2025 and 2036
Figure 125: Switzerland Connected Medical Devices Market Attractiveness Analysis, by Product Type, 2026 to 2036
Figure 126: Switzerland Connected Medical Devices Market Value Share Analysis, by Technology, 2025 and 2036
Figure 127: Switzerland Connected Medical Devices Market Attractiveness Analysis, by Technology, 2026 to 2036
Figure 128: Switzerland Connected Medical Devices Market Value Share Analysis, by Application, 2025 and 2036
Figure 129: Switzerland Connected Medical Devices Market Attractiveness Analysis, by Application, 2026 to 2036
Figure 130: Switzerland Connected Medical Devices Market Value Share Analysis, by End-user, 2025 and 2036
Figure 131: Switzerland Connected Medical Devices Market Attractiveness Analysis, by End-user, 2026 to 2036
Figure 132: Rest of Europe Connected Medical Devices Market Value (USD Billion) Forecast, 2021 to 2036
Figure 133: Rest of Europe Connected Medical Devices Market Value Share Analysis, by Product Type, 2025 and 2036
Figure 134: Rest of Europe Connected Medical Devices Market Attractiveness Analysis, by Product Type, 2026 to 2036
Figure 135: Rest of Europe Connected Medical Devices Market Value Share Analysis, by Technology, 2025 and 2036
Figure 136: Rest of Europe Connected Medical Devices Market Attractiveness Analysis, by Technology, 2026 to 2036
Figure 137: Rest of Europe Connected Medical Devices Market Value Share Analysis, by Application, 2025 and 2036
Figure 138: Rest of Europe Connected Medical Devices Market Attractiveness Analysis, by Application, 2026 to 2036
Figure 139: Rest of Europe Connected Medical Devices Market Value Share Analysis, by End-user, 2025 and 2036
Figure 140: Rest of Europe Connected Medical Devices Market Attractiveness Analysis, by End-user, 2026 to 2036
Figure 141: Asia Pacific Connected Medical Devices Market Value (USD Billion) Forecast, 2021 to 2036
Figure 142: Asia Pacific Connected Medical Devices Market Value Share Analysis, by Product Type, 2025 and 2036
Figure 143: Asia Pacific Connected Medical Devices Market Attractiveness Analysis, by Product Type, 2026 to 2036
Figure 144: Asia Pacific Connected Medical Devices Market Value Share Analysis, by Technology, 2025 and 2036
Figure 145: Asia Pacific Connected Medical Devices Market Attractiveness Analysis, by Technology, 2026 to 2036
Figure 146: Asia Pacific Connected Medical Devices Market Value Share Analysis, by Application, 2025 and 2036
Figure 147: Asia Pacific Connected Medical Devices Market Attractiveness Analysis, by Application, 2026 to 2036
Figure 148: Asia Pacific Connected Medical Devices Market Value Share Analysis, by End-user, 2025 and 2036
Figure 149: Asia Pacific Connected Medical Devices Market Attractiveness Analysis, by End-user, 2026 to 2036
Figure 150: Asia Pacific Connected Medical Devices Market Value Share Analysis, by Country/Sub-region, 2025 and 2036
Figure 151: Asia Pacific Connected Medical Devices Market Attractiveness Analysis, by Country/Sub-region, 2026 to 2036
Figure 152: China Connected Medical Devices Market Value (USD Billion) Forecast, 2021 to 2036
Figure 153: China Connected Medical Devices Market Value Share Analysis, by Product Type, 2025 and 2036
Figure 154: China Connected Medical Devices Market Attractiveness Analysis, by Product Type, 2026 to 2036
Figure 155: China Connected Medical Devices Market Value Share Analysis, by Technology, 2025 and 2036
Figure 156: China Connected Medical Devices Market Attractiveness Analysis, by Technology, 2026 to 2036
Figure 157: China Connected Medical Devices Market Value Share Analysis, by Application, 2025 and 2036
Figure 158: China Connected Medical Devices Market Attractiveness Analysis, by Application, 2026 to 2036
Figure 159: China Connected Medical Devices Market Value Share Analysis, by End-user, 2025 and 2036
Figure 160: China Connected Medical Devices Market Attractiveness Analysis, by End-user, 2026 to 2036
Figure 161: Japan Connected Medical Devices Market Value (USD Billion) Forecast, 2021 to 2036
Figure 162: Japan Connected Medical Devices Market Value Share Analysis, by Product Type, 2025 and 2036
Figure 163: Japan Connected Medical Devices Market Attractiveness Analysis, by Product Type, 2026 to 2036
Figure 164: Japan Connected Medical Devices Market Value Share Analysis, by Technology, 2025 and 2036
Figure 165: Japan Connected Medical Devices Market Attractiveness Analysis, by Technology, 2026 to 2036
Figure 166: Japan Connected Medical Devices Market Value Share Analysis, by Application, 2025 and 2036
Figure 167: Japan Connected Medical Devices Market Attractiveness Analysis, by Application, 2026 to 2036
Figure 168: Japan Connected Medical Devices Market Value Share Analysis, by End-user, 2025 and 2036
Figure 169: Japan Connected Medical Devices Market Attractiveness Analysis, by End-user, 2026 to 2036
Figure 170: India Connected Medical Devices Market Value (USD Billion) Forecast, 2021 to 2036
Figure 171: India Connected Medical Devices Market Value Share Analysis, by Product Type, 2025 and 2036
Figure 172: India Connected Medical Devices Market Attractiveness Analysis, by Product Type, 2026 to 2036
Figure 173: India Connected Medical Devices Market Value Share Analysis, by Technology, 2025 and 2036
Figure 174: India Connected Medical Devices Market Attractiveness Analysis, by Technology, 2026 to 2036
Figure 175: India Connected Medical Devices Market Value Share Analysis, by Application, 2025 and 2036
Figure 176: India Connected Medical Devices Market Attractiveness Analysis, by Application, 2026 to 2036
Figure 177: India Connected Medical Devices Market Value Share Analysis, by End-user, 2025 and 2036
Figure 178: India Connected Medical Devices Market Attractiveness Analysis, by End-user, 2026 to 2036
Figure 179: South Korea Connected Medical Devices Market Value (USD Billion) Forecast, 2021 to 2036
Figure 180: South Korea Connected Medical Devices Market Value Share Analysis, by Product Type, 2025 and 2036
Figure 181: South Korea Connected Medical Devices Market Attractiveness Analysis, by Product Type, 2026 to 2036
Figure 182: South Korea Connected Medical Devices Market Value Share Analysis, by Technology, 2025 and 2036
Figure 183: South Korea Connected Medical Devices Market Attractiveness Analysis, by Technology, 2026 to 2036
Figure 184: South Korea Connected Medical Devices Market Value Share Analysis, by Application, 2025 and 2036
Figure 185: South Korea Connected Medical Devices Market Attractiveness Analysis, by Application, 2026 to 2036
Figure 186: South Korea Connected Medical Devices Market Value Share Analysis, by End-user, 2025 and 2036
Figure 187: South Korea Connected Medical Devices Market Attractiveness Analysis, by End-user, 2026 to 2036
Figure 188: Australia and New Zealand Connected Medical Devices Market Value (USD Billion) Forecast, 2021 to 2036
Figure 189: Australia and New Zealand Connected Medical Devices Market Value Share Analysis, by Product Type, 2025 and 2036
Figure 190: Australia and New Zealand Connected Medical Devices Market Attractiveness Analysis, by Product Type, 2026 to 2036
Figure 191: Australia and New Zealand Connected Medical Devices Market Value Share Analysis, by Technology, 2025 and 2036
Figure 192: Australia and New Zealand Connected Medical Devices Market Attractiveness Analysis, by Technology, 2026 to 2036
Figure 193: Australia and New Zealand Connected Medical Devices Market Value Share Analysis, by Application, 2025 and 2036
Figure 194: Australia and New Zealand Connected Medical Devices Market Attractiveness Analysis, by Application, 2026 to 2036
Figure 195: Australia and New Zealand Connected Medical Devices Market Value Share Analysis, by End-user, 2025 and 2036
Figure 196: Australia and New Zealand Connected Medical Devices Market Attractiveness Analysis, by End-user, 2026 to 2036
Figure 197: Rest of Asia Pacific Connected Medical Devices Market Value (USD Billion) Forecast, 2021 to 2036
Figure 198: Rest of Asia Pacific Connected Medical Devices Market Value Share Analysis, by Product Type, 2025 and 2036
Figure 199: Rest of Asia Pacific Connected Medical Devices Market Attractiveness Analysis, by Product Type, 2026 to 2036
Figure 200: Rest of Asia Pacific Connected Medical Devices Market Value Share Analysis, by Technology, 2025 and 2036
Figure 201: Rest of Asia Pacific Connected Medical Devices Market Attractiveness Analysis, by Technology, 2026 to 2036
Figure 202: Rest of Asia Pacific Connected Medical Devices Market Value Share Analysis, by Application, 2025 and 2036
Figure 203: Rest of Asia Pacific Connected Medical Devices Market Attractiveness Analysis, by Application, 2026 to 2036
Figure 204: Rest of Asia Pacific Connected Medical Devices Market Value Share Analysis, by End-user, 2025 and 2036
Figure 205: Rest of Asia Pacific Connected Medical Devices Market Attractiveness Analysis, by End-user, 2026 to 2036
Figure 206: Latin America Connected Medical Devices Market Value (USD Billion) Forecast, 2021 to 2036
Figure 207: Latin America Connected Medical Devices Market Value Share Analysis, by Product Type, 2025 and 2036
Figure 208: Latin America Connected Medical Devices Market Attractiveness Analysis, by Product Type, 2026 to 2036
Figure 209: Latin America Connected Medical Devices Market Value Share Analysis, by Technology, 2025 and 2036
Figure 210: Latin America Connected Medical Devices Market Attractiveness Analysis, by Technology, 2026 to 2036
Figure 211: Latin America Connected Medical Devices Market Value Share Analysis, by Application, 2025 and 2036
Figure 212: Latin America Connected Medical Devices Market Attractiveness Analysis, by Application, 2026 to 2036
Figure 213: Latin America Connected Medical Devices Market Value Share Analysis, by End-user, 2025 and 2036
Figure 214: Latin America Connected Medical Devices Market Attractiveness Analysis, by End-user, 2026 to 2036
Figure 215: Latin America Connected Medical Devices Market Value Share Analysis, by Country/Sub-region, 2025 and 2036
Figure 216: Latin America Connected Medical Devices Market Attractiveness Analysis, by Country/Sub-region, 2026 to 2036
Figure 217: Brazil Connected Medical Devices Market Value (USD Billion) Forecast, 2021 to 2036
Figure 218: Brazil Connected Medical Devices Market Value Share Analysis, by Product Type, 2025 and 2036
Figure 219: Brazil Connected Medical Devices Market Attractiveness Analysis, by Product Type, 2026 to 2036
Figure 220: Brazil Connected Medical Devices Market Value Share Analysis, by Technology, 2025 and 2036
Figure 221: Brazil Connected Medical Devices Market Attractiveness Analysis, by Technology, 2026 to 2036
Figure 222: Brazil Connected Medical Devices Market Value Share Analysis, by Application, 2025 and 2036
Figure 223: Brazil Connected Medical Devices Market Attractiveness Analysis, by Application, 2026 to 2036
Figure 224: Brazil Connected Medical Devices Market Value Share Analysis, by End-user, 2025 and 2036
Figure 225: Brazil Connected Medical Devices Market Attractiveness Analysis, by End-user, 2026 to 2036
Figure 226: Mexico Connected Medical Devices Market Value (USD Billion) Forecast, 2021 to 2036
Figure 227: Mexico Connected Medical Devices Market Value Share Analysis, by Product Type, 2025 and 2036
Figure 228: Mexico Connected Medical Devices Market Attractiveness Analysis, by Product Type, 2026 to 2036
Figure 229: Mexico Connected Medical Devices Market Value Share Analysis, by Technology, 2025 and 2036
Figure 230: Mexico Connected Medical Devices Market Attractiveness Analysis, by Technology, 2026 to 2036
Figure 231: Mexico Connected Medical Devices Market Value Share Analysis, by Application, 2025 and 2036
Figure 232: Mexico Connected Medical Devices Market Attractiveness Analysis, by Application, 2026 to 2036
Figure 233: Mexico Connected Medical Devices Market Value Share Analysis, by End-user, 2025 and 2036
Figure 234: Mexico Connected Medical Devices Market Attractiveness Analysis, by End-user, 2026 to 2036
Figure 235: Argentina Connected Medical Devices Market Value (USD Billion) Forecast, 2021 to 2036
Figure 236: Argentina Connected Medical Devices Market Value Share Analysis, by Product Type, 2025 and 2036
Figure 237: Argentina Connected Medical Devices Market Attractiveness Analysis, by Product Type, 2026 to 2036
Figure 238: Argentina Connected Medical Devices Market Value Share Analysis, by Technology, 2025 and 2036
Figure 239: Argentina Connected Medical Devices Market Attractiveness Analysis, by Technology, 2026 to 2036
Figure 240: Argentina Connected Medical Devices Market Value Share Analysis, by Application, 2025 and 2036
Figure 241: Argentina Connected Medical Devices Market Attractiveness Analysis, by Application, 2026 to 2036
Figure 242: Argentina Connected Medical Devices Market Value Share Analysis, by End-user, 2025 and 2036
Figure 243: Argentina Connected Medical Devices Market Attractiveness Analysis, by End-user, 2026 to 2036
Figure 244: Rest of Latin America Connected Medical Devices Market Value (USD Billion) Forecast, 2021 to 2036
Figure 245: Rest of Latin America Connected Medical Devices Market Value Share Analysis, by Product Type, 2025 and 2036
Figure 246: Rest of Latin America Connected Medical Devices Market Attractiveness Analysis, by Product Type, 2026 to 2036
Figure 247: Rest of Latin America Connected Medical Devices Market Value Share Analysis, by Technology, 2025 and 2036
Figure 248: Rest of Latin America Connected Medical Devices Market Attractiveness Analysis, by Technology, 2026 to 2036
Figure 249: Rest of Latin America Connected Medical Devices Market Value Share Analysis, by Application, 2025 and 2036
Figure 250: Rest of Latin America Connected Medical Devices Market Attractiveness Analysis, by Application, 2026 to 2036
Figure 251: Rest of Latin America Connected Medical Devices Market Value Share Analysis, by End-user, 2025 and 2036
Figure 252: Rest of Latin America Connected Medical Devices Market Attractiveness Analysis, by End-user, 2026 to 2036
Figure 253: Middle East and Africa Connected Medical Devices Market Value (USD Billion) Forecast, 2021 to 2036
Figure 254: Middle East and Africa Connected Medical Devices Market Value Share Analysis, by Product Type, 2025 and 2036
Figure 255: Middle East and Africa Connected Medical Devices Market Attractiveness Analysis, by Product Type, 2026 to 2036
Figure 256: Middle East and Africa Connected Medical Devices Market Value Share Analysis, by Technology, 2025 and 2036
Figure 257: Middle East and Africa Connected Medical Devices Market Attractiveness Analysis, by Technology, 2026 to 2036
Figure 258: Middle East and Africa Connected Medical Devices Market Value Share Analysis, by Application, 2025 and 2036
Figure 259: Middle East and Africa Connected Medical Devices Market Attractiveness Analysis, by Application, 2026 to 2036
Figure 260: Middle East and Africa Connected Medical Devices Market Value Share Analysis, by End-user, 2025 and 2036
Figure 261: Middle East and Africa Connected Medical Devices Market Attractiveness Analysis, by End-user, 2026 to 2036
Figure 262: Middle East and Africa Connected Medical Devices Market Value Share Analysis, by Country/Sub-region, 2025 and 2036
Figure 263: Middle East and Africa Connected Medical Devices Market Attractiveness Analysis, by Country/Sub-region, 2026 to 2036
Figure 264: GCC Countries Connected Medical Devices Market Value (USD Billion) Forecast, 2021 to 2036
Figure 265: GCC Countries Connected Medical Devices Market Value Share Analysis, by Product Type, 2025 and 2036
Figure 266: GCC Countries Connected Medical Devices Market Attractiveness Analysis, by Product Type, 2026 to 2036
Figure 267: GCC Countries Connected Medical Devices Market Value Share Analysis, by Technology, 2025 and 2036
Figure 268: GCC Countries Connected Medical Devices Market Attractiveness Analysis, by Technology, 2026 to 2036
Figure 269: GCC Countries Connected Medical Devices Market Value Share Analysis, by Application, 2025 and 2036
Figure 270: GCC Countries Connected Medical Devices Market Attractiveness Analysis, by Application, 2026 to 2036
Figure 271: GCC Countries Connected Medical Devices Market Value Share Analysis, by End-user, 2025 and 2036
Figure 272: GCC Countries Connected Medical Devices Market Attractiveness Analysis, by End-user, 2026 to 2036
Figure 273: South Africa Connected Medical Devices Market Value (USD Billion) Forecast, 2021 to 2036
Figure 274: South Africa Connected Medical Devices Market Value Share Analysis, by Product Type, 2025 and 2036
Figure 275: South Africa Connected Medical Devices Market Attractiveness Analysis, by Product Type, 2026 to 2036
Figure 276: South Africa Connected Medical Devices Market Value Share Analysis, by Technology, 2025 and 2036
Figure 277: South Africa Connected Medical Devices Market Attractiveness Analysis, by Technology, 2026 to 2036
Figure 278: South Africa Connected Medical Devices Market Value Share Analysis, by Application, 2025 and 2036
Figure 279: South Africa Connected Medical Devices Market Attractiveness Analysis, by Application, 2026 to 2036
Figure 280: South Africa Connected Medical Devices Market Value Share Analysis, by End-user, 2025 and 2036
Figure 281: South Africa Connected Medical Devices Market Attractiveness Analysis, by End-user, 2026 to 2036
Figure 282: Rest of Middle East and Africa Connected Medical Devices Market Value (USD Billion) Forecast, 2021 to 2036
Figure 283: Rest of Middle East and Africa Connected Medical Devices Market Value Share Analysis, by Product Type, 2025 and 2036
Figure 284: Rest of Middle East and Africa Connected Medical Devices Market Attractiveness Analysis, by Product Type, 2026 to 2036
Figure 285: Rest of Middle East and Africa Connected Medical Devices Market Value Share Analysis, by Technology, 2025 and 2036
Figure 286: Rest of Middle East and Africa Connected Medical Devices Market Attractiveness Analysis, by Technology, 2026 to 2036
Figure 287: Rest of Middle East and Africa Connected Medical Devices Market Value Share Analysis, by Application, 2025 and 2036
Figure 288: Rest of Middle East and Africa Connected Medical Devices Market Attractiveness Analysis, by Application, 2026 to 2036
Figure 289: Rest of Middle East and Africa Connected Medical Devices Market Value Share Analysis, by End-user, 2025 and 2036
Figure 290: Rest of Middle East and Africa Connected Medical Devices Market Attractiveness Analysis, by End-user, 2026 to 2036
Copyright © Transparency Market Research, Inc. All Rights reserved
Trust Online


Connected Medical Devices Market
