
Reports
Reports
Analysts’ Viewpoint on Wide Band Gap Semiconductors Market Scenario
High demand for wide band gap (WBG) semiconductor materials in commercial and industrial applications is driving the global wide band gap semiconductors market. WBG semiconductors are utilized in power supply systems, PV inverters, motor drives, chargers and adapters, EV chargers, SMPS, and several other industrial applications. WBG materials are also used in large, high-efficiency data centers. Power electronics components that use WBG semiconductor materials are more compact, fast, reliable, and efficient than those using silicon (Si) as a semiconductor. This is primarily because WBG semiconductors are more efficient and can function at higher temperatures, voltages, and switching frequencies than Si semiconductors. However, the limitation of thermal conductivity in homogenous SiC and GaN substrates poses a challenge for manufacturers. Thus, market players are continuously focused on R&D in wide band gap technology to introduce robust products in the market.
Band gap is the amount of energy needed for electrons and holes to move from a valence band to a conduction band. The band gap of silicon is 1.12 electron volt (eV). Semiconductors with wide band gaps include silicon carbide (SiC) and gallium nitride (GaN). These semiconductors can function at higher voltages, temperatures, and frequencies, as they offer a large eV value. Various benefits of wide band gap devices include high-energy efficiency, compact size, lightweight, and low cost.
Demand for hybrid/electric vehicles is rapidly increasing across the globe, particularly in China and a few prominent countries in Europe. Various governments are limiting the production and sale of diesel- and gasoline-powered vehicles. The U.K., France, and some states in the U.S have committed to stop the sale of fossil fuel-powered vehicles by the year 2040. The Government of Norway aims for battery-operated electric vehicles to make up all new automobile sales in the nation by 2025. The U.S has set a goal of 50% electric vehicle sales by 2030. By the end of this decade, the European Commission aims to see at least 30 million electric vehicles on the road, a significant increase from the 1.4 million EVs that are already sold in the region. Additionally, one million electric and hydrogen vehicle charging stations are to be installed by 2025, as part of the EU's €750 Bn stimulus package, which also includes €20 Bn to increase sales of clean vehicles.
These initiatives have prompted automakers to surge investments in the production of hybrid and electric vehicles. In May 2022, Volkswagen and Mahindra & Mahindra signed a partnering agreement to explore the use of MEB electric components for Mahindra’s new “Born Electric Platform. Power electronics components are essential to the production of electric vehicles. Gallium nitride is a promising replacement for silicon in electro-mobility and solar applications. Electric vehicle manufacturers are increasingly adopting GaN and SiC-based components, including HV-LV DC-DC converters, driver ICs, onboard chargers, motor drives, and charging equipment. Thus, initiatives to boost the adaption of clean vehicles and the subsequent increase in production of EVs are augmenting the global wide band gap semiconductors market.
Increase in the demand for wideband laser diodes, SiC power, and GaN semiconductor devices in computers, military devices, electric vehicles, and photovoltaic inverters is fueling the global wide band gap semiconductors market. Wide band gap materials are cheap and widely available. They are utilized in the production of wide band gap power electronics devices and solid-state lighting devices. Tech companies are investing heavily in R&D activities for WBG materials to remain competitive in the market. In February 2022, Infineon Technologies AG invested around US$ 2.02 Bn to strengthen its power semiconductors manufacturing capacities in WBG semiconductors by building a third module at its site in Kulim, Malaysia. This new module is expected to generate around US$ 2 Bn in additional annual revenue with products based on silicon carbide and gallium nitride.
In terms of material, the global wide band gap semiconductors market has been classified into silicon carbide (SiC), gallium nitride (GaN), diamond, and others. The silicon carbide (SiC) segment held a major share of 62.4% of the market in 2021. The segment is expected to maintain the status quo at advance at a rate of 22.97% during the forecast period.
SiC offers higher performance, better thermal conductivity, and thermal stability across diverse wide band gap semiconductor applications while requiring less energy and physical space as compared to conventional silicon technologies. These features enable SiC to deliver consistent and reliable performance in high-voltage and high-temperature applications such as AC-DC rectifiers, power factor correction (PFC) circuits, battery chargers, DC-DC converters, DC-AC inverters and frequency changers in EVs, and rail traction control and data centers.
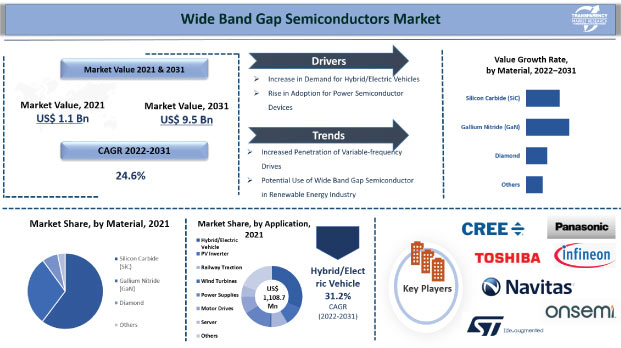
Based on application, the global wide band gap semiconductors market has been segregated into hybrid/electric vehicles, PV inverters, railway tractions, wind turbines, power supplies, motor drives, servers, and others. The hybrid/electric vehicles segment held the largest share of 31.2% of the market in 2021. It is expected to register a CAGR of 27.9% during the forecast period.
Hybrid and EV manufacturers are developing efficient power-conversion solutions for several powertrain stages. GaN and SiC devices are used to develop an effective powertrain architecture that can fulfill EVs’ efficiency and power density requirements. The entire power conversion chain in EVs must operate at its highest level of efficiency to achieve longest driving distance possible per charge for the available battery capacity. WBG semiconductor devices offer higher efficiency and switching frequency and can withstand higher operating temperatures and voltages. Thus, a rise in the demand for WBG semiconductors devices in EVs is driving the global wide band gap semiconductors market.
Asia Pacific held the largest share of 49.3% of the global wide band gap semiconductors market in 2021. Growth of the market in the region can be ascribed to an increase in government support for R&D in WBG materials in China and Japan. Rise in demand for energy-efficient semiconductor devices in end-use industries including automotive, IT & telecoms, and consumer electronics, and increase in penetration of smartphones, mobile internet services, and energy and utility devices are also fueling the market in the region.
North America and Europe are also prominent markets for wide band gap semiconductors, and these regions held value shares of 26.9% and 16.8% of the global market, respectively, in 2021. Early penetration of WBG semiconductors in these regions and the launch of new products are driving the market in these regions. In June 2021, the U.S. Naval Research Laboratory launched GaN wide bandgap semiconductors, thereby enabling 1200V and beyond power switches for 200 mm large-scale manufacturing. South America and Middle East & Africa held relatively minor shares of the global market. However, these regions are projected to witness lucrative growth opportunities in the wide band gap semiconductors market during the forecast period.
The market is consolidated, with a small number of large-scale wide band gap semiconductors manufacturers controlling the majority of the market share. The majority of companies are investing in the R&D of environment-friendly products to enhance their wide band gap semiconductors market share. Expansion of product portfolios and mergers and acquisitions are prominent strategies adopted by key players. Avago Technologies (Braodcom), Cree Inc., Infineon Technologies AG, Navitas Semiconductor, Nexperia, On Semiconductor, Panasonic Corporation, ROHM Semiconductor, STMicroelectronics N.V., and Toshiba Electronic Devices & Storage Corporation are the prominent entities operating in this market.
In November 2021, Nexperia launched 650 V, 10 A SiC Schottky diodes, a new family of high-performance Silicon Carbide (SiC) diodes, thereby expanding its wide bandgap semiconductors offering. The SiC Schottky diode is utilized in Switch Mode Power Supply (SMPS), AC-DC and DC-DC converters, battery charging infrastructure, uninterruptible power supply (UPS), and photovoltaic inverters.
In May 2019, Cree Inc. announced plans to invest US$ 1 Bn in the expansion of its existing capacity for silicon carbide production.
Each of these players has been profiled in the wide band gap semiconductors market report based on parameters such as company overview, financial overview, business strategies, product portfolio, business segments, and recent developments.
|
Attribute |
Detail |
|
Market Size Value in 2021 |
US$ 1.1 Bn |
|
Market Forecast Value in 2031 |
US$ 9.5 Bn |
|
Growth Rate (CAGR) |
24.6% |
|
Forecast Period |
2022–2031 |
|
Historical Data Available for |
2017–2020 |
|
Quantitative Units |
US$ Bn for Value |
|
Market Analysis |
It includes cross segment analysis at global as well as regional level. Furthermore, qualitative analysis includes drivers, restraints, opportunities, key trends, Porter’s Five Forces analysis, value chain analysis, and key trend analysis. |
|
Competition Landscape |
|
|
Format |
Electronic (PDF) + Excel |
|
Market Segmentation |
|
|
Regions Covered |
|
|
Countries Covered |
|
|
Companies Profiled |
|
|
Customization Scope |
Available upon request |
|
Pricing |
Available upon request |
Revenue of the global wide band gap semiconductors stood at US$ 1.1 Bn in 2021
The global wide band gap semiconductors market is expected to advance at a CAGR of 24.6% by 2031
The global wide band gap semiconductors market would reach US$ 9.5 Bn in 2031
The U.S. accounted for approximately 22.7% of the share in the global wide band gap semiconductors market in 2021
The silicon carbide (SiC) segment held 62.4% of the share of the global wide band gap semiconductors market
Increase in penetration of variable-frequency drives and potential use of WBG semiconductors in the renewable energy industry
Asia Pacific region is more lucrative in the global wide band gap semiconductors market
Avago Technologies (Braodcom), Cree Inc., Infineon Technologies AG, Navitas Semiconductor, Nexperia, On Semiconductor, Panasonic Corporation, ROHM Semiconductor, STMicroelectronics N.V., and Toshiba Electronic Devices & Storage Corporation
1. Preface
1.1. Market Introduction
1.2. Market and Segments Definition
1.3. Market Taxonomy
1.4. Research Methodology
1.5. Assumption and Acronyms
2. Executive Summary
2.1. Global Wide Band Gap Semiconductors Market Overview
2.2. Regional Outline
2.3. Industry Outline
2.4. Market Dynamics Snapshot
2.5. Competition Blueprint
3. Market Dynamics
3.1. Macro-economic Factors
3.2. Drivers
3.3. Restraints
3.4. Opportunities
3.5. Key Trends
3.6. Regulatory Scenario
4. Associated Industry and Key Indicator Assessment
4.1. Parent Industry Overview – Semiconductor Industry Overview
4.2. Supply Chain Analysis
4.3. Technology Roadmap Analysis
4.4. Industry SWOT Analysis
4.5. Porter Five Forces Analysis
4.6. Covid-19 Impact and Recovery Analysis
5. Wide Band Gap Semiconductors Market Analysis, by Material
5.1. Wide Band Gap Semiconductors Market Size (US$ Mn) Analysis & Forecast, by Material, 2017–2031
5.1.1. Silicon Carbide (SiC)
5.1.2. Gallium Nitride (GaN)
5.1.3. Diamond
5.1.4. Others (Zinc Oxide, GaAs, etc.)
5.2. Market Attractiveness Analysis, by Material
6. Wide Band Gap Semiconductors Market Analysis, by Application
6.1. Wide Band Gap Semiconductors Market Size (US$ Mn) Analysis & Forecast, by Application, 2017–2031
6.1.1. Hybrid/Electric Vehicles
6.1.2. PV Inverters
6.1.3. Railway Tractions
6.1.4. Wind Turbines
6.1.5. Power Supplies
6.1.6. Motor Drives
6.1.7. Servers
6.1.8. Others (Medical Imaging, Chargers and Adapters, etc.)
6.2. Market Attractiveness Analysis, by Application
7. Wide Band Gap Semiconductors Market Analysis, by End-use Industry
7.1. Wide Band Gap Semiconductors Market Size (US$ Mn) Analysis & Forecast, by End-use Industry, 2017–2031
7.1.1. Automotive & Transportation
7.1.2. Consumer Electronics
7.1.3. Aerospace & Defense
7.1.4. IT & Telecom
7.1.5. Energy & Utility
7.1.6. Others (Healthcare, Industrial, etc.)
7.2. Market Attractiveness Analysis, by End-use Industry
8. Wide Band Gap Semiconductors Market Analysis and Forecast, by Region
8.1. Wide Band Gap Semiconductors Market Size (US$ Mn) Analysis & Forecast, by Region, 2017–2031
8.1.1. North America
8.1.2. Europe
8.1.3. Asia Pacific
8.1.4. Middle East & Africa
8.1.5. South America
8.2. Market Attractiveness Analysis, by Region
9. North America Wide Band Gap Semiconductors Market Analysis and Forecast
9.1. Market Snapshot
9.2. Drivers and Restraints: Impact Analysis
9.3. Wide Band Gap Semiconductors Market Size (US$ Mn) Analysis & Forecast, by Material, 2017–2031
9.3.1. Silicon Carbide (SiC)
9.3.2. Gallium Nitride (GaN)
9.3.3. Diamond
9.3.4. Others (Zinc Oxide, GaAs, etc.)
9.4. Wide Band Gap Semiconductors Market Size (US$ Mn) Analysis & Forecast, by Application, 2017–2031
9.4.1. Hybrid/Electric Vehicles
9.4.2. PV Inverters
9.4.3. Railway Tractions
9.4.4. Wind Turbines
9.4.5. Power Supplies
9.4.6. Motor Drives
9.4.7. Servers
9.4.8. Others (Medical Imaging, Chargers and Adapters, etc.)
9.5. Wide Band Gap Semiconductors Market Size (US$ Mn) Analysis & Forecast, by End-use Industry, 2017–2031
9.5.1. Automotive & Transportation
9.5.2. Consumer Electronics
9.5.3. Aerospace & Defense
9.5.4. IT & Telecom
9.5.5. Energy & Utility
9.5.6. Others (Healthcare, Industrial, etc.)
9.6. Wide Band Gap Semiconductors Market Size (US$ Mn) Analysis & Forecast, by Country and Sub-region, 2017–2031
9.6.1. The U.S.
9.6.2. Canada
9.6.3. Rest of North America
9.7. Market Attractiveness Analysis
9.7.1. By Material
9.7.2. By Application
9.7.3. By End-use Industry
9.7.4. By Country/Sub-region
10. Europe Wide Band Gap Semiconductors Market Analysis and Forecast
10.1. Market Snapshot
10.2. Drivers and Restraints: Impact Analysis
10.3. Wide Band Gap Semiconductors Market Size (US$ Mn) Analysis & Forecast, by Material, 2017–2031
10.3.1. Silicon Carbide (SiC)
10.3.2. Gallium Nitride (GaN)
10.3.3. Diamond
10.3.4. Others (Zinc Oxide, GaAs, etc.)
10.4. Wide Band Gap Semiconductors Market Size (US$ Mn) Analysis & Forecast, by Application, 2017–2031
10.4.1. Hybrid/Electric Vehicles
10.4.2. PV Inverters
10.4.3. Railway Tractions
10.4.4. Wind Turbines
10.4.5. Power Supplies
10.4.6. Motor Drives
10.4.7. Servers
10.4.8. Others (Medical Imaging, Chargers and Adapters, etc.)
10.5. Wide Band Gap Semiconductors Market Size (US$ Mn) Analysis & Forecast, by End-use Industry, 2017–2031
10.5.1. Automotive & Transportation
10.5.2. Consumer Electronics
10.5.3. Aerospace & Defense
10.5.4. IT & Telecom
10.5.5. Energy & Utility
10.5.6. Others (Healthcare, Industrial, etc.)
10.6. Wide Band Gap Semiconductors Market Size (US$ Mn) Analysis & Forecast, by Country and Sub-region, 2017–2031
10.6.1. The U.K.
10.6.2. Germany
10.6.3. France
10.6.4. Rest of Europe
10.7. Market Attractiveness Analysis
10.7.1. By Material
10.7.2. By Application
10.7.3. By End-use Industry
10.7.4. By Country/Sub-region
11. Asia Pacific Wide Band Gap Semiconductors Market Analysis and Forecast
11.1. Market Snapshot
11.2. Drivers and Restraints: Impact Analysis
11.3. Wide Band Gap Semiconductors Market Size (US$ Mn) Analysis & Forecast, by Material, 2017–2031
11.3.1. Silicon Carbide (SiC)
11.3.2. Gallium Nitride (GaN)
11.3.3. Diamond
11.3.4. Others (Zinc Oxide, GaAs, etc.)
11.4. Wide Band Gap Semiconductors Market Size (US$ Mn) Analysis & Forecast, by Application, 2017–2031
11.4.1. Hybrid/Electric Vehicles
11.4.2. PV Inverters
11.4.3. Railway Tractions
11.4.4. Wind Turbines
11.4.5. Power Supplies
11.4.6. Motor Drives
11.4.7. Servers
11.4.8. Others (Medical Imaging, Chargers and Adapters, etc.)
11.5. Wide Band Gap Semiconductors Market Size (US$ Mn) Analysis & Forecast, by End-use Industry, 2017–2031
11.5.1. Automotive & Transportation
11.5.2. Consumer Electronics
11.5.3. Aerospace & Defense
11.5.4. IT & Telecom
11.5.5. Energy & Utility
11.5.6. Others (Healthcare, Industrial, etc.)
11.6. Wide Band Gap Semiconductors Market Size (US$ Mn) Analysis & Forecast, by Country and Sub-region, 2017–2031
11.6.1. China
11.6.2. Japan
11.6.3. India
11.6.4. South Korea
11.6.5. ASEAN
11.6.6. Rest of Asia Pacific
11.7. Market Attractiveness Analysis
11.7.1. By Material
11.7.2. By Application
11.7.3. By End-use Industry
11.7.4. By Country/Sub-region
12. Middle East and Africa Wide Band Gap Semiconductors Market Analysis and Forecast
12.1. Market Snapshot
12.2. Drivers and Restraints: Impact Analysis
12.3. Wide Band Gap Semiconductors Market Size (US$ Mn) Analysis & Forecast, by Material, 2017–2031
12.3.1. Silicon Carbide (SiC)
12.3.2. Gallium Nitride (GaN)
12.3.3. Diamond
12.3.4. Others (Zinc Oxide, GaAs, etc.)
12.4. Wide Band Gap Semiconductors Market Size (US$ Mn) Analysis & Forecast, by Application, 2017–2031
12.4.1. Hybrid/Electric Vehicles
12.4.2. PV Inverters
12.4.3. Railway Tractions
12.4.4. Wind Turbines
12.4.5. Power Supplies
12.4.6. Motor Drives
12.4.7. Servers
12.4.8. Others (Medical Imaging, Chargers and Adapters, etc.)
12.5. Wide Band Gap Semiconductors Market Size (US$ Mn) Analysis & Forecast, by End-use Industry, 2017–2031
12.5.1. Automotive & Transportation
12.5.2. Consumer Electronics
12.5.3. Aerospace & Defense
12.5.4. IT & Telecom
12.5.5. Energy & Utility
12.5.6. Others (Healthcare, Industrial, etc.)
12.6. Wide Band Gap Semiconductors Market Size (US$ Mn) Analysis & Forecast, by Country and Sub-region, 2017–2031
12.6.1. GCC
12.6.2. South Africa
12.6.3. Rest of Middle East and Africa
12.7. Market Attractiveness Analysis
12.7.1. By Material
12.7.2. By Application
12.7.3. By End-use Industry
12.7.4. By Country/Sub-region
13. South America Wide Band Gap Semiconductors Market Analysis and Forecast
13.1. Market Snapshot
13.2. Drivers and Restraints: Impact Analysis
13.3. Wide Band Gap Semiconductors Market Size (US$ Mn) Analysis & Forecast, by Material, 2017–2031
13.3.1. Silicon Carbide (SiC)
13.3.2. Gallium Nitride (GaN)
13.3.3. Diamond
13.3.4. Others (Zinc Oxide, GaAs, etc.)
13.4. Wide Band Gap Semiconductors Market Size (US$ Mn) Analysis & Forecast, by Application, 2017–2031
13.4.1. Hybrid/Electric Vehicles
13.4.2. PV Inverters
13.4.3. Railway Tractions
13.4.4. Wind Turbines
13.4.5. Power Supplies
13.4.6. Motor Drives
13.4.7. Servers
13.4.8. Others (Medical Imaging, Chargers and Adapters, etc.)
13.5. Wide Band Gap Semiconductors Market Size (US$ Mn) Analysis & Forecast, by End-use Industry, 2017–2031
13.5.1. Automotive & Transportation
13.5.2. Consumer Electronics
13.5.3. Aerospace & Defense
13.5.4. IT & Telecom
13.5.5. Energy & Utility
13.5.6. Others (Healthcare, Industrial, etc.)
13.6. Wide Band Gap Semiconductors Market Size (US$ Mn) Analysis & Forecast, by Country and Sub-region, 2017–2031
13.6.1. Brazil
13.6.2. Rest of South America
13.7. Market Attractiveness Analysis
13.7.1. By Material
13.7.2. By Application
13.7.3. By End-use Industry
13.7.4. By Country/Sub-region
14. Competition Assessment
14.1. Global Wide Band Gap Semiconductors Market Competition Matrix - a Dashboard View
14.1.1. Global Wide Band Gap Semiconductors Market Company Share Analysis, by Value (2021)
14.1.2. Technological Differentiator
15. Company Profiles (Global Manufacturers/Suppliers)
15.1. Avago Technologies (Braodcom)
15.1.1. Overview
15.1.2. Product Portfolio
15.1.3. Sales Footprint
15.1.4. Key Subsidiaries or Distributors
15.1.5. Strategy and Recent Developments
15.1.6. Key Financials
15.2. Cree Inc.
15.2.1. Overview
15.2.2. Product Portfolio
15.2.3. Sales Footprint
15.2.4. Key Subsidiaries or Distributors
15.2.5. Strategy and Recent Developments
15.2.6. Key Financials
15.3. Infineon Technologies AG
15.3.1. Overview
15.3.2. Product Portfolio
15.3.3. Sales Footprint
15.3.4. Key Subsidiaries or Distributors
15.3.5. Strategy and Recent Developments
15.3.6. Key Financials
15.4. Navitas Semiconductor
15.4.1. Overview
15.4.2. Product Portfolio
15.4.3. Sales Footprint
15.4.4. Key Subsidiaries or Distributors
15.4.5. Strategy and Recent Developments
15.4.6. Key Financials
15.5. Nexperia
15.5.1. Overview
15.5.2. Product Portfolio
15.5.3. Sales Footprint
15.5.4. Key Subsidiaries or Distributors
15.5.5. Strategy and Recent Developments
15.5.6. Key Financials
15.6. On semiconductor
15.6.1. Overview
15.6.2. Product Portfolio
15.6.3. Sales Footprint
15.6.4. Key Subsidiaries or Distributors
15.6.5. Strategy and Recent Developments
15.6.6. Key Financials
15.7. Panasonic Corporation
15.7.1. Overview
15.7.2. Product Portfolio
15.7.3. Sales Footprint
15.7.4. Key Subsidiaries or Distributors
15.7.5. Strategy and Recent Developments
15.7.6. Key Financials
15.8. ROHM Semiconductor
15.8.1. Overview
15.8.2. Product Portfolio
15.8.3. Sales Footprint
15.8.4. Key Subsidiaries or Distributors
15.8.5. Strategy and Recent Developments
15.8.6. Key Financials
15.9. STMicroelectronics N.V.
15.9.1. Overview
15.9.2. Product Portfolio
15.9.3. Sales Footprint
15.9.4. Key Subsidiaries or Distributors
15.9.5. Strategy and Recent Developments
15.9.6. Key Financials
15.10. Toshiba Electronic Devices & Storage Corporation
15.10.1. Overview
15.10.2. Product Portfolio
15.10.3. Sales Footprint
15.10.4. Key Subsidiaries or Distributors
15.10.5. Strategy and Recent Developments
15.10.6. Key Financials
16. Recommendation
16.1. Opportunity Assessment
16.1.1. By Material
16.1.2. By Application
16.1.3. By End-use Industry
16.1.4. By Region
List of Tables
Table 01: Global Wide Band Gap Semiconductors Market Value (US$ Mn) Forecast, by Material 2017-2031
Table 02: Global Wide Band Gap Semiconductors Market Value (US$ Mn) Forecast, by Application 2017-2031
Table 03: Global Wide Band Gap Semiconductors Market Value (US$ Mn) Forecast, by End-use Industry, 2017-2031
Table 04: Wide Band Gap Semiconductors Market Value (US$ Mn) Forecast, by Region, 2017-2031
Table 05: North America Wide Band Gap Semiconductors Market Value (US$ Mn) Forecast, by Material, 2017-2031
Table 06: North America Wide Band Gap Semiconductors Market Value (US$ Mn) Forecast, by Application, 2017-2031
Table 07: North America Wide Band Gap Semiconductors Market Value (US$ Mn) Forecast, by End-use Industry, 2017-2031
Table 08: North America Wide Band Gap Semiconductors Market Value (US$ Mn) Forecast, by Country, 2017-2031
Table 09: Europe Wide Band Gap Semiconductors Market Value (US$ Mn) Forecast, by Material, 2017-2031
Table 10: Europe Wide Band Gap Semiconductors Market Value (US$ Mn) Forecast, by Application, 2017-2031
Table 11: Europe Wide Band Gap Semiconductors Market Value (US$ Mn) Forecast, by End-use Industry, 2017-2031
Table 12: Europe Wide Band Gap Semiconductors Market Value (US$ Mn) Forecast, by Country/Sub-region, 2017-2031
Table 13: Asia Pacific GaN Wide Band Gap Semiconductors Market Value (US$ Mn) Forecast, by Material, 2017-2031
Table 14: Asia Pacific Wide Band Gap Semiconductors Market Value (US$ Mn) Forecast, by Application, 2017-2031
Table 15: Asia Pacific Wide Band Gap Semiconductors Market Value (US$ Mn) Forecast, by End-use Industry, 2017-2031
Table 16: Asia Pacific Wide Band Gap Semiconductors Market Value (US$ Mn) Forecast, by Country/Sub-region, 2017-2031
Table 17: Middle East and Africa Wide Band Gap Semiconductors Market Value (US$ Mn) Forecast, by Material, 2017-2031
Table 18: Middle East and Africa Wide Band Gap Semiconductors Market Value (US$ Mn) Forecast, by Application, 2017-2031
Table 19: Middle East and Africa Wide Band Gap Semiconductors Market Value (US$ Mn) Forecast, by End-use Industry 2017-2031
Table 20: Middle East and Africa Wide Band Gap Semiconductors Market Value (US$ Mn) Forecast, by Country/Sub-region, 2017-2031
Table 21: South America Wide Band Gap Semiconductors Market Value (US$ Mn) Forecast, by Material, 2017-2031
Table 22: South America Wide Band Gap Semiconductors Market Value (US$ Mn) Forecast, by Application, 2017-2031
Table 23: South America Wide Band Gap Semiconductors Market Value (US$ Mn) Forecast, by End-use Industry,2017-2031
Table 24: South America Wide Band Gap Semiconductors Market Value (US$ Mn) Forecast, by Country/Sub-region, 2017-2031
List of Figures
Figure 01: Global Wide Band Gap Semiconductors Market, Value (US$ Mn), 2017-2031
Figure 02: Global Wide Band Gap Semiconductors Market, Y-O-Y, 2017-2031
Figure 03: Global Wide Band Gap Semiconductors Market, Year-on-Year Growth, Global Overview, 2022-2031
Figure 04: Global Wide Band Gap Semiconductors Market, Year-on-Year Growth, by Material, 2022-2031
Figure 05: Global Wide Band Gap Semiconductors Market Projections by Material, Value (US$ Mn), 2017-2031
Figure 06: Global Wide Band Gap Semiconductors Market Share Analysis, by Material, 2021 and 2031
Figure 07: Global Wide Band Gap Semiconductors Market, Incremental Opportunity, by Material, Value (US$ Mn), 2022-2031
Figure 08: Global Wide Band Gap Semiconductors Market, Year-on-Year Growth, by Application, 2022-2031
Figure 09: Global Wide Band Gap Semiconductors Market Projections by Application, Value (US$ Mn), 2017-2031
Figure 10: Global Wide Band Gap Semiconductors Market Share Analysis, by Application, 2021 and 2031
Figure 11: Global Wide Band Gap Semiconductors Market, Incremental Opportunity, by Application (US$ Mn), 2022-2031
Figure 12: Global Wide Band Gap Semiconductors Market, Year-on-Year Growth, by End-use Industry, 2017-2031
Figure 13: Global Wide Band Gap Semiconductors Market Projections by End-use Industry, Value (US$ Mn), 2017-2031
Figure 14: Global Wide Band Gap Semiconductors Market Share Analysis, by End-use Industry, 2021 and 2031
Figure 15: Global Wide Band Gap Semiconductors Market, Incremental Opportunity, by End-use Industry, Value (US$ Mn), 2022-2031
Figure 16: Global Wide Band Gap Semiconductors Market, Year-on-Year Growth, by Region, 2022-2031
Figure 17: Global Wide Band Gap Semiconductors Market Projections by Region, Value (US$ Mn), 2017-2031
Figure 18: Global Wide Band Gap Semiconductors Market Share Analysis, by Region, 2021 and 2031
Figure 19: Global Wide Band Gap Semiconductors Market, Incremental Opportunity, by Region, Value (US$ Mn), 2022-2031
Figure 20: North America Wide Band Gap Semiconductors Market, Year-on-Year Growth
Figure 21: North America Wide Band Gap Semiconductors Market Projections by Material, Value (US$ Mn), 2017-2031
Figure 22: North America Wide Band Gap Semiconductors Market Share Analysis, by Material, 2021 and 2031
Figure 23: North America Wide Band Gap Semiconductors Market, Incremental Opportunity, by Material, Value (US$ Mn), 2022-2031
Figure 24: North America Wide Band Gap Semiconductors Market Projections by Application, Value (US$ Mn), 2017-2031
Figure 25: North America Wide Band Gap Semiconductors Market Share Analysis, by Application, 2021 and 2031
Figure 26: North America Wide Band Gap Semiconductors Market, Incremental Opportunity, by Application(US$ Mn), 2022-2031
Figure 27: North America Wide Band Gap Semiconductors Market Projections by End-use Industry, Value (US$ Mn), 2017-2031
Figure 28: North America Wide Band Gap Semiconductors Market Share Analysis, by End-use Industry, 2021 and 2031
Figure 29: North America Wide Band Gap Semiconductors Market, Incremental Opportunity, by End-use Industry, Value (US$ Mn), 2022-2031
Figure 30: North America Wide Band Gap Semiconductors Market Projections by Country, Value (US$ Mn), 2017-2031
Figure 31: North America Wide Band Gap Semiconductors Market Share Analysis, by Country, 2021 and 2031
Figure 32: North America Wide Band Gap Semiconductors Market, Incremental Opportunity, by Country, Value (US$ Mn), 2022-2031
Figure 33: Europe Wide Band Gap Semiconductors Market, Year-on-Year Growth, 2022-2031
Figure 34: Europe Wide Band Gap Semiconductors Market Projections by Material, Value (US$ Mn), 2017-2031
Figure 35: Europe Wide Band Gap Semiconductors Market Share Analysis, by Material, 2021 and 2031
Figure 36: Europe Wide Band Gap Semiconductors Market, Incremental Opportunity, by Material, Value (US$ Mn), 2022-2031
Figure 37: Europe Wide Band Gap Semiconductors Market Projections by Application, Value (US$ Mn), 2017-2031
Figure 38: Europe Wide Band Gap Semiconductors Market Share Analysis, by Application, 2021 and 2031
Figure 39: Europe Wide Band Gap Semiconductors Market, Incremental Opportunity, by Application(US$ Mn), 2022-2031
Figure 40: Europe Wide Band Gap Semiconductors Market Projections by End-use Industry, Value (US$ Mn), 2017-2031
Figure 41: Europe Wide Band Gap Semiconductors Market Share Analysis, by End-use Industry, 2021 and 2031
Figure 42: Europe Wide Band Gap Semiconductors Market, Incremental Opportunity, by End-use Industry, Value (US$ Mn), 2022-2031
Figure 43: Europe Wide Band Gap Semiconductors Market Projections by Country/Sub-region, Value (US$ Mn), 2017-2031
Figure 44: Europe Wide Band Gap Semiconductors Market Share Analysis, by Country/Sub-region, 2021 and 2031
Figure 45: Europe Wide Band Gap Semiconductors Market, Incremental Opportunity, by Country/Sub-region, Value (US$ Mn), 2022-2031
Figure 46: Asia Pacific Wide Band Gap Semiconductors Market, Year-on-Year Growth, 2022-2031
Figure 47: Asia Pacific Wide Band Gap Semiconductors Market Projections by Material, Value (US$ Mn), 2017-2031
Figure 48: Asia Pacific Wide Band Gap Semiconductors Market Share Analysis, by Material, 2021 and 2031
Figure 49: Asia Pacific Wide Band Gap Semiconductors Market, Incremental Opportunity, by Material, Value (US$ Mn), 2022-2031
Figure 50: Asia Pacific Wide Band Gap Semiconductors Market Projections by Application, Value (US$ Mn), 2017-2031
Figure 51: Asia Pacific Wide Band Gap Semiconductors Market Share Analysis, by Application, 2021 and 2031
Figure 52: Asia Pacific Wide Band Gap Semiconductors Market, Incremental Opportunity, by Application(US$ Mn), 2022-2031
Figure 53: Asia Pacific Wide Band Gap Semiconductors Market Projections by End-use industry, Value (US$ Mn), 2017-2031
Figure 54: Asia Pacific Wide Band Gap Semiconductors Market Share Analysis, by End-use Industry, 2021 and 2031
Figure 55: Asia Pacific Wide Band Gap Semiconductors Market, Incremental Opportunity, by End-use Industry, Value (US$ Mn), 2022-2031
Figure 56: Asia Pacific Wide Band Gap Semiconductors Market Projections by Country/Sub-region, Value (US$ Mn), 2017-2031
Figure 57: Asia Pacific Wide Band Gap Semiconductors Market Share Analysis, by Country/Sub-region, 2021 and 2031
Figure 58: Asia Pacific Wide Band Gap Semiconductors Market, Incremental Opportunity, by Country/Sub-region, Value (US$ Mn), 2022-2031
Figure 59: Global Wide Band Gap Semiconductors Market, Year-on-Year Growth, by Middle East and Africa 2022-2031
Figure 60: Middle East and Africa Wide Band Gap Semiconductors Market Projections by Material, Value (US$ Mn), 2017-2031
Figure 61: Middle East and Africa Wide Band Gap Semiconductors Market Share Analysis, by Material, 2021 and 2031
Figure 62: Middle East and Africa Wide Band Gap Semiconductors Market, Incremental Opportunity, by Material, Value (US$ Mn), 2022-2031
Figure 63: Middle East and Africa Wide Band Gap Semiconductors Market Projections by Application, Value (US$ Mn), 2017-2031
Figure 64: Middle East and Africa Wide Band Gap Semiconductors Market Share Analysis, by Application, 2021 and 2031
Figure 65: Middle East and Africa Wide Band Gap Semiconductors Market, Incremental Opportunity, by Application(US$ Mn), 2022-2031
Figure 66: Middle East and Africa Wide Band Gap Semiconductors Market Projections by End-use Industry, Value (US$ Mn), 2017-2031
Figure 67: Middle East and Africa Wide Band Gap Semiconductors Market Share Analysis, by End-use Industry, 2021 and 2031
Figure 68: Middle East and Africa Wide Band Gap Semiconductors Market, Incremental Opportunity, by End-use Industry, Value (US$ Mn), 2022-2031
Figure 69: Middle East and Africa Wide Band Gap Semiconductors Market Projections by Country/Sub-region, Value (US$ Mn), 2017-2031
Figure 70: Middle East and Africa Wide Band Gap Semiconductors Market Share Analysis, by Country/Sub-region, 2021 and 2031
Figure 71: Middle East and Africa Wide Band Gap Semiconductors Market, Incremental Opportunity, by Country/Sub-region, Value (US$ Mn), 2022-2031
Figure 72: Global Wide Band Gap Semiconductors Market, Year-on-Year Growth, by South America, 2022-2031
Figure 73: South America Wide Band Gap Semiconductors Market Projections by Material, Value (US$ Mn), 2017-2031
Figure 74: South America Wide Band Gap Semiconductors Market Share Analysis, by Material, 2020 and 2031
Figure 75: South America Wide Band Gap Semiconductors Market, Incremental Opportunity, by Material, Value (US$ Mn), 2022-2031
Figure 76: South America Wide Band Gap Semiconductors Market Projections by Application, Value (US$ Mn), 2017-2031
Figure 77: South America Wide Band Gap Semiconductors Market Share Analysis, by Application, 2021 and 2031
Figure 78: South America Wide Band Gap Semiconductors Market, Incremental Opportunity, by Application(US$ Mn), 2022-2031
Figure 79: South America Wide Band Gap Semiconductors Market Projections by End-use Industry, Value (US$ Mn), 2017-2031
Figure 80: South America Wide Band Gap Semiconductors Market Share Analysis, by End-use Industry, 2020 and 2031
Figure 81: South America Wide Band Gap Semiconductors Market, Incremental Opportunity, by End-use Industry, Value (US$ Mn), 2022-2031
Figure 82: South America Wide Band Gap Semiconductors Market Projections by Country/Sub-region, Value (US$ Mn), 2017-2031
Figure 83: South America Wide Band Gap Semiconductors Market Share Analysis, by Country/Sub-region, 2021 and 2031
Figure 84: South America Wide Band Gap Semiconductors Market, Incremental Opportunity, by Country/Sub-region, Value (US$ Mn), 2022-2031
Copyright © Transparency Market Research, Inc. All Rights reserved
Trust Online

Wide Band Gap Semiconductors Market