
Reports
Reports
Analysts’ Viewpoint on Market Scenario
The global GaN semiconductor devices market is expected to grow at a rapid pace during the forecast period owing to an increase in demand for high-performing semiconductors in power circuits, communication devices, etc.
Companies are focusing on various industries, such as IT & telecommunication; consumer electronics; automotive & transportation; and aerospace & defense, to keep their business growing post the peak of the COVID-19 pandemic.
Furthermore, rise in applications of GaN devices in electric vehicles, electronic devices, solar PV, motor grid, and smart grid operations is projected to fuel the market during the forecast period.
Major players, in collaboration with local industry players, have placed equal focus on all elements, opening up new investment opportunities for stakeholders in the semiconductor market. GaN manufacturers are focusing on the emerging trends of the GaN semiconductor devices market to gain revenue benefits.
Gallium nitride (GaN) is a mechanically stable, very hard, wide bandgap semiconductor. Power devices based on GaN outperform silicon-based devices in terms of breakdown strength, switching speed, thermal conductivity, and on-resistance.
GaN is used to build semiconductor power devices as well as RF components. GaN has proved to be an effective replacement technology for silicon semiconductors in power conversion, RF, and analog applications.
GaN technology is expected to gain popularity in the next few years, owing to the rise in demand for higher power, higher performance semiconductors in power circuits, RF designs, LEDs, etc.
Rise in usage of GaN power semiconductor devices in smartphones, laptops, and monitors to control battery's charging and discharging currents is likely to augment the global market in the next few years.
Rapidly rising gallium nitride uses in consumer electronics is projected to drive the consumer electronics market in the next few years. Gallium nitride companies are increasingly focusing on improving GaN technology to cater to the rise in demand for GaN devices in power electronics.
GaN semiconductor devices used in power supplies support multiple voltages so that they can be connected to smartphones, laptops, etc. GaN HEMTs are effective in meeting these requirements because they are high-voltage devices that are capable of MHz switching while remaining efficient.
Use of high-voltage DC power supplies in large-scale data centers is increasing, because it improves power distribution efficiency by reducing the number of AC/ DC conversions. Additionally, rise in demand for high-power applications in the industrial and telecommunications sectors is projected to drive the demand for GaN semiconductor devices in the near future.
Furthermore, surface-emitting organic EL lighting, which is popular for interior lighting, necessitates a thin power supply. Consequently, Gallium nitride devices are expected to be useful in recognizing an ultra-thin power supply.
Gallium nitride power devices are used in diverse applications for power supply and conversion. For Instance, Infineon's GaN technology solutions provide benchmark efficiency and maximize power density for the development of telecommunication infrastructure. Furthermore, using Infineon's GaN transistors for efficient power conversion reduces operating costs by reducing the gallium nitride power supply footprint while providing the highest solution robustness.
Rapid development of 5G communication in the last few years is boosting the hardware requirements for 5G base stations. 5G communication, which aims to further enhance the transmission speed of signals, is developed to increase the transmitting power to improve the signal-to-noise ratio for transmitting more accurate signals.
Gallium nitride devices are used to make high-power radio frequency devices in 5G base stations as well as power electronic devices in circuits, as these are wide bandgap semiconductors with large forbidden bandwidth, high electron saturated drift velocity, low dielectric constant, and excellent electrical conductivity.
According to the Global System for Mobile Communications Association (GSMA), presently, China has the most 5G base stations and connections in the world. China had 480 million 5G connections by the end of 2021, and it was expected to grow to 650 million in just one year, accounting for more than 60% of global 5G mobile connections. Therefore, the 5G technology market is expected to advance at a rapid pace during the forecast period. However, high cost of raw materials is one of the factors hampering the global GaN semiconductor devices market during the forecast period.
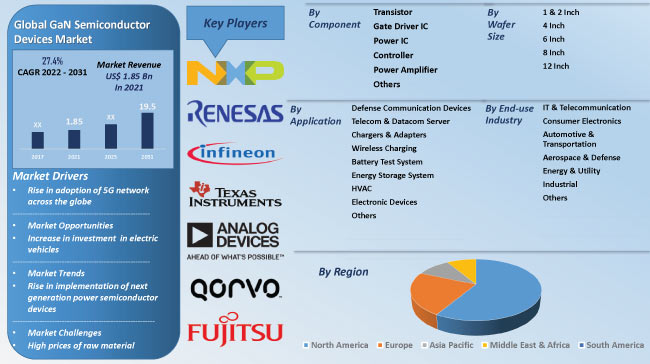
In terms of component, the global GaN semiconductor devices industry has been segregated into transistor, gate driver IC, power IC, controller, power amplifier, and others. The transistor segment held 32% share of the global GAN semiconductor devices market in 2021.
It is projected to dominate the global market during the forecast period. GaN transistors offer numerous benefits over traditional technologies such as Sic and Si. Transistors are used in diverse digital electronics applications such as radar, air traffic control, space exploration, and telecommunications due to their properties such as higher power density, higher breakdown voltage, higher thermal conductivity, and reduced power requirements.
Moreover, GaN transistors meet critical RF requirements such as high gain, low power consumption, high throughput, and extremely fast switching speeds. Gallium Nitride is a binary III/V direct bandgap semiconductor that is well-suited for high-power, high-temperature transistors.
Gallium nitride is also employed in power semiconductor devices, radio frequency components, lasers, and photonics. Some of the major players provide GaN transistor in the market and contribute to the market growth.
Texas Instruments Incorporated develops a range of gallium nitride (GaN) FETs (field effect transistors) with integrated gate drivers and GaN power devices that provide the most efficient GaN solution with longer reliability and cost savings.
These devices can be used in diverse applications, ranging from telecommunications, servers, motor drives and laptop adapters to on-board chargers for electric vehicles.
In terms of wafer size, the global GaN semiconductor devices market has been classified into 1 & 2 Inch, 4 Inch, 6 Inch, 8 Inch, and 12 Inch. The 4 inch segment held major share of the global market in 2021, and it is expected to maintain its leading position in the market during the forecast period.
The 4 inch wafer is commonly used in communication and power supply devices. Furthermore, the demand for 4 inch wafers is increasing in the power electronics sector because they have higher mechanical strength than 1 and 2 inch wafers.
However, in recent decades, the semiconductor industry has shifted to 12 inch (300 mm) wafers for high-power and high radio frequency applications. For instance, Xiamen Powerway Advanced Material Co., Ltd., has developed N type, p type, and semi-insulating gallium nitride substrate and template or GaN epi wafer for HEMT with low macro defect density and dislocation density for LED, LD, or other applications. GaN wafers offered by the company include freestanding GaN substrate, GaN template on sapphire/sic/silicon, GaN based led epitaxial wafer, and GaN HEMT epitaxial wafer.
Asia Pacific is expected to hold major share of the global GaN semiconductor devices market during the forecast period. Lucrative presence of key players along with the easy availability of raw materials is projected to drive the market in Asia Pacific.
Furthermore, increase in adoption of 5G network in Asia Pacific is also anticipated to contribute to the market growth during the forecast period. Rise in adoption of advanced technology in the telecom and automotive sector is driving the market in North America. Moreover, demand for GaN semiconductor devices is rising in Middle East & Africa.
The global GaN semiconductor devices market is consolidated, with the presence of a small number of large-scale vendors controlling majority of the share. Several firms are investing significantly in comprehensive research and development activities and new product development.
Expansion of product portfolios and mergers and acquisitions are major strategies adopted by key players. Analog Devices, Inc., CGD Cambridge GaN Devices, Efficient Power Conversion Corporation, Fujitsu, Infineon Technologies AG, Navitas Semiconductor, NXP Semiconductors, Qorvo, Inc., Renesas Electronics Corporation, Texas Instruments Incorporated, and Transphorm, Inc. are the prominent entities operating in this market.
Each of these players has been profiled in the GaN semiconductor devices market report based on parameters such as company overview, financial overview, business strategies, product portfolio, business segments, and recent developments.
|
Attribute |
Detail |
|
Market Size Value in 2021 |
US$ 1.85 Bn |
|
Market Forecast Value in 2031 |
US$ 19.5 Bn |
|
Growth Rate (CAGR) |
27.4% |
|
Forecast Period |
2022–2031 |
|
Historical Data Available for |
2017–2020 |
|
Quantitative Units |
US$ Bn for Value and Million Units for Volume |
|
Market Analysis |
It includes cross segment analysis at global as well as regional level. Furthermore, qualitative analysis includes drivers, restraints, opportunities, key trends, Porter’s Five Forces analysis, value chain analysis, and key trend analysis. |
|
Competition Landscape |
|
|
Format |
Electronic (PDF) + Excel |
|
Market Segmentation |
|
|
Regions Covered |
|
|
Countries Covered |
|
|
Companies Profiled |
|
|
Customization Scope |
Available upon request |
|
Pricing |
Available upon request |
The global market was valued at US$ 1.85 Bn in 2021
The market is expected to advance at a CAGR of 27.4% by 2031
The global GaN semiconductor devices industry is expected to reach US$ 19.5 Bn in 2031
CGD Cambridge GaN Devices, Efficient Power Conversion Corporation, Fujitsu, Infineon Technologies AG, Navitas Semiconductor, NXP Semiconductors, Qorvo, Inc., Renesas Electronics Corporation, Texas Instruments Incorporated, and Transphorm, Inc.
The US held approximately 26% share of the global GaN semiconductor devices market in 2021
Based on component, the transistor segment held approximately 32% share of the global market in 2021
Increase in demand for GaN semiconductor devices in power supplies and rise in adoption of 5G network across the globe
Asia Pacific is more lucrative region of the market
1. Preface
1.1. Market Introduction
1.2. Market and Segments Definition
1.3. Market Taxonomy
1.4. Research Methodology
1.5. Assumption and Acronyms
2. Executive Summary
2.1. Global GaN Semiconductor Devices Market Overview
2.2. Regional Outline
2.3. Industry Outline
2.4. Market Dynamics Snapshot
2.5. Competition Blueprint
3. Market Dynamics
3.1. Macro-economic Factors
3.2. Drivers
3.3. Restraints
3.4. Opportunities
3.5. Key Trends
3.6. Regulatory Scenario
4. Associated Industry and Key Indicator Assessment
4.1. Parent Industry Overview – Global Power Semiconductor Industry Overview
4.2. Supply Chain Analysis
4.3. Pricing Trend Analysis
4.4. Technology Roadmap Analysis
4.5. Industry SWOT Analysis
4.6. Porter Five Forces Analysis
4.7. Covid-19 Impact and Recovery Analysis
5. GaN Semiconductor Devices Market Analysis, by Component
5.1. GaN Semiconductor Devices Market Size (US$ Mn) and Volume (Million Units) Analysis & Forecast, by Component, 2017–2031
5.1.1. Transistor
5.1.2. Gate Driver IC
5.1.3. Power IC
5.1.4. Controller
5.1.5. Power Amplifier
5.1.6. Others
5.2. Market Attractiveness Analysis, by Component
6. GaN Semiconductor Devices Market Analysis, by Wafer Size
6.1. GaN Semiconductor Devices Market Size (US$ Mn) Analysis & Forecast, by Wafer Size, 2017–2031
6.1.1. 1 & 2 Inch
6.1.2. 4 Inch
6.1.3. 6 Inch
6.1.4. 8 Inch
6.1.5. 12 Inch
6.2. Market Attractiveness Analysis, by Wafer Size
7. GaN Semiconductor Devices Market Analysis, by Application
7.1. GaN Semiconductor Devices Market Size (US$ Mn) Analysis & Forecast, by Application, 2017–2031
7.1.1. Defense Communication Devices
7.1.2. Telecom & Datacom Server
7.1.3. Chargers & Adapters
7.1.4. Wireless Charging
7.1.5. Battery Test System
7.1.6. Energy Storage System
7.1.7. HVAC
7.1.8. Electronic Devices
7.1.8.1. Smartphones
7.1.8.2. Laptops & Notebooks
7.1.8.3. Others
7.1.9. Others
7.2. Market Attractiveness Analysis, by Application
8. GaN Semiconductor Devices Market Analysis, by End-use Industry
8.1. GaN Semiconductor Devices Market Size (US$ Mn) Analysis & Forecast, by End-use Industry, 2017–2031
8.1.1. IT & Telecommunication
8.1.2. Consumer Electronics
8.1.3. Automotive & Transportation
8.1.4. Aerospace & Defense
8.1.5. Energy & Utility
8.1.6. Industrial
8.1.7. Others
8.2. Market Attractiveness Analysis, by End-use Industry
9. GaN Semiconductor Devices Market Analysis and Forecast, by Region
9.1. GaN Semiconductor Devices Market Size (US$ Mn) and Volume (Million Units) Analysis & Forecast, by Region, 2017–2031
9.1.1. North America
9.1.2. Europe
9.1.3. Asia Pacific
9.1.4. Middle East & Africa
9.1.5. South America
9.2. Market Attractiveness Analysis, by Region
10. North America GaN Semiconductor Devices Market Analysis and Forecast
10.1. Market Snapshot
10.2. Drivers and Restraints: Impact Analysis
10.3. GaN Semiconductor Devices Market Size (US$ Mn) and Volume (Million Units) Analysis & Forecast, by Component, 2017–2031
10.3.1. Transistor
10.3.2. Gate Driver IC
10.3.3. Power IC
10.3.4. Controller
10.3.5. Power Amplifier
10.3.6. Others
10.4. GaN Semiconductor Devices Market Size (US$ Mn) Analysis & Forecast, by Wafer Size, 2017–2031
10.4.1. 1 & 2 Inch
10.4.2. 4 Inch
10.4.3. 6 Inch
10.4.4. 8 Inch
10.4.5. 12 Inch
10.5. GaN Semiconductor Devices Market Size (US$ Mn) Analysis & Forecast, by Application, 2017–2031
10.5.1. Defense Communication Devices
10.5.2. Telecom & Datacom Server
10.5.3. Chargers & Adapters
10.5.4. Wireless Charging
10.5.5. Battery Test System
10.5.6. Energy Storage System
10.5.7. HVAC
10.5.8. Electronic Devices
10.5.8.1. Smartphones
10.5.8.2. Laptops & Notebooks
10.5.8.3. Others
10.5.9. Others
10.6. GaN Semiconductor Devices Market Size (US$ Mn) Analysis & Forecast, by End-use Industry, 2017–2031
10.6.1. IT & Telecommunication
10.6.2. Consumer Electronics
10.6.3. Automotive & Transportation
10.6.4. Aerospace & Defense
10.6.5. Energy & Utility
10.6.6. Industrial
10.6.7. Others
10.7. GaN Semiconductor Devices Market Size (US$ Mn) and Volume (Million Units) Analysis & Forecast, by Country & Sub-region, 2017–2031
10.7.1. U.S.
10.7.2. Canada
10.7.3. Rest of North America
10.8. Market Attractiveness Analysis
10.8.1. By Component
10.8.2. By Wafer Size
10.8.3. By Application
10.8.4. By End-use Industry
10.8.5. By Country & Sub-region
11. Europe GaN Semiconductor Devices Market Analysis and Forecast
11.1. Market Snapshot
11.2. Drivers and Restraints: Impact Analysis
11.3. GaN Semiconductor Devices Market Size (US$ Mn) and Volume (Million Units) Analysis & Forecast, by Component, 2017–2031
11.3.1. Transistor
11.3.2. Gate Driver IC
11.3.3. Power IC
11.3.4. Controller
11.3.5. Power Amplifier
11.3.6. Others
11.4. GaN Semiconductor Devices Market Size (US$ Mn) Analysis & Forecast, by Wafer Size, 2017–2031
11.4.1. 1 & 2 Inch
11.4.2. 4 Inch
11.4.3. 6 Inch
11.4.4. 8 Inch
11.4.5. 12 Inch
11.5. GaN Semiconductor Devices Market Size (US$ Mn) Analysis & Forecast, by Application, 2017–2031
11.5.1. Defense Communication Devices
11.5.2. Telecom & Datacom Server
11.5.3. Chargers & Adapters
11.5.4. Wireless Charging
11.5.5. Battery Test System
11.5.6. Energy Storage System
11.5.7. HVAC
11.5.8. Electronic Devices
11.5.8.1. Smartphones
11.5.8.2. Laptops & Notebooks
11.5.8.3. Others
11.5.9. Others
11.6. GaN Semiconductor Devices Market Size (US$ Mn) Analysis & Forecast, by End-use Industry, 2017–2031
11.6.1. IT & Telecommunication
11.6.2. Consumer Electronics
11.6.3. Automotive & Transportation
11.6.4. Aerospace & Defense
11.6.5. Energy & Utility
11.6.6. Industrial
11.6.7. Others
11.7. GaN Semiconductor Devices Market Size (US$ Mn) and Volume (Million Units) Analysis & Forecast, by Country & Sub-region, 2017–2031
11.7.1. U.K.
11.7.2. Germany
11.7.3. France
11.7.4. Rest of Europe
11.8. Market Attractiveness Analysis
11.8.1. By Component
11.8.2. By Wafer Size
11.8.3. By Application
11.8.4. By End-use Industry
11.8.5. By Country & Sub-region
12. Asia Pacific GaN Semiconductor Devices Market Analysis and Forecast
12.1. Market Snapshot
12.2. Drivers and Restraints: Impact Analysis
12.3. GaN Semiconductor Devices Market Size (US$ Mn) and Volume (Million Units) Analysis & Forecast, by Component, 2017–2031
12.3.1. Transistor
12.3.2. Gate Driver IC
12.3.3. Power IC
12.3.4. Controller
12.3.5. Power Amplifier
12.3.6. Others
12.4. GaN Semiconductor Devices Market Size (US$ Mn) Analysis & Forecast, by Wafer Size, 2017–2031
12.4.1. 1 & 2 Inch
12.4.2. 4 Inch
12.4.3. 6 Inch
12.4.4. 8 Inch
12.4.5. 12 Inch
12.5. GaN Semiconductor Devices Market Size (US$ Mn) Analysis & Forecast, by Application, 2017–2031
12.5.1. Defense Communication Devices
12.5.2. Telecom & Datacom Server
12.5.3. Chargers & Adapters/p>
12.5.4. Wireless Charging
12.5.5. Battery Test System
12.5.6. Energy Storage System
12.5.7. HVAC
12.5.8. Electronic Devices
12.5.8.1. Smartphones
12.5.8.2. Laptops & Notebooks
12.5.8.3. Others
12.5.9. Others
12.6. GaN Semiconductor Devices Market Size (US$ Mn) Analysis & Forecast, by End-use Industry, 2017–2031
12.6.1. IT & Telecommunication
12.6.2. Consumer Electronics
12.6.3. Automotive & Transportation
12.6.4. Aerospace & Defense
12.6.5. Energy & Utility
12.6.6. Industrial
12.6.7. Others
12.7. GaN Semiconductor Devices Market Size (US$ Mn) and Volume (Million Units) Analysis & Forecast, by Country & Sub-region, 2017–2031
12.7.1. China
12.7.2. Japan
12.7.3. India
12.7.4. South Korea
12.7.5. ASEAN
12.7.6. Rest of Asia Pacific
12.8. Market Attractiveness Analysis
12.8.1. By Component
12.8.2. By Wafer Size
12.8.3. By Application
12.8.4. By End-use Industry
12.8.5. By Country & Sub-region
13. Middle East & Africa GaN Semiconductor Devices Market Analysis and Forecast
13.1. Market Snapshot
13.2. Drivers and Restraints: Impact Analysis
13.3. GaN Semiconductor Devices Market Size (US$ Mn) and Volume (Million Units) Analysis & Forecast, by Component, 2017–2031
13.3.1. Transistor
13.3.2. Gate Driver IC
13.3.3. Power IC
13.3.4. Controller
13.3.5. Power Amplifier
13.3.6. Others
13.4. GaN Semiconductor Devices Market Size (US$ Mn) Analysis & Forecast, by Wafer Size, 2017–2031
13.4.1. 1 & 2 Inch
13.4.2. 4 Inch
13.4.3. 6 Inch
13.4.4. 8 Inch
13.4.5. 12 Inch
13.5. GaN Semiconductor Devices Market Size (US$ Mn) Analysis & Forecast, by Application, 2017–2031
13.5.1. Defense Communication Devices
13.5.2. Telecom & Datacom Server
13.5.3. Chargers & Adapters
13.5.4. Wireless Charging
13.5.5. Battery Test System
13.5.6. Energy Storage System
13.5.7. HVAC
13.5.8. Electronic Devices
13.5.8.1. Smartphones
13.5.8.2. Laptops & Notebooks
13.5.8.3. Others
13.5.9. Others
13.6. GaN Semiconductor Devices Market Size (US$ Mn) Analysis & Forecast, by End-use Industry, 2017–2031
13.6.1. IT & Telecommunication
13.6.2. Consumer Electronics
13.6.3. Automotive & Transportation
13.6.4. Aerospace & Defense
13.6.5. Energy & Utility
13.6.6. Industrial
13.6.7. Others
13.7. GaN Semiconductor Devices Market Size (US$ Mn) and Volume (Million Units) Analysis & Forecast, by Country & Sub-region, 2017–2031
13.7.1. GCC
13.7.2. South Africa
13.7.3. Rest of Middle East & Africa
13.8. Market Attractiveness Analysis
13.8.1. By Component
13.8.2. By Wafer Size
13.8.3. By Application
13.8.4. By End-use Industry
13.8.5. By Country & Sub-region
14. South America GaN Semiconductor Devices Market Analysis and Forecast
14.1. Market Snapshot
14.2. Drivers and Restraints: Impact Analysis
14.3. GaN Semiconductor Devices Market Size (US$ Mn) and Volume (Million Units) Analysis & Forecast, by Component, 2017–2031
14.3.1. Transistor
14.3.2. Gate Driver IC
14.3.3. Power IC
14.3.4. Controller
14.3.5. Power Amplifier
14.3.6. Others
14.4. GaN Semiconductor Devices Market Size (US$ Mn) Analysis & Forecast, by Wafer Size, 2017–2031
14.4.1. 1 & 2 Inch
14.4.2. 4 Inch
14.4.3. 6 Inch
14.4.4. 8 Inch
14.4.5. 12 Inch
14.5. GaN Semiconductor Devices Market Size (US$ Mn) Analysis & Forecast, by Application, 2017–2031
14.5.1. Defense Communication Devices
14.5.2. Telecom & Datacom Server
14.5.3. Chargers & Adapters
14.5.4. Wireless Charging
14.5.5. Battery Test System
14.5.6. Energy Storage System
14.5.7. HVAC
14.5.8. Electronic Devices
14.5.8.1. Smartphones
14.5.8.2. Laptops & Notebooks
14.5.8.3. Others
14.5.9. Others
14.6. GaN Semiconductor Devices Market Size (US$ Mn) Analysis & Forecast, by End-use Industry, 2017–2031
14.6.1. IT & Telecommunication
14.6.2. Consumer Electronics
14.6.3. Automotive & Transportation
14.6.4. Aerospace & Defense
14.6.5. Energy & Utility
14.6.6. Industrial
14.6.7. Others
14.7. GaN Semiconductor Devices Market Size (US$ Mn) and Volume (Million Units) Analysis & Forecast, by Country & Sub-region, 2017–2031
14.7.1. Brazil
14.7.2. Rest of South America
14.8. Market Attractiveness Analysis
14.8.1. By Component
14.8.2. By Wafer Size
14.8.3. By Application
14.8.4. By End-use Industry
14.8.5. By Country & Sub-region
15. Competition Assessment
15.1. Global GaN Semiconductor Devices Market Competition Matrix - a Dashboard View
15.1.1. Global GaN Semiconductor Devices Market Company Share Analysis, by Value (2021)
15.1.2. Technological Differentiator
16. Company Profiles (Global Manufacturers/Suppliers)
16.1. Analog Devices, Inc.
16.1.1. Overview
16.1.2. Product Portfolio
16.1.3. Sales Footprint
16.1.4. Key Subsidiaries or Distributors
16.1.5. Strategy and Recent Developments
16.1.6. Key Financials
16.2. CGD Cambridge GaN Devices
16.2.1. Overview
16.2.2. Product Portfolio
16.2.3. Sales Footprint
16.2.4. Key Subsidiaries or Distributors
16.2.5. Strategy and Recent Developments
16.2.6. Key Financials
16.3. Efficient Power Conversion Corporation
16.3.1. Overview
16.3.2. Product Portfolio
16.3.3. Sales Footprint
16.3.4. Key Subsidiaries or Distributors
16.3.5. Strategy and Recent Developments
16.3.6. Key Financials
16.4. Fujitsu
16.4.1. Overview
16.4.2. Product Portfolio
16.4.3. Sales Footprint
16.4.4. Key Subsidiaries or Distributors
16.4.5. Strategy and Recent Developments
16.4.6. Key Financials
16.5. Infineon Technologies AG
16.5.1. Overview
16.5.2. Product Portfolio
16.5.3. Sales Footprint
16.5.4. Key Subsidiaries or Distributors
16.5.5. Strategy and Recent Developments
16.5.6. Key Financials
16.6. Navitas Semiconductor
16.6.1. Overview
16.6.2. Product Portfolio
16.6.3. Sales Footprint
16.6.4. Key Subsidiaries or Distributors
16.6.5. Strategy and Recent Developments
16.6.6. Key Financials
16.7. NXP Semiconductors
16.7.1. Overview
16.7.2. Product Portfolio
16.7.3. Sales Footprint
16.7.4. Key Subsidiaries or Distributors
16.7.5. Strategy and Recent Developments
16.7.6. Key Financials
16.8. Qorvo, Inc.
16.8.1. Overview
16.8.2. Product Portfolio
16.8.3. Sales Footprint
16.8.4. Key Subsidiaries or Distributors
16.8.5. Strategy and Recent Developments
16.8.6. Key Financials
16.9. Renesas Electronics Corporation
16.9.1. Overview
16.9.2. Product Portfolio
16.9.3. Sales Footprint
16.9.4. Key Subsidiaries or Distributors
16.9.5. Strategy and Recent Developments
16.9.6. Key Financials
16.10. Texas Instruments Incorporated
16.10.1. Overview
16.10.2. Product Portfolio
16.10.3. Sales Footprint
16.10.4. Key Subsidiaries or Distributors
16.10.5. Strategy and Recent Developments
16.10.6. Key Financials
16.11. Transphorm, Inc.
16.11.1. Overview
16.11.2. Product Portfolio
16.11.3. Sales Footprint
16.11.4. Key Subsidiaries or Distributors
16.11.5. Strategy and Recent Developments
16.11.6. Key Financials
17. Recommendation
17.1. Opportunity Assessment
17.1.1. By Component
17.1.2. By Wafer Size
17.1.3. By Application
17.1.4. By End-use Industry
17.1.5. By Region
List of Tables
Table 01: Global GaN Semiconductor Devices Market Value (US$ Mn) Forecast, by Component, 2017‒2031
Table 02: Global GaN Semiconductor Devices Market Volume (Million Units) Forecast, by Component, 2017‒2031
Table 03: Global GaN Semiconductor Devices Market Value (US$ Mn) Forecast, by Wafer Size, 2017‒2031
Table 04: Global GaN Semiconductor Devices Market Value (US$ Mn) Forecast, by Application, 2017‒2031
Table 05: Global GaN Semiconductor Devices Market Value (US$ Mn) Forecast, by End-use Industry, 2017‒2031
Table 06: Global GaN Semiconductor Devices Market Value (US$ Mn) Forecast, by Region, 2017‒2031
Table 07: Global GaN Semiconductor Devices Market Volume (Million Units) Forecast, by Region, 2017‒2031
Table 08: North America GaN Semiconductor Devices Market Value (US$ Mn) Forecast, by Component, 2017‒2031
Table 09: North America GaN Semiconductor Devices Market Volume (Million Units) Forecast, by Component, 2017‒2031
Table 10: North America GaN Semiconductor Devices Market Value (US$ Mn) Forecast, by Wafer Size, 2017‒2031
Table 11: North America GaN Semiconductor Devices Market Value (US$ Mn) Forecast, by Application, 2017‒2031
Table 12: North America GaN Semiconductor Devices Market Value (US$ Mn) Forecast, by End-use Industry, 2017‒2031
Table 13: North America GaN Semiconductor Devices Market Value (US$ Mn) Forecast, by Country & Sub-region, 2017‒2031
Table 14: North America GaN Semiconductor Devices Market Volume (Million Units) Forecast, Country & Sub-region, 2017‒2031
Table 15: Europe GaN Semiconductor Devices Market Value (US$ Mn) Forecast, by Component, 2017‒2031
Table 16: Europe GaN Semiconductor Devices Market Volume (Million Units) Forecast, by Component, 2017‒2031
Table 17: Europe GaN Semiconductor Devices Market Value (US$ Mn) Forecast, by Wafer Size, 2017‒2031
Table 18: Europe GaN Semiconductor Devices Market Value (US$ Mn) Forecast, by Application, 2017‒2031
Table 19: Europe GaN Semiconductor Devices Market Value (US$ Mn) Forecast, by End-use Industry, 2017‒2031
Table 20: Europe GaN Semiconductor Devices Market Value (US$ Mn) Forecast, by Country & Sub-region, 2017‒2031
Table 21: Europe GaN Semiconductor Devices Market Volume (Million Units) Forecast, Country & Sub-region, 2017‒2031
Table 22: Asia Pacific GaN Semiconductor Devices Market Value (US$ Mn) Forecast, by Component, 2017‒2031
Table 23: Asia Pacific GaN Semiconductor Devices Market Volume (Million Units) Forecast, by Component, 2017‒2031
Table 24: Asia Pacific GaN Semiconductor Devices Market Value (US$ Mn) Forecast, by Wafer Size, 2017‒2031
Table 25: Asia Pacific GaN Semiconductor Devices Market Value (US$ Mn) Forecast, by Application, 2017‒2031
Table 26: Asia Pacific GaN Semiconductor Devices Market Value (US$ Mn) Forecast, by End-use Industry, 2017‒2031
Table 27: Asia Pacific GaN Semiconductor Devices Market Value (US$ Mn) Forecast, by Country & Sub-region, 2017‒2031
Table 28: Asia Pacific GaN Semiconductor Devices Market Volume (Million Units) Forecast, Country & Sub-region, 2017‒2031
Table 29: Middle East & Africa GaN Semiconductor Devices Market Value (US$ Mn) Forecast, by Component, 2017‒2031
Table 30: Middle East & Africa GaN Semiconductor Devices Market Volume (Million Units) Forecast, by Component, 2017‒2031
Table 31: Middle East & Africa GaN Semiconductor Devices Market Value (US$ Mn) Forecast, by Wafer Size, 2017‒2031
Table 32: Middle East & Africa GaN Semiconductor Devices Market Value (US$ Mn) Forecast, by Application, 2017‒2031
Table 33: Middle East & Africa GaN Semiconductor Devices Market Value (US$ Mn) Forecast, by End-use Industry, 2017‒2031
Table 34: Middle East & Africa GaN Semiconductor Devices Market Value (US$ Mn) Forecast, by Country & Sub-region, 2017‒2031
Table 35: Middle East & Africa GaN Semiconductor Devices Market Volume (Million Units) Forecast, Country & Sub-region, 2017‒2031
Table 36: South America GaN Semiconductor Devices Market Value (US$ Mn) Forecast, by Component, 2017‒2031
Table 37: South America GaN Semiconductor Devices Market Volume (Million Units) Forecast, by Component, 2017‒2031
Table 38: South America GaN Semiconductor Devices Market Value (US$ Mn) Forecast, by Wafer Size, 2017‒2031
Table 39: South America GaN Semiconductor Devices Market Value (US$ Mn) Forecast, by Application, 2017‒2031
Table 40: South America GaN Semiconductor Devices Market Value (US$ Mn) Forecast, by End-use Industry, 2017‒2031
Table 41: South America GaN Semiconductor Devices Market Value (US$ Mn) Forecast, by Country & Sub-region, 2017‒2031
Table 42: South America GaN Semiconductor Devices Market Volume (Million Units) Forecast, Country & Sub-region, 2017‒2031
List of Figures
Figure 01: Global GaN Semiconductor Devices Market Share Analysis, by Region, 2022 and 2031
Figure 02: Global GaN Semiconductor Devices Price Trend Analysis (Average Price, US$ Thousand)
Figure 03: Global GaN Semiconductor Devices Market Size & Forecast, Value (US$ Mn), 2017-2031
Figure 04: Global GaN Semiconductor Devices Market Size & Forecast, Volume (Million Units), 2017-2031
Figure 05: Global GaN Semiconductor Devices Market, Year-on-Year Growth, Global Overview, 2018-2031
Figure 06: Global GaN Semiconductor Devices Market Projections by Component, Value (US$ Mn), 2017-2031
Figure 07: Global GaN Semiconductor Devices Market, Incremental Opportunity, by Component, Value (US$ Mn ), 2022-2031
Figure 08: Global GaN Semiconductor Devices Market Share Analysis, by Component, 2022 and 2031
Figure 09: Global GaN Semiconductor Devices Market Projections by Wafer Size, Value (US$ Mn), 2017-2031
Figure 10: Global GaN Semiconductor Devices Market, Incremental Opportunity, by Wafer Size, Value (US$ Mn), 2022-2031
Figure 11: Global GaN Semiconductor Devices Market Share Analysis, by Wafer Size, 2022 and 2031
Figure 12: Global GaN Semiconductor Devices Market Projections by Application, Value (US$ Mn ), 2017-2031
Figure 13: Global GaN Semiconductor Devices Market, Incremental Opportunity, by Application, Value (US$ Mn ), 2022-2031
Figure 14: Global GaN Semiconductor Devices Market Share Analysis, by Application, 2022 and 2031
Figure 15: Global GaN Semiconductor Devices Market Projections by End-use Industry, Value (US$ Mn), 2017-2031
Figure 16: Global GaN Semiconductor Devices Market, Incremental Opportunity, by End-use Industry, Value (US$ Mn), 2022-2031
Figure 17: Global GaN Semiconductor Devices Market Share Analysis, by End-use Industry, 2022 and 2031
Figure 18: Global GaN Semiconductor Devices Market Projections by Region, Value (US$ Mn), 2017-2031
Figure 19: Global GaN Semiconductor Devices Market, Incremental Opportunity, by Region, Value (US$ Mn), 2022-2031
Figure 20: Global GaN Semiconductor Devices Market Share Analysis, by Region, 2022 and 2031
Figure 21: North America GaN Semiconductor Devices Market Size & Forecast, Value (US$ Mn), 2017-2031
Figure 22: North America GaN Semiconductor Devices Market Size & Forecast, Volume (Million Units), 2017-2031
Figure 23: North America GaN Semiconductor Devices Market, Year-on-Year Growth, North America Overview, 2018-2031
Figure 24: North America GaN Semiconductor Devices Market Projections by Component, Value (US$ Mn), 2017-2031
Figure 25: North America GaN Semiconductor Devices Market, Incremental Opportunity, by Component, Value (US$ Mn ), 2022-2031
Figure 26: North America GaN Semiconductor Devices Market Share Analysis, by Component, 2022 and 2031
Figure 27: North America GaN Semiconductor Devices Market Projections by Wafer Size, Value (US$ Mn), 2017-2031
Figure 28: North America GaN Semiconductor Devices Market, Incremental Opportunity, by Wafer Size, Value (US$ Mn), 2022-2031
Figure 29: North America GaN Semiconductor Devices Market Share Analysis, by Wafer Size, 2022 and 2031
Figure 30: North America GaN Semiconductor Devices Market Projections by Application, Value (US$ Mn ), 2017-2031
Figure 31: North America GaN Semiconductor Devices Market, Incremental Opportunity, by Application, Value (US$ Mn ), 2022-2031
Figure 32: North America GaN Semiconductor Devices Market Share Analysis, by Application, 2022 and 2031
Figure 33: North America GaN Semiconductor Devices Market Projections by End-use Industry, Value (US$ Mn), 2017-2031
Figure 34: North America GaN Semiconductor Devices Market, Incremental Opportunity, by End-use Industry, Value (US$ Mn), 2022-2031
Figure 35: North America GaN Semiconductor Devices Market Share Analysis, by End-use Industry, 2022 and 2031
Figure 36: North America GaN Semiconductor Devices Market Projections by Country & Sub-region, Value (US$ Mn), 2017-2031
Figure 37: North America GaN Semiconductor Devices Market, Incremental Opportunity, by Country & Sub-region, Value (US$ Mn), 2022-2031
Figure 38: North America GaN Semiconductor Devices Market Share Analysis, by Country & Sub-region, 2022 and 2031
Figure 39: Europe GaN Semiconductor Devices Market Size & Forecast, Value (US$ Mn), 2017-2031
Figure 40: Europe GaN Semiconductor Devices Market Size & Forecast, Volume (Million Units), 2017-2031
Figure 41: Europe GaN Semiconductor Devices Market, Year-on-Year Growth, Europe Overview, 2018-2031
Figure 42: Europe GaN Semiconductor Devices Market Projections by Component, Value (US$ Mn), 2017-2031
Figure 43: Europe GaN Semiconductor Devices Market, Incremental Opportunity, by Component, Value (US$ Mn ), 2022-2031
Figure 44: Europe GaN Semiconductor Devices Market Share Analysis, by Component, 2022 and 2031
Figure 45: Europe GaN Semiconductor Devices Market Projections by Wafer Size, Value (US$ Mn), 2017-2031
Figure 46: Europe GaN Semiconductor Devices Market, Incremental Opportunity, by Wafer Size, Value (US$ Mn), 2022-2031
Figure 47: Europe GaN Semiconductor Devices Market Share Analysis, by Wafer Size, 2022 and 2031
Figure 48: Europe GaN Semiconductor Devices Market Projections by Application, Value (US$ Mn ), 2017-2031
Figure 49: Europe GaN Semiconductor Devices Market, Incremental Opportunity, by Application, Value (US$ Mn ), 2022-2031
Figure 50: Europe GaN Semiconductor Devices Market Share Analysis, by Application, 2022 and 2031
Figure 51: Europe GaN Semiconductor Devices Market Projections by End-use Industry, Value (US$ Mn), 2017-2031
Figure 52: Europe GaN Semiconductor Devices Market, Incremental Opportunity, by End-use Industry, Value (US$ Mn), 2022-2031
Figure 53: Europe GaN Semiconductor Devices Market Share Analysis, by End-use Industry, 2022 and 2031
Figure 54: Europe GaN Semiconductor Devices Market Projections by Country & Sub-region, Value (US$ Mn), 2017-2031
Figure 55: Europe GaN Semiconductor Devices Market, Incremental Opportunity, by Country & Sub-region, Value (US$ Mn), 2022-2031
Figure 56: Europe GaN Semiconductor Devices Market Share Analysis, by Country & Sub-region, 2022 and 2031
Figure 57: Asia Pacific GaN Semiconductor Devices Market Size & Forecast, Value (US$ Mn), 2017-2031
Figure 58: Asia Pacific GaN Semiconductor Devices Market Size & Forecast, Volume (Million Units), 2017-2031
Figure 59: Asia Pacific GaN Semiconductor Devices Market, Year-on-Year Growth, Asia Pacific Overview, 2018-2031
Figure 60: Asia Pacific GaN Semiconductor Devices Market Projections by Component, Value (US$ Mn), 2017-2031
Figure 61: Asia Pacific GaN Semiconductor Devices Market, Incremental Opportunity, by Component, Value (US$ Mn ), 2022-2031
Figure 62: Asia Pacific GaN Semiconductor Devices Market Share Analysis, by Component, 2022 and 2031
Figure 63: Asia Pacific GaN Semiconductor Devices Market Projections by Wafer Size, Value (US$ Mn), 2017-2031
Figure 64: Asia Pacific GaN Semiconductor Devices Market, Incremental Opportunity, by Wafer Size, Value (US$ Mn), 2022-2031
Figure 65: Asia Pacific GaN Semiconductor Devices Market Share Analysis, by Wafer Size, 2022 and 2031
Figure 66: Asia Pacific GaN Semiconductor Devices Market Projections by Application, Value (US$ Mn ), 2017-2031
Figure 67: Asia Pacific GaN Semiconductor Devices Market, Incremental Opportunity, by Application, Value (US$ Mn ), 2022-2031
Figure 68: Asia Pacific GaN Semiconductor Devices Market Share Analysis, by Application, 2022 and 2031
Figure 69: Asia Pacific GaN Semiconductor Devices Market Projections by End-use Industry, Value (US$ Mn), 2017-2031
Figure 70: Asia Pacific GaN Semiconductor Devices Market, Incremental Opportunity, by End-use Industry, Value (US$ Mn), 2022-2031
Figure 71: Asia Pacific GaN Semiconductor Devices Market Share Analysis, by End-use Industry, 2022 and 2031
Figure 72: Asia Pacific GaN Semiconductor Devices Market Projections by Country & Sub-region, Value (US$ Mn), 2017-2031
Figure 73: Asia Pacific GaN Semiconductor Devices Market, Incremental Opportunity, by Country & Sub-region, Value (US$ Mn), 2022-2031
Figure 74: Asia Pacific GaN Semiconductor Devices Market Share Analysis, by Country & Sub-region, 2022 and 2031
Figure 75: Middle East & Africa GaN Semiconductor Devices Market Size & Forecast, Value (US$ Mn), 2017-2031
Figure 76: Middle East & Africa GaN Semiconductor Devices Market Size & Forecast, Volume (Million Units), 2017-2031
Figure 77: Middle East & Africa GaN Semiconductor Devices Market, Year-on-Year Growth, Middle East & Africa Overview, 2018-2031
Figure 78: Middle East & Africa GaN Semiconductor Devices Market Projections by Component, Value (US$ Mn), 2017-2031
Figure 79: Middle East & Africa GaN Semiconductor Devices Market, Incremental Opportunity, by Component, Value (US$ Mn ), 2022-2031
Figure 80: Middle East & Africa GaN Semiconductor Devices Market Share Analysis, by Component, 2022 and 2031
Figure 81: Middle East & Africa GaN Semiconductor Devices Market Projections by Wafer Size, Value (US$ Mn), 2017-2031
Figure 82: Middle East & Africa GaN Semiconductor Devices Market, Incremental Opportunity, by Wafer Size, Value (US$ Mn), 2022-2031
Figure 83: Middle East & Africa GaN Semiconductor Devices Market Share Analysis, by Wafer Size, 2022 and 2031
Figure 84: Middle East & Africa GaN Semiconductor Devices Market Projections by Application, Value (US$ Mn ), 2017-2031
Figure 85: Middle East & Africa GaN Semiconductor Devices Market, Incremental Opportunity, by Application, Value (US$ Mn ), 2022-2031
Figure 86: Middle East & Africa GaN Semiconductor Devices Market Share Analysis, by Application, 2022 and 2031
Figure 87: Middle East & Africa GaN Semiconductor Devices Market Projections by End-use Industry, Value (US$ Mn), 2017-2031
Figure 88: Middle East & Africa GaN Semiconductor Devices Market, Incremental Opportunity, by End-use Industry, Value (US$ Mn), 2022-2031
Figure 89: Middle East & Africa GaN Semiconductor Devices Market Share Analysis, by End-use Industry, 2022 and 2031
Figure 90: Middle East & Africa GaN Semiconductor Devices Market Projections by Country & Sub-region, Value (US$ Mn), 2017-2031
Figure 91: Middle East & Africa GaN Semiconductor Devices Market, Incremental Opportunity, by Country & Sub-region, Value (US$ Mn), 2022-2031
Figure 92: Middle East & Africa GaN Semiconductor Devices Market Share Analysis, by Country & Sub-region, 2022 and 2031
Figure 93: South America GaN Semiconductor Devices Market Size & Forecast, Value (US$ Mn), 2017-2031
Figure 94: South America GaN Semiconductor Devices Market Size & Forecast, Volume (Million Units), 2017-2031
Figure 95: South America GaN Semiconductor Devices Market, Year-on-Year Growth, South America Overview, 2018-2031
Figure 96: South America GaN Semiconductor Devices Market Projections by Component, Value (US$ Mn), 2017-2031
Figure 97: South America GaN Semiconductor Devices Market, Incremental Opportunity, by Component, Value (US$ Mn ), 2022-2031
Figure 98: South America GaN Semiconductor Devices Market Share Analysis, by Component, 2022 and 2031
Figure 99: South America GaN Semiconductor Devices Market Projections by Wafer Size, Value (US$ Mn), 2017-2031
Figure 100: South America GaN Semiconductor Devices Market, Incremental Opportunity, by Wafer Size, Value (US$ Mn), 2022-2031
Figure 101: South America GaN Semiconductor Devices Market Share Analysis, by Wafer Size, 2022 and 2031
Figure 102: South America GaN Semiconductor Devices Market Projections by Application, Value (US$ Mn ), 2017-2031
Figure 103: South America GaN Semiconductor Devices Market, Incremental Opportunity, by Application, Value (US$ Mn ), 2022-2031
Figure 104: South America GaN Semiconductor Devices Market Share Analysis, by Application, 2022 and 2031
Figure 105: South America GaN Semiconductor Devices Market Projections by End-use Industry, Value (US$ Mn), 2017-2031
Figure 106: South America GaN Semiconductor Devices Market, Incremental Opportunity, by End-use Industry, Value (US$ Mn), 2022-2031
Figure 107: South America GaN Semiconductor Devices Market Share Analysis, by End-use Industry, 2022 and 2031
Figure 108: South America GaN Semiconductor Devices Market Projections by Country & Sub-region, Value (US$ Mn), 2017-2031
Figure 109: South America GaN Semiconductor Devices Market, Incremental Opportunity, by Country & Sub-region, Value (US$ Mn), 2022-2031
Figure 110: South America GaN Semiconductor Devices Market Share Analysis, by Country & Sub-region, 2022 and 2031
Copyright © Transparency Market Research, Inc. All Rights reserved
Trust Online

GaN Semiconductor Devices Market