
Reports
Reports
Companies in the surface haptic technology market are tapping opportunities in retail and other domains, apart from consumer electronics and automobiles to expand their product portfolio. For instance, in June 2019, leading manufacturer of touchscreen monitors and displays Mimo Monitors, announced its collaboration with Tanvas, pioneers in surface haptics to launch the Mimo Vue with TanvasTouch at the InfoComm 2019 trade show.
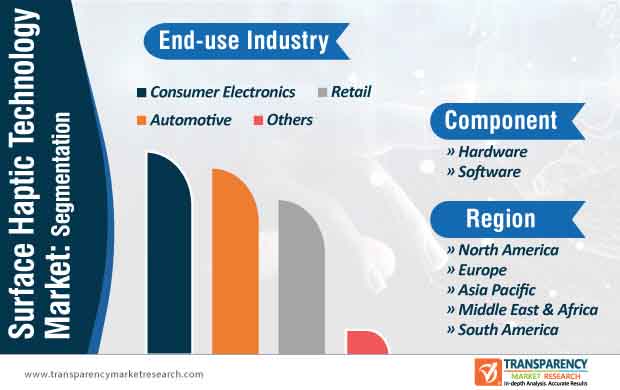
Companies in the surface haptic technology market are integrating touchscreens with innovative surface haptics to develop programmable textures and feelings on flat and physical surfaces. Such displays are acquiring prominence in retail, digital signage, and conference rooms, among others. As such, the retail end-use industry segment of the surface haptic technology market is projected for exponential growth during the forecast period.
Manufacturers in the market for surface haptic technology are becoming aware that apart from sight and sound, the power of touch has promising opportunities for cultivating connection and creating immersion to build long-term brand affinity.
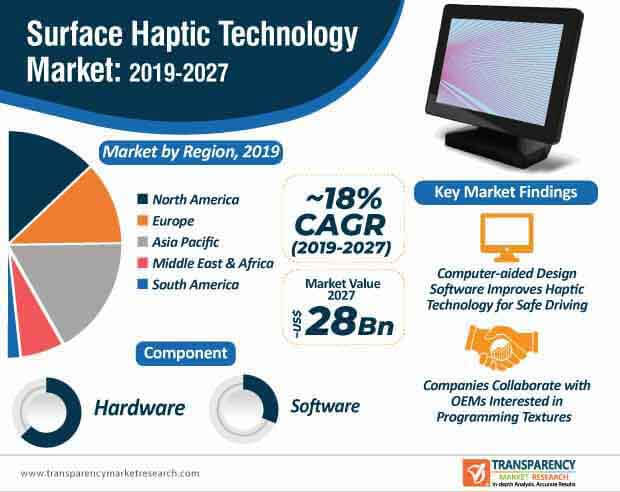
Surface haptic technology is helping companies to enrich the relationship of humans with machines by adding a sense of touch. Likewise, companies in the market for surface haptic technology are leveraging opportunities in the automotive landscape to expand their business horizons. As such, the automotive end-use industry segment is estimated for significant growth during the forecast period and is projected to account for a share of ~36% of the surface haptic technology market by 2027. Hence, R&D companies are using computer-aided design (CAD) software to improve haptic technology and enhance driver safety.
Leading R&D companies are investing in CAD software to develop patented haptic processing units (HPUs). For instance, leading Paris-based R&D company Actronika uses Onshape-a computer-aided design software system, to connect HPUs with tiny vibrotactile motors and actuators to deploy high definition sensations. Companies in the surface haptic technology market are tapping opportunities in touch-sensitive technology for cars. For instance, popular luxury car Porsche Panamera is integrated with the haptic technology for its dashboard.
The ever-increasing consumer electronics industry is undergoing a change with surface haptic technology. As such, consumer electronics end-use industry segment of the surface haptic technology market is estimated grow at a significant rate during the forecast period. Hence, manufacturers are focusing on smartphones, since the domain of consumer electronics is anticipated for aggressive growth during the forecast period.
Moreover, introduction of new mobile phone technologies, with the help of surface haptic technology, is expected to fuel innovation in the global market landscape. For instance, Hap2U, a haptic technology company in France, announced that the company has received the Innovation Awards Honoree ahead of the 2020 Consumer Electronics Show (CES).
Companies in the surface haptic technology market are participating in trade shows to strategically position their company on the global level. Thus, startups and emerging players should take insights from leading companies, since several consumer electronics companies showcase their next-gen innovations through trade shows.
The surface haptic technology market is continuously growing with the presence of well-established players commanding a larger market share. Thus, emerging players are increasing efforts to innovate in material technologies for various haptics.
Both leading and emerging players are increasing R&D to understand the characteristics of biological touch sensors in electronic display of video monitors and loudspeakers. However, certain pitfalls in haptic engineering, such as difficulty in understanding general purpose tactile displays in consumer electronics, pose as a challenge for companies in the market for surface haptic technology. Hence, companies are gaining expertise in new material technologies such as organic electronic materials and carbon nanomaterials to enhance the general purpose tactile displays in consumer electronics.
Increasing integration of physical and digital environments acts as one of the major drivers for the surface haptic technology market. Growing uptake of smartphones and proliferation of augmented reality displays has fueled market growth. Companies are streamlining their production capabilities to experiment with techniques of chemically synthesizing and doping new materials to fine-tune touch-sensitive properties of electronic devices.
Analysts’ Viewpoint
The surface haptic technology market is projected to grow at a significant CAGR of ~18% during the forecast period. Companies are gaining success at winning consumers by integrating haptic technology with mobile apps to cater to user convenience.
Integration of physical and digital environments has triggered the proliferation of new technologies in smartphones, high definition televisions, and virtual reality displays. However, innovations in IT for sense of touch has not been entirely achieved by companies. Hence, manufacturers should increase R&D in new methods of design and fabrication of tactile displays that match the capabilities of biological sensing.
Surface Haptic Technology Market: Overview
Rising Adoption in Consumer Electronics Industry: A Key Driver
Focus on Surface Haptic Technology for Use in Automotive Applications: A Latest Trend in Market
Higher Energy Consumption by Surface Haptic Technology a Major Challenge for Global Market
Global Surface Haptic Technology Market: Competition Landscape
Global Surface Haptic Technology Market: Key Developments
The global Surface Haptic Technology Market is projected to reach a value of US$ 28 Bn by the end of 2027
Surface Haptic Technology Market is anticipated to grow at a CAGR of 18% during the forecast period
Asia Pacific accounted for a major share of the global Surface Haptic Technology Market
The forecast period considered for the Surface Haptic Technology Market is 2019 - 2027
Key players in the global Surface Haptic Technology Market include TDK Corporation, Actronika, Tanvas, Immersion Corporation, and Texas Instruments Incorporated
1. Preface
1.1. Market Definition and Scope
1.2. Market Segmentation
1.3. Key Research Objectives
1.4. Research Highlights
2. Assumptions and Research Methodology
3. Executive Summary: Global Surface Haptic Technology Market
4. Key Market Developments
5. Market Overview
5.1. Introduction
5.2. Market Dynamics
5.2.1. Drivers
5.2.2. Restraints
5.2.3. Opportunities
5.3. Global Surface Haptic Technology Market Analysis and Forecast, 2017–2027
5.3.1. Market Revenue (US$ Mn)
5.4. Porter’s Five Forces Analysis
5.5. Ecosystem Analysis
5.6. Market Outlook
5.7. Global Trends
6. Global Surface Haptic Technology Market Analysis and Forecast, by Component
6.1. Overview & Definitions
6.2. Global Surface Haptic Technology Market Revenue (US$ Mn) Forecast, by Component, 2017–2027
6.2.1. Hardware
6.2.2. Software
6.3. Global Surface Haptic Technology Market Attractiveness, by Component
7. Global Surface Haptic Technology Market Analysis and Forecast, by End-use Industry
7.1. Overview & Definitions
7.2. Global Surface Haptic Technology Market Revenue (US$ Mn) Forecast, by End-use Industry, 2017–2027
7.2.1. Consumer Electronics
7.2.2. Retail
7.2.3. Automotive
7.2.4. Others
7.3. Global Surface Haptic Technology Market Attractiveness, by End-use Industry
8. Global Surface Haptic Technology Market Analysis and Forecast, by Region
8.1. Key Findings
8.2. Global Surface Haptic Technology Market Revenue (US$ Mn) Forecast, by Region, 2017–2027
8.2.1. North America
8.2.2. Europe
8.2.3. Asia Pacific
8.2.4. Middle East & Africa
8.2.5. South America
8.3. Global Surface Haptic Technology Market Attractiveness, by Region
9. North America Surface Haptic Technology Market Analysis and Forecast
9.1. Key Findings
9.2. North America Surface Haptic Technology Market Revenue (US$ Mn) Forecast, by Component, 2017–2027
9.2.1. Hardware
9.2.2. Software
9.3. North America Surface Haptic Technology Market Revenue (US$ Mn) Forecast, by End-use Industry, 2017–2027
9.3.1. Consumer Electronics
9.3.2. Retail
9.3.3. Automotive
9.3.4. Others
9.4. North America Surface Haptic Technology Market Revenue (US$ Mn) Forecast, by Country/Sub-region, 2017–2027
9.4.1. U.S.
9.4.1.1. Key Findings
9.4.1.2. U.S. Surface Haptic Technology Market Revenue (US$ Mn) Forecast, by Component, 2017–2027
9.4.1.2.1. Hardware
9.4.1.2.2. Software
9.4.1.3. U.S. Surface Haptic Technology Market Revenue (US$ Mn) Forecast, by End-use Industry, 2017–2027
9.4.1.3.1. Consumer Electronics
9.4.1.3.2. Retail
9.4.1.3.3. Automotive
9.4.1.3.4. Others
9.4.2. Canada
9.4.2.1. Key Findings
9.4.2.2. Canada Surface Haptic Technology Market Revenue (US$ Mn) Forecast, by Component, 2017–2027
9.4.2.2.1. Hardware
9.4.2.2.2. Software
9.4.2.3. Canada Surface Haptic Technology Market Revenue (US$ Mn) Forecast, by End-use Industry, 2017–2027
9.4.2.3.1. Consumer Electronics
9.4.2.3.2. Retail
9.4.2.3.3. Automotive
9.4.2.3.4. Others
9.4.3. Rest of North America
9.4.3.1. Key Findings
9.4.3.2. Rest of North America Surface Haptic Technology Market Revenue (US$ Mn) Forecast, by Component, 2017–2027
9.4.3.2.1. Hardware
9.4.3.2.2. Software
9.4.3.3. Rest of North America Surface Haptic Technology Market Revenue (US$ Mn) Forecast, by End-use Industry, 2017–2027
9.4.3.3.1. Consumer Electronics
9.4.3.3.2. Retail
9.4.3.3.3. Automotive
9.4.3.3.4. Others
9.5. North America Surface Haptic Technology Market Attractiveness Analysis
9.5.1. By Component
9.5.2. By End-use Industry
9.5.3. By Country/Sub-region
10. Europe Surface Haptic Technology Market Analysis and Forecast
10.1. Key Findings
10.2. Europe Surface Haptic Technology Market Revenue (US$ Mn) Forecast, by Component, 2017–2027
10.2.1. Hardware
10.2.2. Software
10.3. Europe Surface Haptic Technology Market Revenue (US$ Mn) Forecast, by End-use Industry, 2017–2027
10.3.1. Consumer Electronics
10.3.2. Retail
10.3.3. Automotive
10.3.4. Others
10.4. Europe Surface Haptic Technology Market Revenue (US$ Mn) Forecast, by Country/Sub-region, 2017–2027
10.4.1. Germany
10.4.1.1. Key Findings
10.4.1.2. Germany Surface Haptic Technology Market Revenue (US$ Mn) Forecast, by Component, 2017–2027
10.4.1.2.1. Hardware
10.4.1.2.2. Software
10.4.1.3. Germany Surface Haptic Technology Market Revenue (US$ Mn) Forecast, by End-use Industry, 2017–2027
10.4.1.3.1. Consumer Electronics
10.4.1.3.2. Retail
10.4.1.3.3. Automotive
10.4.1.3.4. Others
10.4.2. France
10.4.2.1. Key Findings
10.4.2.2. France Surface Haptic Technology Market Revenue (US$ Mn) Forecast, by Component, 2017–2027
10.4.2.2.1. Hardware
10.4.2.2.2. Software
10.4.2.3. France Surface Haptic Technology Market Revenue (US$ Mn) Forecast, by End-use Industry, 2017–2027
10.4.2.3.1. Consumer Electronics
10.4.2.3.2. Retail
10.4.2.3.3. Automotive
10.4.2.3.4. Others
10.4.3. U.K.
10.4.3.1. Key Findings
10.4.3.2. U.K. Surface Haptic Technology Market Revenue (US$ Mn) Forecast, by Component, 2017–2027
10.4.3.2.1. Hardware
10.4.3.2.2. Software
10.4.3.3. U.K. Surface Haptic Technology Market Revenue (US$ Mn) Forecast, by End-use Industry, 2017–2027
10.4.3.3.1. Consumer Electronics
10.4.3.3.2. Retail
10.4.3.3.3. Automotive
10.4.3.3.4. Others
10.4.4. Rest of Europe
10.4.4.1. Key Findings
10.4.4.2. Rest of Europe Surface Haptic Technology Market Revenue (US$ Mn) Forecast, by Component, 2017–2027
10.4.4.2.1. Hardware
10.4.4.2.2. Software
10.4.4.3. Rest of Europe Surface Haptic Technology Market Revenue (US$ Mn) Forecast, by End-use Industry, 2017–2027
10.4.4.3.1. Consumer Electronics
10.4.4.3.2. Retail
10.4.4.3.3. Automotive
10.4.4.3.4. Others
10.5. Europe Surface Haptic Technology Market Attractiveness Analysis
10.5.1. By Component
10.5.2. By End-use Industry
10.5.3. By Country/Sub-region
11. Asia Pacific Surface Haptic Technology Market Analysis and Forecast
11.1. Key Findings
11.2. Asia Pacific Surface Haptic Technology Market Revenue (US$ Mn) Forecast, by Component, 2017–2027
11.2.1. Hardware
11.2.2. Software
11.3. Asia Pacific Surface Haptic Technology Market Revenue (US$ Mn) Forecast, by End-use Industry, 2017–2027
11.3.1. Consumer Electronics
11.3.2. Retail
11.3.3. Automotive
11.3.4. Others
11.4. Asia Pacific Surface Haptic Technology Market Revenue (US$ Mn) Forecast, by Country/Sub-region, 2017–2027
11.4.1. China
11.4.1.1. Key Findings
11.4.1.2. China Surface Haptic Technology Market Revenue (US$ Mn) Forecast, by Component, 2017–2027
11.4.1.2.1. Hardware
11.4.1.2.2. Software
11.4.1.3. China Surface Haptic Technology Market Revenue (US$ Mn) Forecast, by End-use Industry, 2017–2027
11.4.1.3.1. Consumer Electronics
11.4.1.3.2. Retail
11.4.1.3.3. Automotive
11.4.1.3.4. Others
11.4.2. Japan
11.4.2.1. Key Findings
11.4.2.2. Japan Surface Haptic Technology Market Revenue (US$ Mn) Forecast, by Component, 2017–2027
11.4.2.2.1. Hardware
11.4.2.2.2. Software
11.4.2.3. Japan Surface Haptic Technology Market Revenue (US$ Mn) Forecast, by End-use Industry, 2017–2027
11.4.2.3.1. Consumer Electronics
11.4.2.3.2. Retail
11.4.2.3.3. Automotive
11.4.2.3.4. Others
11.4.3. India
11.4.3.1. Key Findings
11.4.3.2. India Surface Haptic Technology Market Revenue (US$ Mn) Forecast, by Component, 2017–2027
11.4.3.2.1. Hardware
11.4.3.2.2. Software
11.4.3.3. India Surface Haptic Technology Market Revenue (US$ Mn) Forecast, by End-use Industry, 2017–2027
11.4.3.3.1. Consumer Electronics
11.4.3.3.2. Retail
11.4.3.3.3. Automotive
11.4.3.3.4. Others
11.4.4. Rest of Asia Pacific
11.4.4.1. Key Findings
11.4.4.2. Rest of Asia Pacific Surface Haptic Technology Market Revenue (US$ Mn) Forecast, by Component, 2017–2027
11.4.4.2.1. Hardware
11.4.4.2.2. Software
11.4.4.3. Rest of Asia Pacific Surface Haptic Technology Market Revenue (US$ Mn) Forecast, by End-use Industry, 2017–2027
11.4.4.3.1. Consumer Electronics
11.4.4.3.2. Retail
11.4.4.3.3. Automotive
11.4.4.3.4. Others
11.5. Asia Pacific Surface Haptic Technology Market Attractiveness Analysis
11.5.1. By Component
11.5.2. By End-use Industry
11.5.3. By Country/Sub-region
12. Middle East & Africa Surface Haptic Technology Market Analysis and Forecast
12.1. Key Findings
12.2. Middle East & Africa Surface Haptic Technology Market Revenue (US$ Mn) Forecast, by Component, 2017–2027
12.2.1. Hardware
12.2.2. Software
12.3. Middle East & Africa Surface Haptic Technology Market Revenue (US$ Mn) Forecast, by End-use Industry, 2017–2027
12.3.1. Consumer Electronics
12.3.2. Retail
12.3.3. Automotive
12.3.4. Others
12.4. Middle East & Africa Surface Haptic Technology Market Revenue (US$ Mn) Forecast, by Country/Sub-region, 2017–2027
12.4.1. GCC
12.4.1.1. Key Findings
12.4.1.2. GCC Surface Haptic Technology Market Revenue (US$ Mn) Forecast, by Component, 2017–2027
12.4.1.2.1. Hardware
12.4.1.2.2. Software
12.4.1.3. GCC Surface Haptic Technology Market Revenue (US$ Mn) Forecast, by End-use Industry, 2017–2027
12.4.1.3.1. Consumer Electronics
12.4.1.3.2. Retail
12.4.1.3.3. Automotive
12.4.1.3.4. Others
12.4.2. South Africa
12.4.2.1. Key Findings
12.4.2.2. South Africa Surface Haptic Technology Market Revenue (US$ Mn) Forecast, by Component, 2017–2027
12.4.2.2.1. Hardware
12.4.2.2.2. Software
12.4.2.3. South Africa Surface Haptic Technology Market Revenue (US$ Mn) Forecast, by End-use Industry, 2017–2027
12.4.2.3.1. Consumer Electronics
12.4.2.3.2. Retail
12.4.2.3.3. Automotive
12.4.2.3.4. Others
12.4.3. Rest of Middle East & Africa
12.4.3.1. Key Findings
12.4.3.2. Rest of Middle East & Africa Surface Haptic Technology Market Revenue (US$ Mn) Forecast, by Component, 2017–2027
12.4.3.2.1. Hardware
12.4.3.2.2. Software
12.4.3.3. Rest of Middle East & Africa Surface Haptic Technology Market Revenue (US$ Mn) Forecast, by End-use Industry, 2017–2027
12.4.3.3.1. Consumer Electronics
12.4.3.3.2. Retail
12.4.3.3.3. Automotive
12.4.3.3.4. Others
12.5. Middle East & Africa Surface Haptic Technology Market Attractiveness Analysis
12.5.1. By Component
12.5.2. By End-use Industry
12.5.3. By Country/Sub-region
13. South America Surface Haptic Technology Market Analysis and Forecast
13.1. Key Findings
13.2. South America Surface Haptic Technology Market Revenue (US$ Mn) Forecast, by Component, 2017–2027
13.2.1. Hardware
13.2.2. Software
13.3. South America Surface Haptic Technology Market Revenue (US$ Mn) Forecast, by End-use Industry, 2017–2027
13.3.1. Consumer Electronics
13.3.2. Retail
13.3.3. Automotive
13.3.4. Others
13.4. South America Surface Haptic Technology Market Revenue (US$ Mn) Forecast, by Country/Sub-region, 2017–2027
13.4.1. Brazil
13.4.1.1. Key Findings
13.4.1.2. Brazil Surface Haptic Technology Market Revenue (US$ Mn) Forecast, by Component, 2017–2027
13.4.1.2.1. Hardware
13.4.1.2.2. Software
13.4.1.3. Brazil Surface Haptic Technology Market Revenue (US$ Mn) Forecast, by End-use Industry, 2017–2027
13.4.1.3.1. Consumer Electronics
13.4.1.3.2. Retail
13.4.1.3.3. Automotive
13.4.1.3.4. Others
13.4.2. Rest of South America
13.4.2.1. Key Findings
13.4.2.2. Rest of South America Surface Haptic Technology Market Revenue (US$ Mn) Forecast, by Component, 2017–2027
13.4.2.2.1. Hardware
13.4.2.2.2. Software
13.4.2.3. Rest of South America Surface Haptic Technology Market Revenue (US$ Mn) Forecast, by End-use Industry, 2017–2027
13.4.2.3.1. Consumer Electronics
13.4.2.3.2. Retail
13.4.2.3.3. Automotive
13.4.2.3.4. Others
13.5. South America Surface Haptic Technology Market Attractiveness Analysis
13.5.1. By Component
13.5.2. By End-use Industry
13.5.3. By Country/Sub-region
14. Competition Landscape
14.1. Market Players – Competition Matrix
14.2. Global Surface Haptic Technology Market Share Analysis, by Company (2018)
14.3. Company Profiles (Details – Overview, Financials, Recent Developments, SWOT, Strategy)
14.3.1. KYOCERA Corporation
14.3.1.1. Company Details
14.3.1.2. Market Presence, by Segment
14.3.1.3. Strategic Overview
14.3.1.4. Financial Details
14.3.1.5. SWOT Analysis
14.3.2. Dialog Semiconductor Plc.
14.3.2.1. Company Details
14.3.2.2. Market Presence, by Segment
14.3.2.3. Strategic Overview
14.3.2.4. Financial Details
14.3.2.5. SWOT Analysis
14.3.3. Texas Instruments Incorporated
14.3.3.1. Company Details
14.3.3.2. Market Presence, by Segment
14.3.3.3. Strategic Overview
14.3.3.4. Financial Details
14.3.3.5. SWOT Analysis
14.3.4. SENSEG OY
14.3.4.1. Company Details
14.3.4.2. Market Presence, by Segment
14.3.4.3. Strategic Overview
14.3.4.4. Financial Details
14.3.4.5. SWOT Analysis
14.3.5. Continental AG
14.3.5.1. Company Details
14.3.5.2. Market Presence, by Segment
14.3.5.3. Strategic Overview
14.3.5.4. Financial Details
14.3.5.5. SWOT Analysis
14.3.6. Quad Industries
14.3.6.1. Company Details
14.3.6.2. Market Presence, by Segment
14.3.6.3. Strategic Overview
14.3.6.4. Financial Details
14.3.6.5. SWOT Analysis
14.3.7. Immersion Corporation
14.3.7.1. Company Details
14.3.7.2. Market Presence, by Segment
14.3.7.3. Strategic Overview
14.3.7.4. Financial Details
14.3.7.5. SWOT Analysis
14.3.8. Tanvas
14.3.8.1. Company Details
14.3.8.2. Market Presence, by Segment
14.3.8.3. Strategic Overview
14.3.8.4. Financial Details
14.3.8.5. SWOT Analysis
14.3.9. Synaptics Incorporated
14.3.9.1. Company Details
14.3.9.2. Market Presence, by Segment
14.3.9.3. Strategic Overview
14.3.9.4. Financial Details
14.3.9.5. SWOT Analysis
14.3.10. Nidec Corporation
14.3.10.1. Company Details
14.3.10.2. Market Presence, by Segment
14.3.10.3. Strategic Overview
14.3.10.4. Financial Details
14.3.10.5. SWOT Analysis
14.3.11. Actronika
14.3.11.1. Company Details
14.3.11.2. Market Presence, by Segment
14.3.11.3. Strategic Overview
14.3.11.4. Financial Details
14.3.11.5. SWOT Analysis
14.3.12. Esterline Technologies Corporation
14.3.12.1. Company Details
14.3.12.2. Market Presence, by Segment
14.3.12.3. Strategic Overview
14.3.12.4. Financial Details
14.3.12.5. SWOT Analysis
14.3.13. TDK Corporation
14.3.13.1. Company Details
14.3.13.2. Market Presence, by Segment
14.3.13.3. Strategic Overview
14.3.13.4. Financial Details
14.3.13.5. SWOT Analysis
15. Key Takeaways
List of Tables
Table 01: Global Surface Haptic Technology Market Revenue (US$ Mn) Forecast, by Component, 2017–2027
Table 02: Global Surface Haptic Technology Market Revenue (US$ Mn) Forecast, by End-use Industry, 2017–2027
Table 03: Global Surface Haptic Technology Market Revenue (US$ Mn) Forecast, by Region, 2017–2027
Table 04: North America Surface Haptic Technology Market Revenue (US$ Mn) Forecast, by Component, 2017–2027
Table 05: North America Surface Haptic Technology Market Revenue (US$ Mn) Forecast, by End-use Industry, 2017–2027
Table 06: North America Surface Haptic Technology Market Revenue (US$ Mn) Forecast, by Country/Sub-region, 2017–2027
Table 07: U.S. Surface Haptic Technology Market Revenue (US$ Mn) Forecast, by Component, 2017–2027
Table 08: U.S. Surface Haptic Technology Market Revenue (US$ Mn) Forecast, by End-use Industry, 2017–2027
Table 09: Canada Surface Haptic Technology Market Revenue (US$ Mn) Forecast, by Component, 2017–2027
Table 10: Canada Surface Haptic Technology Market Revenue (US$ Mn) Forecast, by End-use Industry, 2017–2027
Table 11: Rest of North America nada Surface Haptic Technology Market Revenue (US$ Mn) Forecast, by Component, 2017–2027
Table 12: Rest of North America Surface Haptic Technology Market Revenue (US$ Mn) Forecast, by End-use Industry, 2017–2027
Table 13: Europe Surface Haptic Technology Market Revenue (US$ Mn) Forecast, by Component, 2017–2027
Table 14: Europe Surface Haptic Technology Market Revenue (US$ Mn) Forecast, by End-use Industry, 2017–2027
Table 15: Europe Surface Haptic Technology Market Revenue (US$ Mn) Forecast, by Country/Sub-region, 2017–2027
Table 16: Germany Surface Haptic Technology Market Revenue (US$ Mn) Forecast, by Component, 2017–2027
Table 17: Germany Surface Haptic Technology Market Revenue (US$ Mn) Forecast, by End-use Industry, 2017–2027
Table 18: France Surface Haptic Technology Market Revenue (US$ Mn) Forecast, by Component, 2017–2027
Table 19: France Surface Haptic Technology Market Revenue (US$ Mn) Forecast, by End-use Industry, 2017–2027
Table 20: U.K. Surface Haptic Technology Market Revenue (US$ Mn) Forecast, by Component, 2017–2027
Table 21: U.K. Surface Haptic Technology Market Revenue (US$ Mn) Forecast, by End-use Industry, 2017–2027
Table 22: Rest of Europe Surface Haptic Technology Market Revenue (US$ Mn) Forecast, by Component, 2017–2027
Table 23: Rest of Europe Surface Haptic Technology Market Revenue (US$ Mn) Forecast, by End-use Industry, 2017–2027
Table 24: Asia Pacific Surface Haptic Technology Market Revenue (US$ Mn) Forecast, by Component, 2017–2027
Table 25: Asia Pacific Surface Haptic Technology Market Revenue (US$ Mn) Forecast, by End-use Industry, 2017–2027
Table 26: Asia Pacific Surface Haptic Technology Market Revenue (US$ Mn) Forecast, by Country/Sub-region, 2017–2027
Table 27: China Surface Haptic Technology Market Revenue (US$ Mn) Forecast, by Component, 2017–2027
Table 28: China Surface Haptic Technology Market Revenue (US$ Mn) Forecast, by End-use Industry, 2017–2027
Table 29: Japan Surface Haptic Technology Market Revenue (US$ Mn) Forecast, by Component, 2017–2027
Table 30: Japan Surface Haptic Technology Market Revenue (US$ Mn) Forecast, by End-use Industry, 2017–2027
Table 31: India Surface Haptic Technology Market Revenue (US$ Mn) Forecast, by Component, 2017–2027
Table 32: India Surface Haptic Technology Market Revenue (US$ Mn) Forecast, by End-use Industry, 2017–2027
Table 33: Rest of Asia Pacific Surface Haptic Technology Market Revenue (US$ Mn) Forecast, by Component, 2017–2027
Table 34: Rest of Asia Pacific Surface Haptic Technology Market Revenue (US$ Mn) Forecast, by End-use Industry, 2017–2027
Table 35: Middle East & Africa Surface Haptic Technology Market Revenue (US$ Mn) Forecast, by Component, 2017–2027
Table 36: Middle East & Africa Surface Haptic Technology Market Revenue (US$ Mn) Forecast, by End-use Industry, 2017–2027
Table 37: Middle East & Africa Surface Haptic Technology Market Revenue (US$ Mn) Forecast, by Country/Sub-region, 2017–2027
Table 38: GCC Surface Haptic Technology Market Revenue (US$ Mn) Forecast, by Component, 2017–2027
Table 39: GCC Surface Haptic Technology Market Revenue (US$ Mn) Forecast, by End-use Industry, 2017–2027
Table 40: South Africa Surface Haptic Technology Market Revenue (US$ Mn) Forecast, by Component, 2017–2027
Table 41: South Africa Surface Haptic Technology Market Revenue (US$ Mn) Forecast, by End-use Industry, 2017–2027
Table 42: Rest of Middle East & Africa Surface Haptic Technology Market Revenue (US$ Mn) Forecast, by Component, 2017–2027
Table 43: Rest of Middle East & Africa Surface Haptic Technology Market Revenue (US$ Mn) Forecast, by End-use Industry, 2017–2027
Table 44: South America Surface Haptic Technology Market Revenue (US$ Mn) Forecast, by Component, 2017–2027
Table 45: South America Surface Haptic Technology Market Revenue (US$ Mn) Forecast, by End-use Industry, 2017–2027
Table 46: South America Surface Haptic Technology Market Revenue (US$ Mn) Forecast, by Country/Sub-region, 2017–2027
Table 47: Brazil Surface Haptic Technology Market Revenue (US$ Mn) Forecast, by Component, 2017–2027
Table 48: Brazil Surface Haptic Technology Market Revenue (US$ Mn) Forecast, by End-use Industry, 2017–2027
Table 49: Rest of South America Surface Haptic Technology Market Revenue (US$ Mn) Forecast, by Component, 2017–2027
Table 50: Rest of South America Surface Haptic Technology Market Revenue (US$ Mn) Forecast, by End-use Industry, 2017–2027
List of Figures
Figure 01: Global Surface Haptic Technology Market Revenue (US$ Mn) Forecast, 2017–2027
Figure 02: Global Surface Haptic Technology Market Y-o-Y Growth (Value %) Forecast, 2017–2027
Figure 03: Global Surface Haptic Technology Market Value Share Analysis, by Component (2019)
Figure 04: Global Surface Haptic Technology Market Value Share Analysis, by Component (2027)
Figure 05: Global Surface Haptic Technology Market Revenue (US$ Mn) Growth Analysis, by Component, 2019–2027
Figure 06: Global Surface Haptic Technology Market Attractiveness Analysis, by Component
Figure 07: Global Surface Haptic Technology Market Value Share Analysis, by End-use Industry (2019)
Figure 08: Global Surface Haptic Technology Market Value Share Analysis, by End-use Industry (2027)
Figure 09: Global Surface Haptic Technology Market Revenue (US$ Mn) Growth Analysis, by End-use Industry, 2019–2027
Figure 10: Global Surface Haptic Technology Market Attractiveness Analysis, by End-use Industry
Figure 11: Global Surface Haptic Technology Market Value Share Analysis, by Region (2019)
Figure 12: Global Surface Haptic Technology Market Value Share Analysis, by Region (2027)
Figure 13: Global Surface Haptic Technology Market Revenue (US$ Mn) Growth Analysis, by Region, 2019–2027
Figure 14: Global Surface Haptic Technology Market Attractiveness Analysis, by Region
Figure 15: North America Surface Haptic Technology Market Revenue (US$ Mn) Forecast, 2017–2027
Figure 16: North America Surface Haptic Technology Market Y-o-Y Growth (Value %) Forecast, 2017–2027
Figure 17: North America Surface Haptic Technology Market Value Share Analysis, by Component (2019)
Figure 18: North America Surface Haptic Technology Market Value Share Analysis, by Component (2027)
Figure 19: North America Surface Haptic Technology Market Value Share Analysis, by End-use Industry (2019)
Figure 20: North America Surface Haptic Technology Market Value Share Analysis, by End-use Industry (2027)
Figure 21: North America Surface Haptic Technology Market Value Share Analysis, by Country/Sub-region (2019)
Figure 22: North America Surface Haptic Technology Market Value Share Analysis, by Country/Sub-region (2027)
Figure 23: North America Surface Haptic Technology Market Revenue (US$ Mn) Growth Analysis, by Component, 2019–2027
Figure 24: North America Surface Haptic Technology Market Revenue (US$ Mn) Growth Analysis, by End-use Industry, 2019–2027
Figure 25: North America Surface Haptic Technology Market Revenue (US$ Mn) Growth Analysis, by Country/Sub-region, 2019–2027
Figure 26: U.S. Surface Haptic Technology Market Value Share Analysis, by Component (2019)
Figure 27: U.S. Surface Haptic Technology Market Value Share Analysis, by Component (2027)
Figure 28: U.S. Surface Haptic Technology Market Value Share Analysis, by End-use Industry (2019)
Figure 29: U.S. Surface Haptic Technology Market Value Share Analysis, by End-use Industry (2027)
Figure 30: Canada Surface Haptic Technology Market Value Share Analysis, by Component (2019)
Figure 31: Canada Surface Haptic Technology Market Value Share Analysis, by Component (2027)
Figure 32: Canada Surface Haptic Technology Market Value Share Analysis, by End-use Industry (2019)
Figure 33: Canada Surface Haptic Technology Market Value Share Analysis, by End-use Industry (2027)
Figure 34: North America Surface Haptic Technology Market Attractiveness Analysis, by Component
Figure 35: North America Surface Haptic Technology Market Attractiveness Analysis, by End-use Industry
Figure 36: North America Surface Haptic Technology Market Attractiveness Analysis, by Country/Sub-region
Figure 37: Europe Surface Haptic Technology Market Revenue (US$ Mn) Forecast, 2017–2027
Figure 38: Europe Surface Haptic Technology Market Y-o-Y Growth (Value %) Forecast, 2017–2027
Figure 39: Europe Surface Haptic Technology Market Value Share Analysis, by Component (2019)
Figure 40: Europe Surface Haptic Technology Market Value Share Analysis, by Component (2027)
Figure 41: Europe Surface Haptic Technology Market Value Share Analysis, by End-use Industry (2019)
Figure 42: Europe Surface Haptic Technology Market Value Share Analysis, by End-use Industry (2027)
Figure 43: Europe Surface Haptic Technology Market Value Share Analysis, by Country/Sub-region (2019)
Figure 44: Europe Surface Haptic Technology Market Value Share Analysis, by Country/Sub-region (2027)
Figure 45: Europe Surface Haptic Technology Market Revenue (US$ Mn) Growth Analysis, by Component, 2019–2027
Figure 46: Europe Surface Haptic Technology Market Revenue (US$ Mn) Growth Analysis, by End-use Industry, 2019–2027
Figure 47: Europe Surface Haptic Technology Market Revenue (US$ Mn) Growth Analysis, by Country/Sub-region, 2019-2027
Figure 48: Germany Surface Haptic Technology Market Value Share Analysis, by Component (2019)
Figure 49: Germany Surface Haptic Technology Market Value Share Analysis, by Component (2027)
Figure 50: Germany Surface Haptic Technology Market Value Share Analysis, by End-use Industry (2019)
Figure 51: Germany Surface Haptic Technology Market Value Share Analysis, by End-use Industry (2027)
Figure 52: France Surface Haptic Technology Market Value Share Analysis, by Component (2019)
Figure 53: France Surface Haptic Technology Market Value Share Analysis, by Component (2027)
Figure 54: France Surface Haptic Technology Market Value Share Analysis, by End-use Industry (2019)
Figure 55: France Surface Haptic Technology Market Value Share Analysis, by End-use Industry (2027)
Figure 56: U.K. Surface Haptic Technology Market Value Share Analysis, by Component (2019)
Figure 57: U.K. Surface Haptic Technology Market Value Share Analysis, by Component (2027)
Figure 58: U.K. Surface Haptic Technology Market Value Share Analysis, by End-use Industry (2019)
Figure 59: U.K. Surface Haptic Technology Market Value Share Analysis, by End-use Industry (2027)
Figure 60: Europe Surface Haptic Technology Market Attractiveness Analysis, by Component
Figure 61: Europe Surface Haptic Technology Market Attractiveness Analysis, by End-use Industry
Figure 62: Europe Surface Haptic Technology Market Attractiveness Analysis, by Country/Sub-region
Figure 63: Asia Pacific Surface Haptic Technology Market Revenue (US$ Mn) Forecast, 2017–2027
Figure 64: Asia Pacific Surface Haptic Technology Market Y-o-Y Growth (Value %) Forecast, 2017–2027
Figure 65: Asia Pacific Surface Haptic Technology Market Value Share Analysis, by Component (2019)
Figure 66: Asia Pacific Surface Haptic Technology Market Value Share Analysis, by Component (2027)
Figure 67: Asia Pacific Surface Haptic Technology Market Value Share Analysis, by End-use Industry (2019)
Figure 68: Asia Pacific Surface Haptic Technology Market Value Share Analysis, by End-use Industry (2027)
Figure 69: Asia Pacific Surface Haptic Technology Market Value Share Analysis, by Country/Sub-region (2019)
Figure 70: Asia Pacific Surface Haptic Technology Market Value Share Analysis, by Country/Sub-region (2027)
Figure 71: Asia Pacific Surface Haptic Technology Market Revenue (US$ Mn) Growth Analysis, by Component, 2019–2027
Figure 72: Asia Pacific Surface Haptic Technology Market Revenue (US$ Mn) Growth Analysis, by End-use Industry, 2019–2027
Figure 73: Asia Pacific Surface Haptic Technology Market Revenue (US$ Mn) Growth Analysis, by Country/Sub-region, 2019–2027
Figure 74: China Surface Haptic Technology Market Value Share Analysis, by Component (2019)
Figure 75: China Surface Haptic Technology Market Value Share Analysis, by Component (2027)
Figure 76: China Surface Haptic Technology Market Value Share Analysis, by End-use Industry (2019)
Figure 77: China Surface Haptic Technology Market Value Share Analysis, by End-use Industry (2027)
Figure 78: Japan Surface Haptic Technology Market Value Share Analysis, by Component (2019)
Figure 79: Japan Surface Haptic Technology Market Value Share Analysis, by Component (2027)
Figure 80: Japan Surface Haptic Technology Market Value Share Analysis, by End-use Industry (2019)
Figure 81: Japan Surface Haptic Technology Market Value Share Analysis, by End-use Industry (2027)
Figure 82: India Surface Haptic Technology Market Value Share Analysis, by Component (2019)
Figure 83: India Surface Haptic Technology Market Value Share Analysis, by Component (2027)
Figure 84: India Surface Haptic Technology Market Value Share Analysis, by End-use Industry (2019)
Figure 85: India Surface Haptic Technology Market Value Share Analysis, by End-use Industry (2027)
Figure 86: Asia Pacific Surface Haptic Technology Market Attractiveness Analysis, by Component
Figure 87: Asia Pacific Surface Haptic Technology Market Attractiveness Analysis, by End-use Industry
Figure 88: Asia Pacific Surface Haptic Technology Market Attractiveness Analysis, by Country/Sub-region
Figure 89: Middle East & Africa Surface Haptic Technology Market Revenue (US$ Mn) Forecast, 2017–2027
Figure 90: Middle East & Africa Surface Haptic Technology Market Y-o-Y Growth (Value %) Forecast, 2017–2027
Figure 91: Middle East & Africa Surface Haptic Technology Market Value Share Analysis, by Component (2019)
Figure 92: Middle East & Africa Surface Haptic Technology Market Value Share Analysis, by Component (2027)
Figure 93: Middle East & Africa Surface Haptic Technology Market Value Share Analysis, by End-use Industry (2019)
Figure 94: Middle East & Africa Surface Haptic Technology Market Value Share Analysis, by End-use Industry (2027)
Figure 95: Middle East & Africa Surface Haptic Technology Market Value Share Analysis, by Country/Sub-region (2019)
Figure 96: Middle East & Africa Surface Haptic Technology Market Value Share Analysis, by Country/Sub-region (2027)
Figure 97: Middle East & Africa Surface Haptic Technology Market Revenue (US$ Mn) Growth Analysis, by Component, 2019–2027
Figure 98: Middle East & Africa Surface Haptic Technology Market Revenue (US$ Mn) Growth Analysis, by End-use Industry, 2019–2027
Figure 99: Middle East & Africa Surface Haptic Technology Market Revenue (US$ Mn) Growth Analysis, by Country/Sub-region, 2019–2027
Figure 100: GCC Surface Haptic Technology Market Value Share Analysis, by Component (2019)
Figure 101: GCC Surface Haptic Technology Market Value Share Analysis, by Component (2027)
Figure 102: GCC Surface Haptic Technology Market Value Share Analysis, by End-use Industry (2019)
Figure 103: GCC Surface Haptic Technology Market Value Share Analysis, by End-use Industry (2027)
Figure 104: South Africa Surface Haptic Technology Market Value Share Analysis, by Component (2019)
Figure 105: South Africa Surface Haptic Technology Market Value Share Analysis, by Component (2027)
Figure 106: South Africa Surface Haptic Technology Market Value Share Analysis, by End-use Industry (2019)
Figure 107: South Africa Surface Haptic Technology Market Value Share Analysis, by End-use Industry (2027)
Figure 108: Middle East & Africa Surface Haptic Technology Market Attractiveness Analysis, by Component
Figure 109: Middle East & Africa Surface Haptic Technology Market Attractiveness Analysis, by End-use Industry
Figure 110: Middle East & Africa Surface Haptic Technology Market Attractiveness Analysis, by Country/Sub-region
Figure 111: South America Surface Haptic Technology Market Revenue (US$ Mn) Forecast, 2017–2027
Figure 112: South America Surface Haptic Technology Market Y-o-Y Growth (Value %) Forecast, 2017–2027
Figure 113: South America Surface Haptic Technology Market Value Share Analysis, by Component (2019)
Figure 114: South America Surface Haptic Technology Market Value Share Analysis, by Component (2027)
Figure 115: South America Surface Haptic Technology Market Value Share Analysis, by End-use Industry (2019)
Figure 116: South America Surface Haptic Technology Market Value Share Analysis, by End-use Industry (2027)
Figure 117: South America Surface Haptic Technology Market Value Share Analysis, by Country/Sub-region (2019)
Figure 118: South America Surface Haptic Technology Market Value Share Analysis, by Country/Sub-region (2027)
Figure 119: South America Surface Haptic Technology Market Revenue (US$ Mn) Growth Analysis, by Component, 2019–2027
Figure 120: South America Surface Haptic Technology Market Revenue (US$ Mn) Growth Analysis, by End-use Industry, 2019–2027
Figure 121: South America Surface Haptic Technology Market Revenue (US$ Mn) Growth Analysis, by Country/Sub-region, 2019–2027
Figure 122: Brazil Surface Haptic Technology Market Value Share Analysis, by Component (2019)
Figure 123: Brazil any Surface Haptic Technology Market Value Share Analysis, by Component (2027)
Figure 124: Brazil Surface Haptic Technology Market Value Share Analysis, by End-use Industry (2019)
Figure 125: Brazil Surface Haptic Technology Market Value Share Analysis, by End-use Industry (2027)
Figure 126: South America Surface Haptic Technology Market Attractiveness Analysis, by Component
Figure 127: South America Surface Haptic Technology Market Attractiveness Analysis, by End-use Industry
Figure 128: South America Surface Haptic Technology Market Attractiveness Analysis, by Country/Sub-region
Figure 129: Global Surface Haptic Technology Market Share Analysis, by Company (2018)
Copyright © Transparency Market Research, Inc. All Rights reserved
Trust Online

Surface Haptic Technology Market