
Reports
Reports
Gram-positive Bacterial Infections Market: Snapshot
The global gram-positive bacterial infections market is expected to demonstrate upward curve of growth during the forecast period of 2018 to 2026. Some of the key reasons for this growth are significant growth in patients living with gram-positive bacterial infections and a swift increase in antibacterial resistance. Gram-positive bacterial infection drugs are effective option in the treatment of various infections including sinusitis, MRSA infections, and pneumonia.
Gram-positive bacteria are considered as a key class of bacteria responsible for causing numerous infections in humans. They are known for retaining gram stain. Under microscope, they are observed as violet purple colored stains. Gram-positive bacterial infection drugs use diverse mechanisms including protein biosynthesis inhibition, cell wall synthesis inhibition, and DNA replication inhibition.
Vendors working in the global gram-positive bacterial infections market are heavily investing in research activities. This move is helping them to offer superior quality drugs. As a result, the market for gram-positive bacterial infections is witnessing stupendous expansion avenues in the upcoming period. Apart from this, government bodies of many countries across the world are taking initiatives to support in finding out advanced bacterial infection treatment. For this purpose, they are backing various research and development activities. This is working as a driver for the global gram-positive bacterial infections market.
Several enterprises from the global gram-positive bacterial infections market are executing various strategies such as collaborations and partnerships. Key motive behind these moves is regional expansion. In addition to this, increased number of mergers and acquisitions connotes that the global gram-positive bacterial infections market will grow at rapid pace during upcoming years.
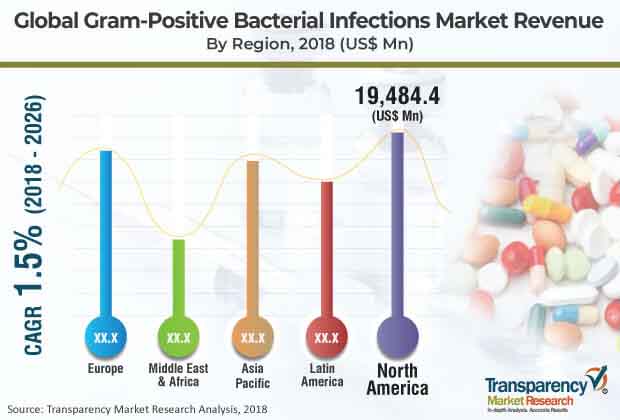
The gram-positive bacterial infections market is expected to experience significant growth avenues in North America. Remarkable increase in the number of people living with bacterial infections, presence of key players, and improved diagnosis and treatment rate are some of the key reasons fueling the market growth in the region.
Gram-positive bacterial infection drugs act against gram-positive bacterial infections such as MRSA infections, sinusitis, and pneumonia. Gram-positive bacteria are those class of bacteria that retain gram stain and hence, are observed as violet purple colored stains when observed under the microscope. They are a major class of bacteria that cause various infections in humans. These drugs act by various mechanisms such as inhibition of cell wall synthesis, inhibition of protein biosynthesis, and inhibition of DNA replication. The global gram-positive bacterial infections market was valued at around US $ 51,450 Mn in 2017. It is expected to expand at a CAGR of 1.5% from 2018 to 2026. The market for gram-positive bacterial infections is expanding significantly, owing to an increase in the number of cases of gram-positive bacterial infections and a rapid rise in antibacterial resistance. Increased government initiatives and funding for R&D activities & newer bacterial infection treatment and infection control in healthcare settings is also a key factors driving the market globally.
The gram-positive bacterial infections market has been segmented based on drug type, disease, route of administration, distribution channel, and region. Based on drug type, the global market is classified into antibiotic, antifungal, and others. The antibiotic segment has been further sub-segmented into B-lactam, quinolones, macrolides, tetracyclines, aminoglycosides, sulfonamides, phenicols, and others. The antibiotic segment dominated the global market and is expected to maintain its position during the forecast period owing to better efficacy in treatment of wide spectrum of bacterial infections and development of novel approaches for new antibiotics. The others segment, which includes antitoxins, corticosteroids, supplements, anti-dialectic, calcium, probiotics, is expected to expand at a higher CAGR during the forecast period owing to the popularity of combination drugs prescribed for patients who are more prone to the adverse effects of single antibiotic prescription. Based on disease, the global gram-positive bacterial infections market has been divided into MRSA, pneumonia, sepsis, sinusitis, cellulitis, otitis, pharyngitis, impetigo, and others. The sinusitis segment is dominant owing to the rise in prevalence of sinusitis and increased usage of antibiotics for this infection. The otitis segment is projected to expand at a higher CAGR during the forecast period due to a rise in the prevalence of otitis media and the efficacy and safety of antibacterial agents to cure the infection. In terms of route of administration, the global gram-positive bacterial infections market has been classified into enteral, parenteral and others. The enteral segment dominated the market global market. Patient preference, ease of administration and ability to achieve desired therapeutic concentration are some factors driving the enteral segment. Based on distribution channel, the global gram-positive bacterial infections market has been segregated into hospital pharmacies, drug stores and retail pharmacies, and others. The others segment, which consist of online pharmacies and mail pharmacies, is projected to expand at a notably higher CAGR. This expanded CAGR is attributed to better discounted rates on drug purchase and convenience offered by online pharmacies.
In terms of region, the global gram-positive bacterial infections market has been divided into North America, Europe, Asia Pacific, Latin America, and Middle East & Africa. North America dominated the global gram-positive bacterial infections market in 2017, owing to a rise in the prevalence of bacterial infections, better diagnosis and treatment rate, and presence of major players in the region. Asia Pacific is a lucrative market for gram-positive bacterial infections, and the market is estimated to expand at a prominent CAGR during the forecast period due to larger patient pool and rising number of infected cases in the region.
Key players operating in the global Gram-Positive Bacterial Infections market include Bayer AG, Pfizer, Inc., Sanofi, GlaxoSmithkline plc (GSK), Merck & Co., Inc., AstraZeneca, Theravance Biopharma, Bristol-Myers Squibb Company, Novartis AG, and Allergan plc.
Newer Options for Infection Control Propels Growth in Gram-Positive Bacterial Infections Market
Manufacturers and researchers in the global gram-positive bacterial infections market are looking forward to developing newer treatment and infection control solutions. Increasing number of research studies, clinical trials, and drug discovery processes are being undertaken by industry players to meet the rising demand for cost effective and fast acting antibiotic and antibacterial drug formulations. For example, a company called ‘Basilea Pharmaceutica’ announced the positive results for the phase 3 target study of their antibiotic drug product called ‘Ceftobiprole’. This drug is designed to treat acute bacterial skin disorders and skin structure infections. Furthermore, Bayer Global launched an antibiotic natural dipeptide known as ‘TAN 1057 AB’ that shows promising antibacterial activity against the staphylococci, including staphylococcus aureus that resists methicillin.
Increased government participation in supporting the ongoing research and development activities is anticipated to act favorably for the growing gram-positive bacterial infections market. Furthermore, factors such as increasing awareness among global population regarding the severe effects of infectious diseases and rapidly increasing technological strides in antibacterial resistance are supplementing the increased demand in global gram-positive bacterial infections market. However, there are some concerning factors that can impede the market growth in coming years. These factors include high cost of treatment, ignorance and lack of awareness regarding the proper identification of symptoms, and stringent government regulations. These factors, along with high cost associated with research and development processes for designing and developing newer drug therapies can hinder the growth of global gram-positive bacterial infections market in near future. Like every other industry, the global gram-positive bacterial infections market was also deeply impacted by the global COVID-19 pandemic. As of yet, there is no drug or therapeutic product in the market that can assist in killing the COVID-19 virus. However, many research firms and pharmaceutical manufacturers are increasingly investing in initiative to develop products that can effectively eliminate novel coronavirus.
1. Preface
1.1. Market Definition and Scope
1.2. Market Segmentation
1.3. Key Research Objectives
1.4. Research Highlights
2. Assumptions and Research Methodology
3. Executive Summary : Global Gram-positive Bacterial Infections Market
4. Market Overview
4.1. Introduction
4.1.1. Drug Type Definition
4.1.2. Global Gram-positive Bacterial Infections Market Taxonomy
4.2. Overview
4.3. Market Dynamics
4.3.1. Drivers
4.3.2. Restraints
4.3.3. Opportunities
4.4. Global Gram-positive Bacterial Infections Market Analysis and Forecast, 2016–2026
4.4.1. Market Revenue Projections (US$ Mn)
4.5. Porter’s Five Force Analysis
5. Market Outlook
5.1. Patent Landscape
5.2. Key Success Factors of Top Players
5.3. Branded vs. Generic Drugs Overview
6. Global Gram-positive Bacterial Infections Market Analysis and Forecast, by Drug Type
6.1. Introduction & Definition
6.2. Key Findings / Developments
6.3. Global Gram-positive Bacterial Infections Market Value Forecast, by Drug Type, 2016–2026
6.3.1. Antibiotic
6.3.1.1. B-Lactam
6.3.1.2. Quinolones
6.3.1.3. Macrolides
6.3.1.4. Tetracyclines
6.3.1.5. Aminoglycosides
6.3.1.6. Sulfonamides
6.3.1.7. Phenicols
6.3.1.8. Others
6.3.2. Antifungal
6.3.3. Others
6.4. Global Gram-positive Bacterial Infections Market Attractiveness, by Drug Type
7. Global Gram-positive Bacterial Infections Market Analysis and Forecast, by Disease
7.1. Introduction & Definition
7.2. Key Findings / Developments
7.3. Global Gram-positive Bacterial Infections Market Value Forecast, by Disease, 2016–2026
7.3.1. MRSA
7.3.2. Pneumonia
7.3.3. Sepsis
7.3.4. Sinusitis
7.3.5. Cellulitis
7.3.6. Otitis
7.3.7. Pharyngitis
7.3.8. Impetigo
7.3.9. Others
7.4. Global Gram-positive Bacterial Infections Market Attractiveness, by Drug Type
8. Global Gram-positive Bacterial Infections Market Analysis and Forecast, by Route of Administration
8.1. Introduction & Definition
8.2. Key Findings / Developments
8.3. Global Gram-positive Bacterial Infections Market Value Forecast, by Route of Administration, 2016–2026
8.3.1. Enteral
8.3.2. Parenteral
8.3.3. Others
8.4. Global Gram-positive Bacterial Infections Market Attractiveness, by Route of Administration
9. Global Gram-positive Bacterial Infections Market Analysis and Forecast, by Distribution Channel
9.1. Introduction & Definition
9.2. Key Findings / Developments
9.3. Global Gram-positive Bacterial Infections Market Value Forecast, by Distribution Channel, 2016–2026
9.3.1. Hospital Pharmacies
9.3.2. Drug Stores and Retail Pharmacies
9.3.3. Others
9.4. Global Gram-positive Bacterial Infections Market Attractiveness, by Distribution Channel
10. Global Gram-positive Bacterial Infections Market Analysis and Forecast, by Region
10.1. Key Findings
10.2. Global Gram-positive Bacterial Infections Market Value Forecast, by Region
10.2.1. North America
10.2.2. Europe
10.2.3. Asia Pacific
10.2.4. Latin America
10.2.5. Middle East & Africa
10.3. Global Gram-positive Bacterial Infections Market Attractiveness, by Region
11. North America Gram-positive Bacterial Infections Market Analysis and Forecast
11.1. Introduction
11.1.1. Key Findings
11.2. North America Gram-positive Bacterial Infections Market Value Forecast, by Drug Type, 2016–2026
11.2.1. Antibiotic
11.2.1.1. B-Lactam
11.2.1.2. Quinolones
11.2.1.3. Macrolides
11.2.1.4. Tetracyclines
11.2.1.5. Aminoglycosides
11.2.1.6. Sulfonamides
11.2.1.7. Phenicols
11.2.1.8. Others
11.2.2. Antifungal
11.2.3. Others
11.3. North America Gram-positive Bacterial Infections Market Value Forecast, by Disease, 2016–2026
11.3.1. MRSA
11.3.2. Pneumonia
11.3.3. Sepsis
11.3.4. Sinusitis
11.3.5. Cellulitis
11.3.6. Otitis
11.3.7. Pharyngitis
11.3.8. Impetigo
11.3.9. Others
11.4. North America Gram-positive Bacterial Infections Market Value Forecast, by Route of Administration, 2016–2026
11.4.1. Enteral
11.4.2. Parenteral
11.4.3. Others
11.5. North America Gram-positive Bacterial Infections Market Value Forecast, by Distribution Channel, 2016–2026
11.5.1. Hospital Pharmacies
11.5.2. Drug Stores and Retail Pharmacies
11.5.3. Others
11.6. North America Gram-positive Bacterial Infections Market Value Forecast, by Country, 2016–2026
11.6.1. U.S.
11.6.2. Canada
11.7. North America Gram-positive Bacterial Infections Market Attractiveness Analysis
11.7.1. By Drug Type
11.7.2. By Disease
11.7.3. By Route of Administration
11.7.4. By Distribution Channel
11.7.5. By Country
12. Europe Gram-positive Bacterial Infections Market Analysis and Forecast
12.1. Introduction
12.1.1. Key Findings
12.2. Europe Gram-positive Bacterial Infections Market Value Forecast, by Drug Type, 2016–2026
12.2.1. Antibiotic
12.2.1.1. B-Lactam
12.2.1.2. Quinolones
12.2.1.3. Macrolides
12.2.1.4. Tetracyclines
12.2.1.5. Aminoglycosides
12.2.1.6. Sulfonamides
12.2.1.7. Phenicols
12.2.1.8. Others
12.2.2. Antifungal
12.2.3. Others
12.3. Europe Gram-positive Bacterial Infections Market Value Forecast, by Disease, 2016–2026
12.3.1. MRSA
12.3.2. Pneumonia
12.3.3. Sepsis
12.3.4. Sinusitis
12.3.5. Cellulitis
12.3.6. Otitis
12.3.7. Pharyngitis
12.3.8. Impetigo
12.3.9. Others
12.4. Europe Gram-positive Bacterial Infections Market Value Forecast, by Route of Administration, 2016–2026
12.4.1. Enteral
12.4.2. Parenteral
12.4.3. Others
12.5. Europe Gram-positive Bacterial Infections Market Value Forecast, by Distribution Channel, 2016–2026
12.5.1. Hospital Pharmacies
12.5.2. Drug Stores and Retail Pharmacies
12.5.3. Others
12.6. Europe Gram-positive Bacterial Infections Market Value Forecast, by Country/Sub-region, 2016–2026
12.6.1. Germany
12.6.2. U.K.
12.6.3. France
12.6.4. Italy
12.6.5. Spain
12.6.6. Rest of Europe
12.7. Europe Gram-positive Bacterial Infections Market Attractiveness Analysis
12.7.1. By Drug Type
12.7.2. By Disease
12.7.3. By Route of Administration
12.7.4. By Distribution Channel
12.7.5. By Country/Sub-region
13. Asia Pacific Gram-positive Bacterial Infections Market Analysis and Forecast
13.1. Introduction
13.1.1. Key Findings
13.2. Asia Pacific Gram-positive Bacterial Infections Market Value Forecast, by Drug Type, 2016–2026
13.2.1. Antibiotic
13.2.1.1. B-Lactam
13.2.1.2. Quinolones
13.2.1.3. Macrolides
13.2.1.4. Tetracyclines
13.2.1.5. Aminoglycosides
13.2.1.6. Sulfonamides
13.2.1.7. Phenicols
13.2.1.8. Others
13.2.2. Antifungal
13.2.3. Others
13.3. Asia Pacific Gram-positive Bacterial Infections Market Value Forecast, by Disease, 2016–2026
13.3.1. MRSA
13.3.2. Pneumonia
13.3.3. Sepsis
13.3.4. Sinusitis
13.3.5. Cellulitis
13.3.6. Otitis
13.3.7. Pharyngitis
13.3.8. Impetigo
13.3.9. Others
13.4. Asia Pacific Gram-positive Bacterial Infections Market Value Forecast, by Route of Administration, 2016–2026
13.4.1. Enteral
13.4.2. Parenteral
13.4.3. Others
13.5. Asia Pacific Gram-positive Bacterial Infections Market Value Forecast, by Distribution Channel, 2016–2026
13.5.1. Hospital Pharmacies
13.5.2. Drug Stores and Retail Pharmacies
13.5.3. Others
13.6. Asia Pacific Gram-positive Bacterial Infections Market Value Forecast, by Country/Sub-region, 2016–2026
13.6.1. China
13.6.2. India
13.6.3. Japan
13.6.4. Australia & New Zealand
13.6.5. Rest of APAC
13.7. Asia Pacific Gram-positive Bacterial Infections Market Attractiveness Analysis
13.7.1. By Drug Type
13.7.2. By Disease
13.7.3. By Route of Administration
13.7.4. By Distribution Channel
13.7.5. By Country/Sub-region
14. Latin America Gram-positive Bacterial Infections Market Analysis and Forecast
14.1. Introduction
14.1.1. Key Findings
14.2. Latin America Gram-positive Bacterial Infections Market Value Forecast, by Drug Type,2016–2026
14.2.1. Antibiotic
14.2.1.1. B-Lactam
14.2.1.2. Quinolones
14.2.1.3. Macrolides
14.2.1.4. Tetracyclines
14.2.1.5. Aminoglycosides
14.2.1.6. Sulfonamides
14.2.1.7. Phenicols
14.2.1.8. Others
14.2.2. Antifungal
14.2.3. Others
14.3. Latin America Gram-positive Bacterial Infections Market Value Forecast, by Disease, 2016–2026
14.3.1. MRSA
14.3.2. Pneumonia
14.3.3. Sepsis
14.3.4. Sinusitis
14.3.5. Cellulitis
14.3.6. Otitis
14.3.7. Pharyngitis
14.3.8. Impetigo
14.3.9. Others
14.4. Latin America Gram-positive Bacterial Infections Market Value Forecast, by Route of Administration, 2016–2026
14.4.1. Enteral
14.4.2. Parenteral
14.4.3. Others
14.5. Latin America Gram-positive Bacterial Infections Market Value Forecast, by Distribution Channel, 2016–2026
14.5.1. Hospital Pharmacies
14.5.2. Drug Stores and Retail Pharmacies
14.5.3. Others
14.6. Latin America Gram-positive Bacterial Infections Market Value Forecast, by Country/Sub-region, 2016–2026
14.6.1. Brazil
14.6.2.Mexico
14.6.3. Rest of LATAM
14.7. Latin America Gram-positive Bacterial Infections Market Attractiveness Analysis
14.7.1. By Drug Type
14.7.2. By Disease
14.7.3. By Route of Administration
14.7.4. By Distribution Channel
14.7.5. By Country/Sub-region
15. Middle East & Africa Gram-positive Bacterial Infections Market Analysis and Forecast
15.1. Introduction
15.1.1. Key Findings
15.2. Middle East & Africa Gram-positive Bacterial Infections Market Value Forecast, by Drug Type, 2016–2026
15.2.1. Antibiotic
15.2.1.1. B-Lactam
15.2.1.2. Quinolones
15.2.1.3. Macrolides
15.2.1.4. Tetracyclines
15.2.1.5. Aminoglycosides
15.2.1.6. Sulfonamides
15.2.1.7. Phenicols
15.2.1.8. Others
15.2.2. Antifungal
15.2.3. Others
15.3. Middle East & Africa Gram-positive Bacterial Infections Market Value Forecast, by Disease, 2016–2026
15.3.1. MRSA
15.3.2. Pneumonia
15.3.3. Sepsis
15.3.4. Sinusitis
15.3.5. Cellulitis
15.3.6. Otitis
15.3.7. Pharyngitis
15.3.8. Impetigo
15.3.9. Others
15.4. Middle East & Africa Gram-positive Bacterial Infections Market Value Forecast, by Route of Administration, 2016–2026
15.4.1. Enteral
15.4.2. Parenteral
15.4.3. Others
15.5. Middle East & Africa Gram-positive Bacterial Infections Market Value Forecast, by Distribution Channel, 2016–2026
15.5.1. Hospital Pharmacies
15.5.2. Drug Stores and Retail Pharmacies
15.5.3. Others
15.6. Middle East & Africa Gram-positive Bacterial Infections Market Value Forecast, by Country/Sub-region, 2016–2026
15.6.1. GCC Countries
15.6.2.South Africa
15.6.3. Rest of Middle East & Africa
15.7. Market Attractiveness Analysis
15.7.1. By Drug Type
15.7.2. By Disease
15.7.3. By Route of Administration
15.7.4. By Distribution Channel
15.7.5. By Country/Sub-region
16. Competition Landscape
16.1. Market Player-Competition Matrix(By Tier and Size of companies)
16.2. Market Share Analysis By Tier and Size of the Company(2017)
16.3. Company Profiles
16.3.1. Bayer AG
16.3.2. Pfizer, Inc.
16.3.3. Sanofi
16.3.4. GlaxoSmithKline plc
16.3.5. Merck & Co., Inc.
16.3.6. AstraZeneca
16.3.7. Theravance Biopharma
16.3.8. Bristol-Myers Squibb Company
16.3.9. Novartis AG
16.3.10. Allergan plc.
List of Tables
Table 01: Recent Patents, Gram-Positive Bacterial Infection Drugs
Table 02: Branded Drug Patents and Generic Drugs Overview
Table 03: Global Gram-positive Bacterial Infections Market Value (US$ Mn) Forecast, by Drug Type, 2016–2026
Table 04: Global Gram-positive Bacterial Infections Market Value (US$ Mn) Forecast, by Antibiotic, 2016–2026
Table 05: Global Gram-positive Bacterial Infections Market Value (US$ Mn) Forecast, by Disease, 2016–2026
Table 06: Global Gram-positive Bacterial Infections Market Value (US$ Mn) Forecast, by Route of Administration, 2016–2026
Table 07: Global Gram-positive Bacterial Infections Market Value (US$ Mn) Forecast, by Distribution Channel, 2016–2026
Table 08: Global Gram-positive Bacterial Infections Market Value (US$ Mn) Forecast, by Region, 2016–2026
Table 09: North America Gram-positive Bacterial Infections Market Value (US$ Mn) Forecast, by Country, 2016–2026
Table 10: North America Gram-positive Bacterial Infections Market Value (US$ Mn) Forecast, by Drug Type, 2016–2026
Table 11: North America Gram-positive Bacterial Infections Market Value (US$ Mn) Forecast, by Antibiotic, 2016–2026
Table 12: North America Gram-positive Bacterial Infections Market Value (US$ Mn) Forecast, by Disease, 2016–2026
Table 13: North America Gram-positive Bacterial Infections Market Value (US$ Mn) Forecast, by Route of Administration, 2016–2026
Table 14: North America Gram-positive Bacterial Infections Market Value (US$ Mn) Forecast, by Distribution Channel, 2016–2026
Table 15: Europe Gram-positive Bacterial Infections Market Value (US$ Mn) Forecast, by Country/Sub-region, 2016–2026
Table 16: Europe Gram-positive Bacterial Infections Market Value (US$ Mn) Forecast, by Drug Type, 2016–2026
Table 17: Europe Gram-positive Bacterial Infections Market Value (US$ Mn) Forecast, by Antibiotic, 2016–2026
Table 18: Europe Gram-positive Bacterial Infections Market Value (US$ Mn) Forecast, by Disease, 2016–2026
Table 19: Europe Gram-positive Bacterial Infections Market Value (US$ Mn) Forecast, by Route of Administration, 2016–2026
Table 20: Europe Gram-positive Bacterial Infections Market Value (US$ Mn) Forecast, by Distribution Channel, 2016–2026
Table 21: Asia Pacific Gram-positive Bacterial Infections Market Value (US$ Mn) Forecast, by Country/Sub-region, 2016–2026
Table 22: Asia Pacific Gram-positive Bacterial Infections Market Value (US$ Mn) Forecast, by Drug Type, 2016–2026
Table 23: Asia Pacific Gram-positive Bacterial Infections Market Value (US$ Mn) Forecast, by Antibiotic, 2016–2026
Table 24: Asia Pacific Gram-positive Bacterial Infections Market Value (US$ Mn) Forecast, by Disease, 2016–2026
Table 25: Asia Pacific Gram-positive Bacterial Infections Market Value (US$ Mn) Forecast, by Route of Administration, 2016–2026
Table 26: Asia Pacific Gram-positive Bacterial Infections Market Value (US$ Mn) Forecast, by Distribution Channel, 2016–2026
Table 27: Latin America Gram-positive Bacterial Infections Market Value (US$ Mn) Forecast, by Country/Sub-region, 2016–2026
Table 28: Latin America Gram-positive Bacterial Infections Market Value (US$ Mn) Forecast, by Drug Type, 2016–2026
Table 29: Latin America Gram-positive Bacterial Infections Market Value (US$ Mn) Forecast, by Antibiotic, 2016–2026
Table 30: Latin America Gram-positive Bacterial Infections Market Value (US$ Mn) Forecast, by Disease, 2016–2026
Table 31: Latin America Gram-positive Bacterial Infections Market Value (US$ Mn) Forecast, by Route of Administration, 2016–2026
Table 32: Latin America Gram-positive Bacterial Infections Market Value (US$ Mn) Forecast, by Distribution Channel, 2016–2026
Table 33: Middle East & Africa Gram-positive Bacterial Infections Market Value (US$ Mn) Forecast, by Country/Sub-region, 2016–2026
Table 34: Middle East & Africa Gram-positive Bacterial Infections Market Value (US$ Mn) Forecast, by Drug Type, 2016–2026
Table 35: Middle East & Africa Gram-positive Bacterial Infections Market Value (US$ Mn) Forecast, by Antibiotic, 2016–2026
Table 36: Middle East & Africa Gram-positive Bacterial Infections Market Value (US$ Mn) Forecast, by Disease, 2016–2026
Table 37: Middle East & Africa Gram-positive Bacterial Infections Market Value (US$ Mn) Forecast, by Route of Administration, 2016–2026
Table 38: Middle East & Africa Gram-positive Bacterial Infections Market Value (US$ Mn) Forecast, by Distribution Channel, 2016–2026
List of Figures
Figure 01: Global Gram-positive Bacterial Infections Market Value (US$ Mn) and Distribution, by Region, 2017 and 2026
Figure 02: Revenue Share, by Drug Type
Figure 03: Global Gram-positive Bacterial Infections Market Value (US$ Mn) Forecast, 2016–2026
Figure 04: Global Gram-positive Bacterial Infections Market Value Share, by Drug Type (2017)
Figure 05: Global Gram-positive Bacterial Infections Market Value Share, by Disease (2017)
Figure 06: Global Gram-positive Bacterial Infections Market Value Share, by Route of Administration (2017)
Figure 07: Global Gram-positive Bacterial Infections Market Value Share, by Distribution Channel (2017)
Figure 08: Global Gram-positive Bacterial Infections Market Value Share, by Region (2017)
Figure 09: Number of Patent Applications, 2010-2018 (Based on Priority Year)
Figure 10: Patent Application, by Priority Country (2010-2018)
Figure 11: Contributions (%), from Key Applications- 2010 to 2018
Figure 12: Global Gram-positive Bacterial Infections Market Value Share Analysis, by Drug Type, 2017 and 2026
Figure 13: Global Gram-positive Bacterial Infections Market Value (US$ Mn) and Y-o-Y Growth (%), by Antibiotic, 2016?2026
Figure 14: Global Gram-positive Bacterial Infections Market Value (US$ Mn) and Y-o-Y Growth (%), by Antifungal, 2016?2026
Figure 15: Global Gram-positive Bacterial Infections Market Value (US$ Mn) and Y-o-Y Growth (%), by Others, 2016?2026
Figure 16: Global Gram-positive Bacterial Infections Market Attractiveness Analysis, by Drug Type
Figure 17: Global Gram-positive Bacterial Infections Market Value Share Analysis, by Disease, 2017 and 2026
Figure 18: Global Gram-positive Bacterial Infections Market Value (US$ Mn) and Y-o-Y Growth (%), by MRSA, 2016–2026
Figure 19: Global Gram-positive Bacterial Infections Market Value (US$ Mn) and Y-o-Y Growth (%), by Pneumonia, 2016–2026
Figure 20: Global Gram-positive Bacterial Infections Market Value (US$ Mn) and Y-o-Y Growth (%), by Sepsis, 2016–2026
Figure 21: Global Gram-positive Bacterial Infections Market Value (US$ Mn) and Y-o-Y Growth (%), by Sinusitis, 2016–2026
Figure 22: Global Gram-positive Bacterial Infections Market Value (US$ Mn) and Y-o-Y Growth (%), by Cellulitis, 2016–2026
Figure 23: Global Gram-positive Bacterial Infections Market Value (US$ Mn) and Y-o-Y Growth (%), by Otitis, 2016–2026
Figure 24: Global Gram-positive Bacterial Infections Market Value (US$ Mn) and Y-o-Y Growth (%), by Pharyngitis, 2016–2026
Figure 25: Global Gram-positive Bacterial Infections Market Value (US$ Mn) and Y-o-Y Growth (%), by Impetigo, 2016–2026
Figure 26: Global Gram-positive Bacterial Infections Market Value (US$ Mn) and Y-o-Y Growth (%), by Others, 2016?2026
Figure 27: Global Gram-positive Bacterial Infections Market Attractiveness Analysis, by Disease
Figure 28: Global Gram-positive Bacterial Infections Market Value Share Analysis, by Route of Administration, 2017 and 2026
Figure 29: Global Gram-positive Bacterial Infections Market Value (US$ Mn) and Y-o-Y Growth (%), by Enteral, 2016–2026
Figure 30: Global Gram-positive Bacterial Infections Market Value (US$ Mn) and Y-o-Y Growth (%), by Parenteral, 2016–2026
Figure 31: Global Gram-positive Bacterial Infections Market Value (US$ Mn) and Y-o-Y Growth (%), by Others, 2016?2026
Figure 32: Gram-positive Bacterial Infections Market Attractiveness Analysis, by Route of Administration
Figure 33: Global Gram-positive Bacterial Infections Market Value Share Analysis, by Distribution Channel, 2017 and 2026
Figure 34: Global Gram-positive Bacterial Infections Market Value (US$ Mn) and Y-o-Y Growth (%), by Hospital Pharmacies, 2016–2026
Figure 35: Global Gram-positive Bacterial Infections Market Value (US$ Mn) and Y-o-Y Growth (%), by Drug Stores and Retail Pharmacies, 2016–2026
Figure 36: Global Gram-positive Bacterial Infections Market Value (US$ Mn) and Y-o-Y Growth (%), by Others, 2016?2026
Figure 37: Gram-positive Bacterial Infections Market Attractiveness Analysis, by Distribution Channel
Figure 38: Global Gram-positive Bacterial Infections Market Value Share, by Region, 2017 and 2026
Figure 39: Global Gram-positive Bacterial Infections Market Attractiveness Analysis, by Region, 2018–2026
Figure 40: North America Gram-positive Bacterial Infections Market Value (US$ Mn) Forecast and Y-o-Y Growth Projection (%), 2016–2026
Figure 41: North America Gram-positive Bacterial Infections Market Value Share, by Country, 2017 and 2026
Figure 42: North America Gram-positive Bacterial Infections Market Attractiveness, by Country, 2017–2026
Figure 43: North America Gram-positive Bacterial Infections Market Value Share, by Drug Type, 2017 and 2026
Figure 44: North America Gram-positive Bacterial Infections Market Attractiveness, by Drug Type, 2017–2026
Figure 45: North America Gram-positive Bacterial Infections Market Value Share, by Disease, 2017 and 2026
Figure 46: North America Gram-positive Bacterial Infections Market Attractiveness, by Disease, 2017–2026
Figure 47: North America Gram-positive Bacterial Infections Market Value Share, by Route of Administration, 2017 and 2026
Figure 48: North America Gram-positive Bacterial Infections Market Attractiveness, by Route of Administration, 2017–2026
Figure 49: North America Gram-positive Bacterial Infections Market Value Share, by Distribution Channel, 2017 and 2026
Figure 50: North America Gram-positive Bacterial Infections Market Attractiveness, by Distribution Channel, 2017–2026
Figure 51: Europe Gram-positive Bacterial Infections Market Value (US$ Mn) Forecast and Y-o-Y Growth Projection (%), 2016–2026
Figure 52: Europe Gram-positive Bacterial Infections Market Value Share, by Country/Sub-region, 2017 and 2026
Figure 53: Europe Gram-positive Bacterial Infections Market Attractiveness, by Country/Sub-region, 2017–2026
Figure 54: Europe Gram-positive Bacterial Infections Market Value Share, by Drug Type, 2017 and 2026
Figure 55: Europe Gram-positive Bacterial Infections Market Attractiveness, by Drug Type, 2017–2026
Figure 56: Europe Gram-positive Bacterial Infections Market Value Share, by Disease, 2017 and 2026
Figure 57: Europe Gram-positive Bacterial Infections Market Attractiveness, by Disease, 2017–2026
Figure 58: Europe Gram-positive Bacterial Infections Market Value Share, by Route of Administration, 2017 and 2026
Figure 59: Europe Gram-positive Bacterial Infections Market Attractiveness, by Route of Administration, 2017–2026
Figure 60: Europe Gram-positive Bacterial Infections Market Value Share, by Distribution Channel, 2017 and 2026
Figure 61: Europe Gram-positive Bacterial Infections Market Attractiveness, by Distribution Channel, 2017–2026
Figure 62: Asia Pacific Gram-positive Bacterial Infections Market Value (US$ Mn) Forecast and Y-o-Y Growth Projection (%), 2016–2026
Figure 63: Asia Pacific Gram-positive Bacterial Infections Market Value Share, by Country/Sub-region, 2017 and 2026
Figure 64: Asia Pacific Gram-positive Bacterial Infections Market Attractiveness, by Country/Sub-region, 2017–2026
Figure 65: Asia Pacific Gram-positive Bacterial Infections Market Value Share, by Drug Type, 2017 and 2026
Figure 66: Asia Pacific Gram-positive Bacterial Infections Market Attractiveness, by Drug Type, 2017–2026
Figure 67: Asia Pacific Gram-positive Bacterial Infections Market Value Share, by Disease, 2017 and 2026
Figure 68: Asia Pacific Gram-positive Bacterial Infections Market Attractiveness, by Disease, 2017–2026
Figure 69: Asia Pacific Gram-positive Bacterial Infections Market Value Share, by Route of Administration, 2017 and 2026
Figure 70: Asia Pacific Gram-positive Bacterial Infections Market Attractiveness, by Route of Administration, 2017–2026
Figure 71: Asia Pacific Gram-positive Bacterial Infections Market Value Share, by Distribution Channel, 2017 and 2026
Figure 72: Asia Pacific Gram-positive Bacterial Infections Market Attractiveness, by Distribution Channel, 2017–2026
Figure 73: Latin America Gram-positive Bacterial Infections Market Value (US$ Mn) Forecast and Y-o-Y Growth Projection (%), 2016–2026
Figure 74: Latin America Gram-positive Bacterial Infections Market Value Share, by Country/Sub-region, 2017 and 2026
Figure 75: Latin America Gram-positive Bacterial Infections Market Attractiveness, by Country/Sub-region, 2017–2026
Figure 76: Latin America Gram-positive Bacterial Infections Market Value Share, by Drug Type, 2017 and 2026
Figure 77: Latin America Gram-positive Bacterial Infections Market Attractiveness, by Drug Type, 2017–2026
Figure 78: Latin America Gram-positive Bacterial Infections Market Value Share, by Disease, 2017 and 2026
Figure 79: Latin America Gram-positive Bacterial Infections Market Attractiveness, by Disease, 2017–2026
Figure 80: Latin America Gram-positive Bacterial Infections Market Value Share, by Route of Administration, 2017 and 2026
Figure 81: Latin America Gram-positive Bacterial Infections Market Attractiveness, by Route of Administration, 2017–2026
Figure 82: Latin America Gram-positive Bacterial Infections Market Value Share, by Distribution Channel, 2017 and 2026
Figure 83: Latin America Gram-positive Bacterial Infections Market Attractiveness, by Distribution Channel, 2017–2026
Figure 84: Middle East & Africa Gram-positive Bacterial Infections Market Value (US$ Mn) Forecast and Y-o-Y Growth Projection (%), 2016–2026
Figure 85: Middle East & Africa Gram-positive Bacterial Infections Market Value Share, by Country/Sub-region, 2017 and 2026
Figure 86: Middle East & Africa Gram-positive Bacterial Infections Market Attractiveness, by Country/Sub-region, 2017–2026
Figure 87: Middle East & Africa Gram-positive Bacterial Infections Market Value Share, by Drug Type, 2017 and 2026
Figure 88: Middle East & Africa Gram-positive Bacterial Infections Market Attractiveness, by Drug Type, 2017–2026
Figure 89: Middle East & Africa Gram-positive Bacterial Infections Market Value Share, by Disease, 2017 and 2026
Figure 90: Middle East & Africa Gram-positive Bacterial Infections Market Attractiveness, by Disease, 2017–2026
Figure 91: Middle East & Africa Gram-positive Bacterial Infections Market Value Share, by Route of Administration, 2017 and 2026
Figure 92: Middle East & Africa Gram-positive Bacterial Infections Market Attractiveness, by Route of Administration, 2017–2026
Figure 93: Middle East & Africa Gram-positive Bacterial Infections Market Value Share, by Distribution Channel, 2017 and 2026
Figure 94: Middle East & Africa Gram-positive Bacterial Infections Market Attractiveness, by Distribution Channel, 2017–2026
Copyright © Transparency Market Research, Inc. All Rights reserved
Trust Online

Gram-positive Bacterial Infections Market