
Reports
Reports
Key players in the global antibacterial drugs market are engaged in regulatory approvals, new drug developemnt, launch of new products, and acquisition & collaborative agreements with other companies. These strategies are likely to fuel the growth of the market. A few expansion strategies adopted by players operating in the global antibacterial drugs market are:
The report on the global market discussed individual strategies, followed by company profiles of manufacturers of antibacterial drugs. The competitive landscape section has been included in the report to provide readers with a dashboard view and a company market share analysis of key players operating in the global antibacterial drugs market.
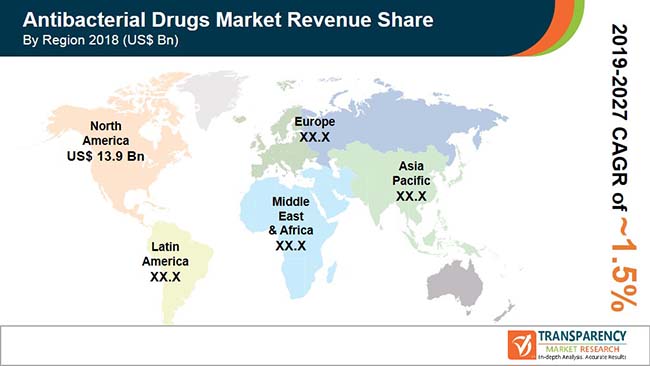
it was valued at US$ 46.37 Bn in 2018
It is anticipated to expand at a CAGR of 1.5% from 2019 to 2027
Antibacterial drugs market is driven by increase in prevalence of infectious diseases
Bayer AG, Pfizer Inc., Sanofi, GlaxoSmithKline plc., Merck & Co., Inc.
1. Preface
1.1. Report Scope and Market Segmentation
1.2. Research Highlights
1.3. Assumptions and Acronyms Used
2. Research Methodology
3. Executive Summary
4. Market Overview
4.1. Product Overview
4.2. Key Industry Developments
4.3. Market Dynamics
4.3.1. Drivers
4.3.2. Restraints
4.3.3. Opportunity Analysis
4.3.4. Porter’s Five Forces Representation
4.3.5. Antibacterial Drugs Market- Value Chain Analysis & Supply-Demand Scenario
4.3.6. Antibacterial Drugs Market Outlook
4.3.7. Anti-Bacterial Drugs Pipeline Analysis
5. Global Antibacterial Drugs Market Analysis, by Drug Class, 2017-2027
5.1. Key Findings
5.2. Definition
5.3. Introduction
5.4. Global Antibacterial Drugs Market Value Share Analysis, by Drug Class, 2018 and 2027
5.5. Global Antibacterial Drugs Market Analysis, by Drug Class
5.5.1. β-lactam
5.5.2. Quinolones
5.5.3. Macrolides
5.5.4. Tetracycline
5.5.5. Aminoglycoside
5.5.6. Sulfonamide
5.5.7. Phenicols
5.5.8. Others
5.6. Global Antibacterial Drugs Market Attractiveness Analysis, by Drug Class
5.7. Global Antibacterial Drugs Market Forecast, by Drug Class
5.8. Key Trends
6. Global Antibacterial Drugs Market Analysis, by Routes of Administration
6.1. Key Findings
6.2. Definitions
6.3. Introduction
6.4. Global Antibacterial Drugs Market Value Share Analysis, by Routes of Administration, 2018 and 2027
6.5. Global Antibacterial Drugs Market Analysis, by Routes of Administration
6.5.1. Enteral
6.5.2. Parenteral
6.5.3. Others
6.6. Antibacterial Drugs Market Attractiveness Analysis, by Routes of Administration
6.7. Global Antibacterial Drugs Market Forecast, by Routes of Administration
7. Global Antibacterial Drugs Market Analysis, by Channels of Distribution
7.1. Key Findings
7.2. Definitions
7.3. Introduction
7.4. Global Antibacterial Drugs Market Value Share Analysis, by Channels of Distribution, 2018 and 2027
7.5. Global Antibacterial Drugs Market Analysis, by Channels of Distribution
7.5.1. Hospital Pharmacies
7.5.2. Drug Stores & Retail Pharmacies
7.5.3. Online Sales
7.6. Global Antibacterial Drugs Market Attractiveness Analysis, by Channels of Distribution
7.7. Global Antibacterial Drugs Market Forecast, by Channels of Distribution
7.8. Key Trends
8. Global Antibacterial Drugs Market Analysis, by Region
8.1. Key Findings
8.2. Introduction
8.3. Global Antibacterial Drugs Market Value Share Analysis, by Region, 2018 and 2027
8.4. Global Antibacterial Drugs Market Attractiveness Analysis, by Region
8.5. Global Antibacterial Drugs Market Forecast, by Region, 2017-2027
9. North America Antibacterial Drugs Market Analysis
9.1. North America Antibacterial Drugs Market Overview
9.2. North America Antibacterial Drugs Market Forecast, Country wise, 2017-2027
9.3. North America Antibacterial Drugs Market Value Share Analysis, by Drug Class, 2018 and 2027
9.4. North America Antibacterial Drugs Market Attractiveness Analysis, by Drug Class
9.5. North America Antibacterial Drugs Market Forecast, by Drug Class, 2017-2027
9.6. North America Antibacterial Drugs Market Value Share Analysis, by Routes of Administration, 2018 and 2027
9.7. North America Antibacterial Drugs Market Attractiveness Analysis, by Routes of Administration
9.8. North America Antibacterial Drugs Market Forecast, by Routes of Administration, 2017-2027
9.9. North America Antibacterial Drugs Market Value Share Analysis, by Channels of Distribution, 2018 and 2027
9.10. North America Antibacterial Drugs Market Attractiveness Analysis, by Channels of Distribution
9.11. North America Antibacterial Drugs Market Forecast, by Channels of Distributions, 2017-2027
9.12. Key Trends
10. Europe Antibacterial Drugs Market Analysis
10.1. Europe Antibacterial Drugs Market Overview
10.2. Europe Antibacterial Drugs Market Forecast, Country wise, 2017-2027
10.3. Europe Antibacterial Drugs Market Value Share Analysis, by Drug Class, 2018 and 2027
10.4. Europe Antibacterial Drugs Market Attractiveness Analysis, by Drug Class
10.5. Europe Antibacterial Drugs Market Forecast, by Drug Class, 2017-2027
10.6. Europe Antibacterial Drugs Market Value Share Analysis, by Routes of Administration, 2018 and 2027
10.7. Europe Antibacterial Drugs Market Attractiveness Analysis, by Routes of Administration,
10.8. Europe Antibacterial Drugs Market Forecast, by Routes of Administration, 2017-2027
10.9. Europe Antibacterial Drugs Market Value Share Analysis, by Channels of Distribution, 2018 and 2027
10.10. Europe Antibacterial Drugs Market Attractiveness Analysis, by Channels of Distribution
10.11. Europe Antibacterial Drugs Market Forecast, by Channels of Distributions, 2017-2027
10.12. Key Trends
11. Asia Pacific Antibacterial Drugs Market Analysis
11.1. Asia Pacific Antibacterial Drugs Market Overview
11.2. Asia Pacific Antibacterial Drugs Market Forecast, Country wise, 2017-2027
11.3. Asia Pacific Antibacterial Drugs Market Value Share Analysis, by Drug Class, 2018 and 2027
11.4. Asia Pacific Antibacterial Drugs Market Attractiveness Analysis, by Drug Class
11.5. Asia Pacific Antibacterial Drugs Market Forecast, by Drug Class, 2017-2027
11.6. Asia Pacific Antibacterial Drugs Market Value Share Analysis, by Routes of Administration, 2018 and 2027
11.7. Asia Pacific Antibacterial Drugs Market Attractiveness Analysis, by Routes of Administration
11.8. Asia Pacific Antibacterial Drugs Market Forecast, by Routes of Administration, 2017-2027
11.9. Asia Pacific Antibacterial Drugs Market Value Share Analysis, by Channels of Distribution, 2018 and 2027
11.10. Pacific Antibacterial Drugs Market Attractiveness Analysis, by Channels of Distribution
11.11. Asia Pacific Antibacterial Drugs Market Forecast, by Channels of Distributions, 2017-2027
11.12. Key Trends
12. Latin America Antibacterial Drugs Market Analysis
12.1. Latin America Antibacterial Drugs Market Overview
12.2. Latin America Antibacterial Drugs Market Forecast, Country wise, 2017-2027
12.3. Latin America Antibacterial Drugs Market Value Share Analysis, by Drug Class, 2018 and 2027
12.4. Latin America Antibacterial Drugs Market Attractiveness Analysis, by Drug Class
12.5. Latin America Antibacterial Drugs Market Forecast, by Drug Class, 2017-2027
12.6. Latin America Antibacterial Drugs Market Value Share Analysis, by Routes of Administration, 2018 and 2027
12.7. Latin America Antibacterial Drugs Market Attractiveness Analysis, by Routes of Administration
12.8. Latin America Antibacterial Drugs Market Forecast, by Routes of Administration, 2017-2027
12.9. Latin America Antibacterial Drugs Market Value Share Analysis, by Channels of Distribution, 2018 and 2027
12.10. Latin America Antibacterial Drugs Market Attractiveness Analysis, by Channels of Distribution
12.11. Latin America Antibacterial Drugs Market Forecast, by Channels of Distributions, 2017-2027
12.12. Key Trends
13. Middle East & Africa Antibacterial Drugs Market Analysis
13.1. 13.1. Middle East & Africa Antibacterial Drugs Market Overview
13.2. 13.2. Middle East & Africa Antibacterial Drugs Market Forecast, Country wise, 2017-2027
13.3. 13.3. Middle East & Africa Antibacterial Drugs Market Value Share Analysis, by Drug Class, 2018 and 2027
13.4. 13.4. Middle East & Africa Antibacterial Drugs Market Attractiveness Analysis, by Drug Class
13.5. 13.5. Middle East & Africa Antibacterial Drugs Market Forecast, by Drug Class, 2017-2027
13.6. 13.6. Middle East & Africa Antibacterial Drugs Market Value Share Analysis, by Routes of Administration, 2018 and 2027
13.7. 13.7. Middle East & Africa Antibacterial Drugs Market Attractiveness Analysis, by Routes of Administration
13.8. 13.8. Middle East & Africa Antibacterial Drugs Market Forecast, by Routes of Administration, 2017-2027
13.9. 13.9. Middle East & Africa Antibacterial Drugs Market Value Share Analysis, by Channels of Distribution, 2018 and 2027
13.10. 13.10. Middle East & Africa Antibacterial Drugs Market Attractiveness Analysis, by Channels of Distribution
13.11. 13.11. Middle East & Africa Antibacterial Drugs Market Forecast, by Channels of Distributions, 2017-2027
13.12. 13.12. Key Trends
14. Competition Landscape
14.1. Leading Antibacterial Drugs Sales Analysis
14.2. Competition Matrix
14.3. Company Profiles
14.3.1. Bayer AG
14.3.1.1. Company Description
14.3.1.2. Business Overview
14.3.1.3. SWOT Analysis
14.3.1.4. Strategic Overview
14.3.2. Pfizer Inc.
14.3.2.1. Company Description
14.3.2.2. Business Overview
14.3.2.3. SWOT Analysis
14.3.2.4. Strategic Overview
14.3.3. Sanofi
14.3.3.1. Company Description
14.3.3.2. Business Overview
14.3.3.3. SWOT Analysis
14.3.3.4. Strategic Overview
14.3.4. GlaxoSmithKline plc
14.3.4.1. Company Description
14.3.4.2. Business Overview
14.3.4.3. SWOT Analysis
14.3.4.4. Strategic Overview
14.3.5. Merck & Co., Inc.
14.3.5.1. Company Description
14.3.5.2. Business Overview
14.3.5.3. SWOT Analysis
14.3.5.4. Strategic Overview
14.3.6. AstraZeneca
14.3.6.1. Company Description
14.3.6.2. Business Overview
14.3.6.3. SWOT Analysis
14.3.6.4. Strategic Overview
14.3.7. Johnson and Johnson Services, Inc.
14.3.7.1. Company Description
14.3.7.2. Business Overview
14.3.7.3. SWOT Analysis
14.3.7.4. Strategic Overview
14.3.8. Bristol-Myers Squibb Company
14.3.8.1. Company Description
14.3.8.2. Business Overview
14.3.8.3. SWOT Analysis
14.3.8.4. Strategic Overview
14.3.9. Novartis AG
14.3.9.1. Company Description
14.3.9.2. Business Overview
14.3.9.3. SWOT Analysis
14.3.9.4. Strategic Overview
14.3.10. Allergen
14.3.10.1. Company Description
14.3.10.2. Business Overview
14.3.10.3. SWOT Analysis
14.3.10.4. Strategic Overview
List of Table
Table 01: Global Antibacterial Drugs Market Size (US$ Mn) Forecast, by Drug Class, 2017-2027
Table 02: Global Antibacterial Drugs Market Size (US$ Mn) Forecast, by Routes of Administration, 2017-2027
Table 03: Global Antibacterial Drugs Market Size (US$ Mn) Forecast, by Channels of Distribution, 2017-2027
Table 04: Global Antibacterial Drugs Market Size (US$ Mn) Forecast, by Region, 2017-2027
Table 05: North America Antibacterial Drugs Market Size (US$ Mn) Forecast, Country Wise, 2017-2027
Table 06: North America Antibacterial Drugs Market Size (US$ Mn) Forecast, by Drug Class, 2017-2027
Table 07: North America Antibacterial Drugs Market Size (US$ Mn) Forecast, by Routes of Administration,2017-2027
Table 08: North America Antibacterial Drugs Market Size (US$ Mn) Forecast, by Channels of Distributions,2017-2027
Table 09: Europe Antibacterial Drugs Market Size (US$ Mn) Forecast, Country Wise, 2017-2027
Table 10: Europe Antibacterial Drugs Market Size (US$ Mn) Forecast, by Drug Class, 2017-2027
Table 11: Europe Antibacterial Drugs Market Size (US$ Mn) Forecast, by Routes of Administration, 2017-2027
Table 12: Europe Antibacterial Drugs Market Size (US$ Mn) Forecast, by Channels of Distribution, 2017-2027
Table 13: Asia Pacific Antibacterial Drugs Market Size (US$ Mn) Forecast, Country Wise, 2017-2027
Table 14: Asia Pacific Antibacterial Drugs Market Size (US$ Mn) Forecast, by Drug Class, 2017-2027
Table 15: Asia Pacific Antibacterial Drugs Market Size (US$ Mn) Forecast, by Routes of Administration, 2017-2027
Table 16: Asia Pacific Antibacterial Drugs Market Size (US$ Mn) Forecast, by Channels of Distribution, 2017-2027
Table 17: Latin America Antibacterial Drugs Market Size (US$ Mn) Forecast, by Country Wise, 2017-2027
Table 18: Latin America Antibacterial Drugs Market Size (US$ Mn) Forecast, by Drug Class, 2017-2027
Table 19: Latin America Antibacterial Drugs Market Size (US$ Mn) Forecast, by Routes of Administration,2017-2027
Table 20: Latin America Antibacterial Drugs Market Size (US$ Mn) Forecast, by Channels of Distribution, 2017-2027
Table 21: Middle East & Africa Antibacterial Drugs Market Size (US$ Mn) Forecast, by Country Wise, 2017-2027
Table 22: Middle East & Africa Antibacterial Drugs Market Size (US$ Mn) Forecast, by Drug Class, 2017-2027
Table 23: MEA Antibacterial Drugs Market Size (US$ Mn) Forecast, by Routes of Administration, 2017-2027
Table 24: MEA Antibacterial Drugs Market Size (US$ Mn) Forecast, by Channels of Distribution, 2017–202
List of Figure
Figure 01: Global Antibacterial Drugs Market Size ($ Mn) and Distribution by Geography, 2018 and 2027
Figure 02: Global Antibacterial Drugs Market Revenue (US$ Mn) and top 3 trends
Figure 03: Global Antibacterial Drugs Market, by Channels of Distribution, Revenue (US$ Mn) and Market Share
Figure 04: Market Value Share By Drug Class (2018) Revenue (US$ Mn)
Figure 05: Market Value Share By Region (2018) Revenue (US$ Mn)
Figure 06: Antibacterial Drugs in Clinical Trials
Figure 07: Anti-bacterial Drugs by Indication
Figure 08: Anti-bacterial Drugs by class
Figure 09: Global Antibacterial Drugs Market Value Share Analysis, by Drug Class, 2018 and 2027
Figure 10: Global β-lactam Market Revenue (US$ Mn) and Y-o-Y Growth (%), by β-lactam, 2017-2027
Figure 11: Global Quinolones Market Revenue (US$ Mn) and Y-o-Y Growth (%), 2017-2027
Figure 12: Global Macrolides Market Revenue (US$ Mn) and Y-o-Y Growth (%), 2017-2027
Figure 13: Global Tetracyclines Market Revenue (US$ Mn) and Y-o-Y Growth (%), 2017-2027
Figure 14: Global Aminoglycosides Market Revenue (US$ Mn) and Y-o-Y Growth (%), 2017-2027
Figure 15: Global Sulfonamides Market Revenue (US$ Mn) and Y-o-Y Growth (%), 2017-2027
Figure 16: Global Phenicols Market Revenue (US$ Mn) and Y-o-Y Growth (%), 2017-2027
Figure 17: Global Others Market Revenue (US$ Mn) and Y-o-Y Growth (%), 2017-2027
Figure 18: Global Antibacterial Drugs Market Attractiveness Analysis, by Drug Class
Figure 19: Global Antibacterial Drugs Market Value Share Analysis, by Routes of Administration, 2018 and 2027
Figure 20: Global Enteral Segment Market Revenue (US$ Mn) and Y-o-Y Growth (%), 2017-2027
Figure 21: Global Parenteral Market Revenue (US$ Mn) and Y-o-Y Growth (%), 2017-2027
Figure 22: Global Others routes of administration Segment Market Revenue (US$ Mn) and Y-o-Y Growth (%), 2017-2027
Figure 23: Global Antibacterial Drugs Market Attractiveness Analysis, by Routes od Administration
Figure 24: Global Antibacterial Drugs Market Value Share Analysis, by Channels of Distribution, 2018 and 2027
Figure 25: Global Hospital Pharmacies Segment Market Revenue (US$ Mn) and Y-o-Y Growth (%), 2017-2027
Figure 26: Global Drug Stores & Retail Pharmacies Market Revenue (US$ Mn) and Y-o-Y Growth (%), 2017-2027
Figure 27: Global Online Sales Segment Market Revenue (US$ Mn) and Y-o-Y Growth (%), 2017-2027
Figure 28: Global Antibacterial Drugs Market Attractiveness Analysis, by Channels of Distribution
Figure 29: Global Antibacterial Drugs Market Value Share Analysis, by Region, 2018 and 2027
Figure 30: Global Antibacterial Drugs Market Attractiveness Analysis, by Region, 2018
Figure 31: North America Antibacterial Drugs Market Size (US$ Mn) Forecast, 2017-2027
Figure 32: North America Antibacterial Drugs Market Y-o-Y Growth Projections, 2017-2027
Figure 33: North America Antibacterial Drugs Market Value Share Analysis, by Drug Class, 2018 and 2027
Figure 34: North America Antibacterial Drugs Market Attractiveness Analysis, by Drug Class
Figure 35: North America Antibacterial Drugs Market Value Share Analysis, by Routes of Administration, 2018 and 2027
Figure 36: North America Antibacterial Drugs Market Attractiveness Analysis, by Routes of Administration
Figure 37: North America Antibacterial Drugs Market Value Share Analysis, by Channels of Distribution, 2018 and 2027
Figure 38: North America Antibacterial Drugs Market Attractiveness Analysis, by Channels of Distribution
Figure 39: Europe Antibacterial Drugs Market Size (US$ Mn) Forecast, 2017-2027
Figure 40: Europe Antibacterial Drugs Market Y-o-Y Growth Projections, 2017-2027
Figure 41: Europe Antibacterial Drugs Market Value Share Analysis, by Drug Class, 2018 and 2027
Figure 42: Europe Antibacterial Drugs Market Attractiveness Analysis, by Drug Class
Figure 43: Europe Antibacterial Drugs Market Value Share Analysis, by Routes of Administration, 2018 and 2027
Figure 44: Europe Antibacterial Drugs Market Attractiveness Analysis, by Routes of Administration
Figure 45: Europe Antibacterial Drugs Market Value Share Analysis, by Channels of Distribution, 2018 and 2027
Figure 46: Europe Antibacterial Drugs Market Attractiveness Analysis, by Distribution
Figure 47: Asia Pacific Antibacterial Drugs Market Size (US$ Mn) Forecast, 2017-2027
Figure 48: Asia Pacific Antibacterial Drugs Market Y-o-Y Growth Projections, 2017-2027
Figure 49: Asia Pacific Antibacterial Drugs Market Value Share Analysis, by Drug Class, 2018 and 2027
Figure 50: Asia Pacific Antibacterial Drugs Market Attractiveness Analysis, by Drug Class
Figure 51: Asia Pacific Antibacterial Drugs Market Value Share Analysis, by Routes of Administration, 2018 and 2027
Figure 52: Asia Pacific Antibacterial Drugs Market Attractiveness Analysis, by Routes of Administration
Figure 53: Asia Pacific Antibacterial Drugs Market Value Share Analysis, by Channels of Distribution, 2018 and 2027
Figure 54: Asia Pacific Antibacterial Drugs Market Attractiveness Analysis, by Distribution
Figure 55: Latin America Antibacterial Drugs Market Size (US$ Mn) Forecast, 2017-2027
Figure 56: Latin America Antibacterial Drugs Market, Y-o-Y Growth Projection, 2017-2027
Figure 57: Latin America Antibacterial Drugs Market Value Share Analysis, by Drug Class, 2018 and 2027
Figure 58: Latin America Antibacterial Drugs Market Attractiveness Analysis, by Drug Class
Figure 59: Latin America Antibacterial Drugs Market Value Share Analysis, by Routes of Administration, 2018 and 2027
Figure 60: Latin America Antibacterial Drugs Market Attractiveness Analysis, by Routes of Administration
Figure 61: Latin America Antibacterial Drugs Market Value Share Analysis, by Channels of Distribution, 2018 and 2027
Figure 62: Latin America Antibacterial Drugs Market Attractiveness Analysis, by Distribution
Figure 63: Middle East & Africa Antibacterial Drugs Market Size (US$ Mn) Forecast, 2017-2027
Figure 64: Middle East & Africa Antibacterial Drugs Market Y-o-Y Growth Projections, 2017-2027
Figure 65: Middle East & Africa Antibacterial Drugs Market Value Share Analysis, by Drug Class, 2018 and 2027
Figure 66: Middle East & Africa Antibacterial Drugs Market Attractiveness Analysis, by Drug Class
Figure 67: MEA Antibacterial Drugs Market Value Share Analysis, by Routes of Administration, 2018 and 2027
Figure 68: MEA Antibacterial Drugs Market Attractiveness Analysis, by Routes of Administration
Figure 69: MEA Antibacterial Drugs Market Value Share Analysis, by Channels of Distribution, 2018 and 2027
Figure 70: MEA Antibacterial Drugs Market Attractiveness Analysis, by Distribution
Figure 71: Leading Antibacterial Drugs Sales Analysis, 2018
Figure 72: Bayer AG, Breakdown of Net Sales, by Region, 2018
Figure 73: Bayer AG, Revenue (US$ Mn) & Y-o-Y Growth (%), 2015-2018
Figure 74: Pfizer, Breakdown of Net Sales, by Region, 2018
Figure 75: Pfizer, Revenue (US$ Bn) & Y-o-Y Growth (%), 2015-2018
Figure 76: Sanofi, Breakdown of Net Sales, by Region, 2018
Figure 77: Sanofi, Revenue (US$ Bn) & Y-o-Y Growth (%), 2015-2018
Figure 78: GlaxoSmithKline, Breakdown of Net Sales, by Region, 2018
Figure 79: GlaxoSmithKline, Revenue (US$ Bn) & Y-o-Y Growth (%), 2015-2018
Figure 80: Merck & Co., Breakdown of Net Sales, by Region, 2018
Figure 81: Merck & Co., Revenue (US$ Mn) & Y-o-Y Growth (%), 2015-2018
Figure 82: AstraZeneca, Breakdown of Net Sales, by Region, 2018
Figure 83: AstraZeneca, Revenue (US$ Bn) & Y-o-Y Growth (%), 2015-2018
Figure 84: Johnson & Johnson, Breakdown of Net Sales, by Region, 2016
Figure 85: Johnson & Johnson, Revenue (US$ Bn) & Y-o-Y Growth (%), 2015-2018
Figure 86: Bristol-Myers Squibb Company, Breakdown of Net Sales, by Region (2018)
Figure 87: Bristol-Myers Squibb Company, Revenue (US$ Bn) & Y-o-Y Growth (%), 2015-2018
Figure 88: Novartis AG, Breakdown of Net Sales, by Region, 2018
Figure 89: Novartis AG, Revenue (US$ Bn) & Y-o-Y Growth (%), 2015-2018
Figure 90: Allergen, Breakdown of Net Sales (%), by Segments (2018)
Figure 91: Allergen, Revenue (US$ Bn) & Y-o-Y Growth (%), 2015-2018
Copyright © Transparency Market Research, Inc. All Rights reserved
Trust Online

Antibacterial Drugs Market