
Reports
Reports
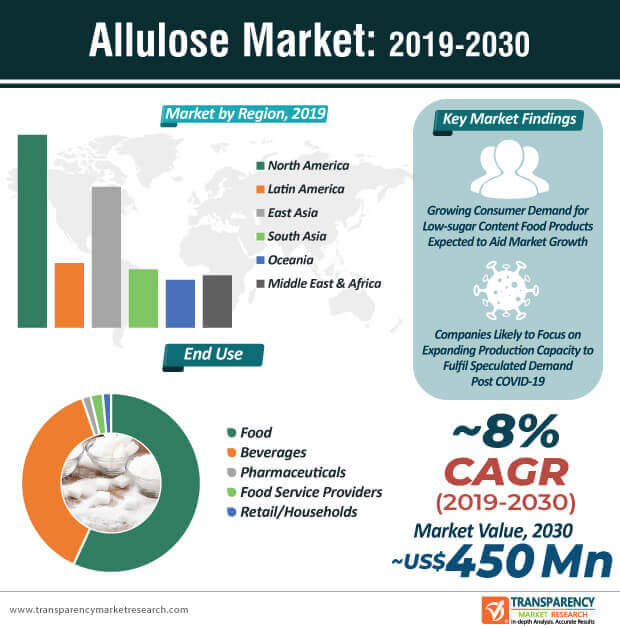
At present, consumers are increasingly more conscious about health and wellness worldwide. The significant rise in the number of health-conscious consumers has played an imperative role in increasing the demand for low-calorie and low-sugar food ingredients and products. At the back of growing interest in low-calorie products, consumers are increasingly swaying toward the use of allulose. The demand for allulose is on the rise, as it has emerged as a promising alternative for natural sugar. In addition, several studies have also revealed that apart from containing around one-tenth of the total calories of that in sugar, consumers are leaning toward the use of allulose, as it does not cause dental decay and is relatively safer than sugar.
Although a broad range of artificial sweeteners has hit the market in the past couple of decades, consumer demand for allulose is on the rise, thus driving the allulose market. Consumer trends suggest a growing interest in science-based data and transparency from food and beverages manufacturers. The labeling guidance released by the Food and Drug Administration (FDA) has shown the green signal to the use of allulose as a substitute for specific sugars– a factor that is expected to propel the demand for allulose during the forecast period. At the back of these factors, the global allulose market is expected to attain a market value of ~US$ 450 Mn by the end of 2030.
Due to the growing awareness regarding drawbacks of high uptake of natural sugar, a range of sugar alternatives have gained popularity. Despite the higher price range compared to other sugar alternatives, allulose continues to gain popularity among health-conscious consumers. Current observable consumer trends suggest a major shift away from refined and processed food products. In addition, the high prevalence of diabetes across the world is another factor that has accelerated the pursuit of effective sugar alternatives due to which, the demand for allulose is anticipated to grow at a healthy pace in the forthcoming years. Over the next few years, research and activities within the allulose market are projected to gain momentum as dieticians and experts continue to advocate the potential of including allulose in health and weight management programs. Manufacturers operating in the current allulose market landscape are expected to comply with the labeling guidance released by the FDA.
Companies operating in the allulose market are expected to rely on both, organic as well as inorganic growth strategies to gain a competitive edge. Product launches, FDA approval, research and development, and maximizing production capacity and efficiency are likely to remain a priority for market players. For instance, in November 2019, Ingredion announced the opening of a new allulose facility– a move that will enable the company to cater to the markets in Asia Pacific and the Americas. As companies continue to push for the Generally Recognized as Safe (GRAS) certification, particularly in the U.S., the production of allulose is likely to grow at a healthy pace over the next few years. Companies are also expected to focus on the commercialization of allulose sweetener. For instance, in September 2019, Blue California, announced that the company would scale up production of allulose and aims to attain the GRAS status for its allulose products.
The onset of the novel COVID-19 pandemic is expected to affect the growth of the global allulose market, particularly in 2020 and the first half of 2021. As governments across the world continue to combat the pandemic by imposing lockdowns, trade restrictions and disruption in the supply chain within the allulose market are expected to impact the expansion of the market in the next few months. Market players are likely to adopt to contingency strategies in the first half of 2020 to mitigate the impact of the COVID-19 pandemic. Moreover, in the current scenario, as consumers are highly in favor of purchasing only ‘essential goods & services’, the demand for allulose is expected to dip.
Analysts’ Viewpoint
The global allulose market is expected to grow at an impressive CAGR of ~8% during the forecast period. Some of the leading factors that are likely to influence the market growth include high demand for low-calorie and low-carbohydrate food products, a rise in the number of health-conscious consumers, increase in the number of companies receiving the GRAS status for their allulose products, and research and development activities. Market players should focus on maximizing their production capacity in the upcoming years to cater to the growing demand for allulose worldwide. As more number of consumers are leaning toward the use of allulose, the allulose market is expected to grow at a healthy rate during the forecast period.
Allulose Market: Overview
Allulose: Market Frontrunners
Allulose Market: Trends
Increasing Consumer Preference for Natural Ingredients
Allulose Market: Strategies
Target Region for Market
Allulose Market: Players
Allulose Market is projected to reach US$ 450 Mn by the end of 2030
Allulose Market is expected to grow at a CAGR of 8% during 2020 – 2030
Increasing the demand for low-calorie and low-sugar food ingredients and products is expect to drive Allulose Market
North America is a more attractive region for vendors in the Allulose Market
Key vendors in the Allulose Market are Tate & Lyle PLC, CJ Cheil Jedang, Cargill Inc, Ingredion Incorporated, Samyang Corporation, etc
1. Executive Summary
1.1. Market Overview
1.2. Market Analysis
1.3. TMR Analysis and Recommendations
1.4. Opportunity Matrix
2. Market Introduction
2.1. Market Definition
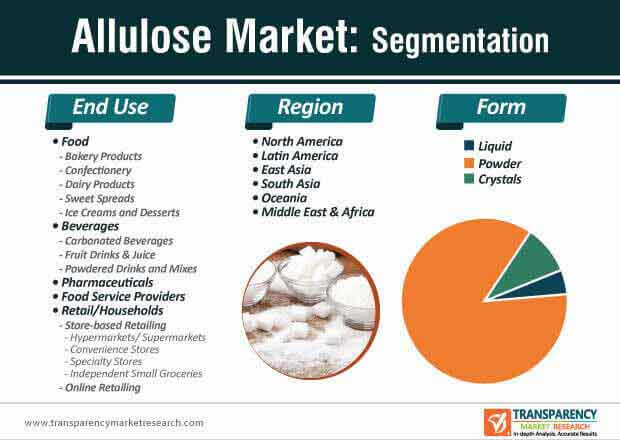
2.2. Market Taxonomy
3. Allulose Market Background
3.1. Global Sweetener Market Overview
3.2. Key Developments and Product Launches
3.3. Overview of Claims and Certifications for Allulose Products
3.4. Overview of Production and Processing Methods
3.5. Macro-Economic Indicators
3.5.1. Global GDP by Region and Country
3.5.2. Global Industry Value Added
3.5.3. Global Food and Beverage Industry Outlook
3.6. Value Chain Analysis
3.6.1. Raw Material Suppliers
3.6.2. Product Manufacturers
3.6.3. Distributors/Suppliers/Wholesalers
3.6.4. Private Label
3.6.5. End Users
3.7. Market Dynamics
3.7.1. Drivers
3.7.2. Restraints
3.7.3. Opportunities
3.7.4. Trends
3.8. Consumer Perception and End User Survey
3.9. Forecast Factors – Relevance and Impact
4. Global Allulose Market Analysis 2015–2019 and Forecast 2020–2030
4.1. Market Size (US$ Mn) and Forecast
4.1.1. Market Size (US$ Mn) and Y-o-Y Growth
4.1.2. Absolute $ Opportunity
5. Global Allulose Market Pricing Analysis
5.1. Regional Average Pricing Analysis (US$)
5.1.1. North America
5.1.2. Latin America
5.1.3. East Asia
5.1.4. South Asia
5.1.5. Oceania
5.1.6. Middle East & Africa
5.2. Pricing Analysis, By Form
6. Global Allulose Market Analysis 2015–2019 and Forecast 2020–2030, by Region
6.1. Introduction
6.2. Historical Market Size (US$ Mn) By Region, 2015–2019
6.3. Market Size (US$ Mn) Forecast By Region, 2019-2030
6.3.1. North America
6.3.2. Latin America
6.3.3. East Asia
6.3.4. South Asia
6.3.5. Oceania
6.3.6. Middle East & Africa
6.4. Attractiveness Analysis by Region
7. Global Allulose Market Analysis 2015–2019 and Forecast 2020–2030, by Form
7.1. Introduction
7.2. Historical Market Size (US$ Mn) By Form, 2015–2019
7.3. Market Size (US$ Mn) Forecast By Form, 2019-2030
7.3.1. Powder
7.3.2. Liquid
7.3.3. Crystals
7.4. Market Attractiveness Analysis By Form
8. Global Allulose Market Analysis 2015–2019 and Forecast 2020–2030, by End Use
8.1. Introduction
8.2. Historical Market Size (US$ Mn) By End Use, 2015–2019
8.3. Market Size (US$ Mn) Forecast By End Use, 2019-2030
8.3.1. Food
8.3.1.1. Bakery Products
8.3.1.2. Confectionery
8.3.1.3. Dairy Products
8.3.1.4. Sweet Spreads
8.3.1.5. Ice Creams and Desserts
8.3.2. Beverages
8.3.2.1. Carbonated Beverages
8.3.2.2. Fruit Drinks & Juice
8.3.2.3. Powdered Drinks and Mixes
8.3.3. Pharmaceuticals
8.3.4. Food Service Providers
8.3.5. Retail/ Households
8.3.5.1. Store-based Retailing
8.3.5.1.1. Hypermarkets/ Supermarkets
8.3.5.1.2. Convenience Stores
8.3.5.1.3. Specialty Stores
8.3.5.1.4. Independent Small Groceries
8.3.5.2. Online Retailing
8.4. Market Attractiveness Analysis By End Use,
9. North America Allulose Market Analysis 2015–2019 and Forecast 2020–2030
9.1. Introduction
9.2. Historical Market Value (US$ Mn) By Market Segments, 2015–2019
9.3. Market Value (US$ Mn) Forecast By Market Segments, 2019-2030
9.3.1. By Country
9.3.1.1. U.S.
9.3.1.2. Canada
9.3.2. By Form
9.3.3. By End Use
9.4. Market Attractiveness Analysis
9.4.1. By Country
9.4.2. By Form
9.4.3. By End Use
9.5. Drivers and Restraints: Impact Analysis
9.6. Key Participants Market Presence Intensity Mapping
10. Latin America Allulose Market Analysis 2015–2019 and Forecast 2020–2030
10.1. Introduction
10.2. Historical Market Value (US$ Mn) By Market Segments, 2015–2019
10.3. Market Value (US$ Mn) Forecast By Market Segments, 2019-2030
10.3.1. By Country
10.3.1.1. Mexico
10.3.1.2. Brazil
10.3.1.3. Peru
10.3.1.4. Chile
10.3.1.5. Argentina
10.3.1.6. Rest of Latin America
10.3.2. By Form
10.3.3. By End Use
10.4. Market Attractiveness Analysis
10.4.1. By Country
10.4.2. By Form
10.4.3. By End Use
10.5. Drivers and Restraints: Impact Analysis
10.6. Key Participants Market Presence Intensity Mapping
11. East Asia Allulose Market Analysis 2015–2019 and Forecast 2020–2030
11.1. Introduction
11.2. Historical Market Value (US$ Mn) By Market Segments, 2015–2019
11.3. Market Value (US$ Mn) Forecast By Market Segments, 2019-2030
11.3.1. By Country
11.3.1.1. China
11.3.1.2. South Korea
11.3.1.3. Japan
11.3.2. By Form
11.3.3. By End Use
11.4. Market Attractiveness Analysis
11.4.1. By Country
11.4.2. By Form
11.4.3. By End Use
11.5. Drivers and Restraints: Impact Analysis
11.6. Key Participants Market Presence Intensity Mapping
12. South Asia Allulose Market Analysis 2015–2019 and Forecast 2020–2030
12.1. Introduction
12.2. Historical Market Value (US$ Mn) By Market Segments, 2015–2019
12.3. Market Value (US$ Mn) Forecast By Market Segments, 2019-2030
12.3.1. By Country
12.3.1.1. India
12.3.1.2. Thailand
12.3.1.3. Indonesia
12.3.1.4. Malaysia
12.3.1.5. Singapore
12.3.1.6. Rest of South Asia
12.3.2. By Form
12.3.3. By End Use
12.4. Market Attractiveness Analysis
12.4.1. By Country
12.4.2. By Form
12.4.3. By End Use
12.5. Drivers and Restraints: Impact Analysis
12.6. Key Participants Market Presence Intensity Mapping
13. Oceania Allulose Market Analysis 2015–2019 and Forecast 2020–2030
13.1. Introduction
13.2. Historical Market Value (US$ Mn) By Market Segments, 2015–2019
13.3. Market Value (US$ Mn) Forecast By Market Segments, 2019-2030
13.3.1. By Country
13.3.1.1. Australia
13.3.1.2. New Zealand
13.3.2. By Form
13.3.3. By End Use
13.4. Market Attractiveness Analysis
13.4.1. By Country
13.4.2. By Form
13.4.3. By End Use
13.5. Drivers and Restraints: Impact Analysis
13.6. Key Participants Market Presence Intensity Mapping
14. Middle East & Africa Allulose Market Analysis 2015–2019 and Forecast 2020–2030
14.1. Introduction
14.2. Historical Market Value (US$ Mn) By Market Segments, 2015–2019
14.3. Market Value (US$ Mn) Forecast By Market Segments, 2019-2030
14.3.1. By Country
14.3.1.1. GCC Countries
14.3.1.2. South Africa
14.3.1.3. Turkey
14.3.1.4. Iran
14.3.1.5. Israel
14.3.1.6. Rest of MEA
14.3.2. By Form
14.3.3. By End Use
14.4. Market Attractiveness Analysis
14.4.1. By Country
14.4.2. By Form
14.4.3. By End Use
14.5. Drivers and Restraints: Impact Analysis
14.6. Key Participants Market Presence Intensity Mapping
15. Allulose Market Industry Structure
15.1. Market Analysis by Tier of Companies
15.2. Market Concentration
15.3. Market Share Analysis of Top 10 Players
15.4. Market Presence Analysis
15.4.1. By Regional Footprint
15.4.2. By Product Footprint
15.4.3. By Channel Footprint
16. Competition Analysis
16.1. Competition Dashboard
16.2. Competition Developments (Mergers, Acquisitions and Expansions)
16.3. Competition Deepdive
16.3.1. Matsutani Chemical Industry Co. Ltd.
16.3.1.1. Overview
16.3.1.2. Product Portfolio
16.3.1.3. Profitability by Market Segments (Product/Channel/Region)
16.3.1.4. Sales Footprint
16.3.1.5. Channel Footprint
16.3.1.6. Strategy Overview
16.3.1.6.1. Marketing Strategy
16.3.1.6.2. Product Strategy
16.3.1.6.3. Channel Strategy
16.3.2. Tate & Lyle PLC
16.3.2.1. Overview
16.3.2.2. Product Portfolio
16.3.2.3. Profitability by Market Segments (Product/Channel/Region)
16.3.2.4. Sales Footprint
16.3.2.5. Channel Footprint
16.3.2.6. Strategy Overview
16.3.2.6.1. Marketing Strategy
16.3.2.6.2. Product Strategy
16.3.2.6.3. Channel Strategy
16.3.3. CJ Cheil Jedang
16.3.3.1. Overview
16.3.3.2. Product Portfolio
16.3.3.3. Profitability by Market Segments (Product/Channel/Region)
16.3.3.4. Sales Footprint
16.3.3.5. Channel Footprint
16.3.3.6. Strategy Overview
16.3.3.6.1. Marketing Strategy
16.3.3.6.2. Product Strategy
16.3.3.6.3. Channel Strategy
16.3.4. Bonumose LLC
16.3.4.1. Overview
16.3.4.2. Product Portfolio
16.3.4.3. Profitability by Market Segments (Product/Channel/Region)
16.3.4.4. Sales Footprint
16.3.4.5. Channel Footprint
16.3.4.6. Strategy Overview
16.3.4.6.1. Marketing Strategy
16.3.4.6.2. Product Strategy
16.3.4.6.3. Channel Strategy
16.3.5. Cargill Inc.
16.3.5.1. Overview
16.3.5.2. Product Portfolio
16.3.5.3. Profitability by Market Segments (Product/Channel/Region)
16.3.5.4. Sales Footprint
16.3.5.5. Channel Footprint
16.3.5.6. Strategy Overview
16.3.5.6.1. Marketing Strategy
16.3.5.6.2. Product Strategy
16.3.5.6.3. Channel Strategy
16.3.6. Ingredion Incorporated
16.3.6.1. Overview
16.3.6.2. Product Portfolio
16.3.6.3. Profitability by Market Segments (Product/Channel/Region)
16.3.6.4. Sales Footprint
16.3.6.5. Channel Footprint
16.3.6.6. Strategy Overview
16.3.6.6.1. Marketing Strategy
16.3.6.6.2. Product Strategy
16.3.6.6.3. Channel Strategy
16.3.7. Samyang Corporation
16.3.7.1. Overview
16.3.7.2. Product Portfolio
16.3.7.3. Profitability by Market Segments (Product/Channel/Region)
16.3.7.4. Sales Footprint
16.3.7.5. Channel Footprint
16.3.7.6. Strategy Overview
16.3.7.6.1. Marketing Strategy
16.3.7.6.2. Product Strategy
16.3.7.6.3. Channel Strategy
16.3.8. Anderson Global Group
16.3.8.1. Overview
16.3.8.2. Product Portfolio
16.3.8.3. Profitability by Market Segments (Product/Channel/Region)
16.3.8.4. Sales Footprint
16.3.8.5. Channel Footprint
16.3.8.6. Strategy Overview
16.3.8.6.1. Marketing Strategy
16.3.8.6.2. Product Strategy
16.3.8.6.3. Channel Strategy
17. Assumptions and Acronyms Used
18. Research Methodology
List of Tables
Table 01: Global Allulose Historical Market Size (US$ Mn) by Region, 2015–2019
Table 02: Global Allulose Forecast Market Size (US$ Mn) by Region, 2020–2030
Table 03: Global Allulose Historical Market Volume (Metric Tons) by Region, 2015-2019
Table 04: Global Allulose Forecast Market Volume (Metric Tons) by Region, 2020-2030
Table 05: Global Allulose Historical Market Size (US$ Mn) by Form, 2015–2019
Table 06: Global Allulose Forecast Market Size (US$ Mn) by Form, 2020–2030
Table 07: Global Allulose Historical Market Volume (Metric Tons) by Form, 2015-2019
Table 08: Global Allulose Forecast Market Volume (Metric Tons) by Form, 2020-2030
Table 09: Global Allulose Historical Market Size (US$ Mn) by End Use, 2015–2019
Table 10: Global Allulose Forecast Market Size (US$ Mn) by End Use, 2020–2030
Table 11: Global Allulose Historical Market Volume (Metric Tons) by End Use, 2015-2019
Table 12: Global Allulose Forecast Market Volume (Metric Tons) by End Use, 2020-2030
Table 13: North America Allulose Historical Market Size (US$ Mn) by Region, 2015–2019
Table 14: North America Allulose Forecast Market Size (US$ Mn) by Region, 2020–2030
Table 15: North America Allulose Historical Market Volume (Metric Tons) by Region, 2015-2019
Table 16: North America Allulose Forecast Market Volume (Metric Tons) by Region, 2020-2030
Table 17: North America Allulose Historical Market Size (US$ Mn) by Form, 2015–2019
Table 18: North America Allulose Forecast Market Size (US$ Mn) by Form, 2020–2030
Table 19: North America Allulose Historical Market Volume (Metric Tons) by Form, 2015-2019
Table 20: North America Allulose Forecast Market Volume (Metric Tons) by Form, 2020-2030
Table 21: North America Allulose Historical Market Size (US$ Mn) by End Use, 2015–2019
Table 22: North America Allulose Forecast Market Size (US$ Mn) by End Use, 2020–2030
Table 23: North America Allulose Historical Market Volume (Metric Tons) by End Use, 2015-2019
Table 24: North America Allulose Forecast Market Volume (Metric Tons) by End Use, 2020-2030
Table 25: Latin America Allulose Historical Market Size (US$ Mn) by Region, 2015–2019
Table 26: Latin America Allulose Forecast Market Size (US$ Mn) by Region, 2020–2030
Table 27: Latin America Allulose Historical Market Volume (Metric Tons) by Region, 2015-2019
Table 28: Latin America Allulose Forecast Market Volume (Metric Tons) by Region, 2020-2030
Table 29: Latin America Allulose Historical Market Size (US$ Mn) by Form, 2015–2019
Table 30: Latin America Allulose Forecast Market Size (US$ Mn) by Form, 2020–2030
Table 31: Latin America Allulose Historical Market Volume (Metric Tons) by Form, 2015-2019
Table 32: Latin America Allulose Forecast Market Volume (Metric Tons) by Form, 2020-2030
Table 33: Latin America Allulose Historical Market Size (US$ Mn) by End Use, 2015–2019
Table 34: Latin America Allulose Forecast Market Size (US$ Mn) by End Use, 2020–2030
Table 35: Latin America Allulose Historical Market Volume (Metric Tons) by End Use, 2015-2019
Table 36: Latin America Allulose Forecast Market Volume (Metric Tons) by End Use, 2020-2030
Table 37: East Asia Allulose Historical Market Size (US$ Mn) by Region, 2015–2019
Table 38: East Asia Allulose Forecast Market Size (US$ Mn) by Region, 2020–2030
Table 39: East Asia Allulose Historical Market Volume (Metric Tons) by Region, 2015-2019
Table 40: East Asia Allulose Forecast Market Volume (Metric Tons) by Region, 2020-2030
Table 41: East Asia Allulose Historical Market Size (US$ Mn) by Form, 2015–2019
Table 42: East Asia Allulose Forecast Market Size (US$ Mn) by Form, 2020–2030
Table 43: East Asia Allulose Historical Market Volume (Metric Tons) by Form, 2015-2019
Table 44: East Asia Allulose Forecast Market Volume (Metric Tons) by Form, 2020-2030
Table 45: East Asia Allulose Historical Market Size (US$ Mn) by End Use, 2015–2019
Table 46: East Asia Allulose Forecast Market Size (US$ Mn) by End Use, 2020–2030
Table 47: East Asia Allulose Historical Market Volume (Metric Tons) by End Use, 2015-2019
Table 48: East Asia Allulose Forecast Market Volume (Metric Tons) by End Use, 2020-2030
Table 49: South Asia Allulose Historical Market Size (US$ Mn) by Region, 2015–2019
Table 50: South Asia Allulose Forecast Market Size (US$ Mn) by Region, 2020–2030
Table 51: South Asia Allulose Historical Market Volume (Metric Tons) by Region, 2015-2019
Table 52: South Asia Allulose Forecast Market Volume (Metric Tons) by Region, 2020-2030
Table 53: South Asia Allulose Historical Market Size (US$ Mn) by Form, 2015–2019
Table 54: South Asia Allulose Forecast Market Size (US$ Mn) by Form, 2020–2030
Table 55: South Asia Allulose Historical Market Volume (Metric Tons) by Form, 2015-2019
Table 56: South Asia Allulose Forecast Market Volume (Metric Tons) by Form, 2020-2030
Table 57: South Asia Allulose Historical Market Size (US$ Mn) by End Use, 2015–2019
Table 58: South Asia Allulose Forecast Market Size (US$ Mn) by End Use, 2020–2030
Table 59: South Asia Allulose Historical Market Volume (Metric Tons) by End Use, 2015-2019
Table 60: South Asia Allulose Forecast Market Volume (Metric Tons) by End Use, 2020-2030
Table 61: Oceania Allulose Historical Market Size (US$ Mn) by Region, 2015–2019
Table 62: Oceania Allulose Forecast Market Size (US$ Mn) by Region, 2020–2030
Table 63: Oceania Allulose Historical Market Volume (Metric Tons) by Region, 2015-2019
Table 64: Oceania Allulose Forecast Market Volume (Metric Tons) by Region, 2020-2030
Table 65: Oceania Allulose Historical Market Size (US$ Mn) by Form, 2015–2019
Table 66: Oceania Allulose Forecast Market Size (US$ Mn) by Form, 2020–2030
Table 67: Oceania Allulose Historical Market Volume (Metric Tons) by Form, 2015-2019
Table 68: Oceania Allulose Forecast Market Volume (Metric Tons) by Form, 2020-2030
Table 69: Oceania Allulose Historical Market Size (US$ Mn) by End Use, 2015–2019
Table 70: Oceania Allulose Forecast Market Size (US$ Mn) by End Use, 2020–2030
Table 71: Oceania Allulose Historical Market Volume (Metric Tons) by End Use, 2015-2019
Table 72: Oceania Allulose Forecast Market Volume (Metric Tons) by End Use, 2020-2030
Table 73: MEA Allulose Historical Market Size (US$ Mn) by Region, 2015–2019
Table 74: MEA Allulose Forecast Market Size (US$ Mn) by Region, 2020–2030
Table 75: MEA Allulose Historical Market Volume (Metric Tons) by Region, 2015-2019
Table 76: MEA Allulose Forecast Market Volume (Metric Tons) by Region, 2020-2030
Table 77: MEA Allulose Historical Market Size (US$ Mn) by Form, 2015–2019
Table 78: MEA Allulose Forecast Market Size (US$ Mn) by Form, 2020–2030
Table 79: MEA Allulose Historical Market Volume (Metric Tons) by Form, 2015-2019
Table 80: MEA Allulose Forecast Market Volume (Metric Tons) by Form, 2020-2030
Table 81: MEA Allulose Historical Market Size (US$ Mn) by End Use, 2015–2019
Table 82: MEA Allulose Forecast Market Size (US$ Mn) by End Use, 2020–2030
Table 83: MEA Allulose Historical Market Volume (Metric Tons) by End Use, 2015-2019
Table 84: MEA Allulose Forecast Market Volume (Metric Tons) by End Use, 2020-2030
List of Figures
Figure 01: Global Allulose Market Size and Incremental $ Opportunity (US$ Mn), 2015-2030
Figure 02: Global Allulose Market Value Share (%) and BPS Analysis by Form, 2015, 2020 & 2030
Figure 03: Global Allulose Market Y-o-Y Growth (%) Projections by Form, 2016-2030
Figure 04: Global Allulose Market Volume (MT) Analysis by Form, 2020 & 2030
Figure 05: Global Allulose Market Attractiveness, by Form, 2020 to 2030
Figure 06: Global Allulose Market Value Share (%) and BPS Analysis by End-use, 2015, 2020 & 2030
Figure 07: Global Allulose Market Y-o-Y Growth (%) Projections by End-use, 2016-2030
Figure 08: Global Allulose Market Volume (MT) Analysis by End-use, 2020 & 2030
Figure 09: Global Allulose Market Attractiveness, by End-use, 2020 to 2030
Figure 10: Global Allulose Market Value Share (%) and BPS Analysis by Region, 2015, 2020 & 2030
Figure 11: Global Allulose Market Y-o-Y Growth (%) Projections by Region, 2020-2030
Figure 12: Global Allulose Market Volume (MT) Analysis by Region, 2020 & 2030
Figure 13: Global Allulose Market Attractiveness, by Region, 2020 to 2030
Figure 14: North America Allulose Market Value Share (%) and BPS Analysis by Form, 2015, 2020 & 2030
Figure 15: North America Allulose Market Y-o-Y Growth (%) Projections by Form, 2016-2030
Figure 16: North America Allulose Market Volume (MT) Analysis by Form, 2020 & 2030
Figure 17: North America Allulose Market Attractiveness, by Form, 2020 to 2030
Figure 18: North America Allulose Market Value Share (%) and BPS Analysis by End-use, 2015, 2020 & 2030
Figure 19: North America Allulose Market Y-o-Y Growth (%) Projections by End-use, 2016-2030
Figure 20: North America Market Volume (MT) Analysis by End-use, 2020 & 2030
Figure 21: North America Allulose Market Attractiveness, by End-use, 2020 to 2030
Figure 22: North America Allulose Market Value Share (%) and BPS Analysis by Country, 2015, 2020 & 2030
Figure 23: North America Allulose Market Y-o-Y Growth (%) Projections by Country, 2020-2030
Figure 24: North America Allulose Market Volume (MT) Analysis by Country, 2020 & 2030
Figure 25: North America Allulose Market Attractiveness, by Country, 2020 to 2030
Figure 26: Latin America Allulose Market Value Share (%) and BPS Analysis by Form, 2015, 2020 & 2030
Figure 27: Latin America Allulose Market Y-o-Y Growth (%) Projections by Form, 2016-2030
Figure 28: Latin America Allulose Market Volume (MT) Analysis by Form, 2020 & 2030
Figure 29: Latin America Allulose Market Attractiveness, by Form, 2020 to 2030
Figure 30: Latin America Allulose Market Value Share (%) and BPS Analysis by End-use, 2015, 2020 & 2030
Figure 31: Latin America Allulose Market Y-o-Y Growth (%) Projections by End-use, 2016-2030
Figure 32: Latin America Allulose Market Volume (MT) Analysis by End-use, 2020 & 2030
Figure 33: Latin America Allulose Market Attractiveness, by End-use, 2020 to 2030
Figure 34: Latin America Allulose Market Value Share (%) and BPS Analysis by Country, 2015, 2020 & 2030
Figure 35: Latin America Allulose Market Y-o-Y Growth (%) Projections by Country, 2020-2030
Figure 36: Latin America Allulose Market Volume (MT) Analysis by Country, 2020 & 2030
Figure 37: Latin America Allulose Market Attractiveness, by Country, 2020 to 2030
Figure 38: East Asia Allulose Market Value Share (%) and BPS Analysis by Form, 2015, 2020 & 2030
Figure 39: East Asia Allulose Market Y-o-Y Growth (%) Projections by Form, 2016-2030
Figure 40: East Asia Allulose Market Volume (MT) Analysis by Form, 2020 & 2030
Figure 41: East Asia Allulose Market Attractiveness, by Form, 2020 to 2030
Figure 42: East Asia Allulose Market Value Share (%) and BPS Analysis by End-use, 2015, 2020 & 2030
Figure 43: East Asia Allulose Market Y-o-Y Growth (%) Projections by End-use, 2016-2030
Figure 44: East Asia Allulose Market Volume (MT) Analysis by End-use, 2020 & 2030
Figure 45: East Asia Allulose Market Attractiveness, by End-use, 2020 to 2030
Figure 46: East Asia Allulose Market Value Share (%) and BPS Analysis by Country, 2015, 2020 & 2030
Figure 47: East Asia Allulose Market Y-o-Y Growth (%) Projections by Country, 2020-2030
Figure 48: East Asia Allulose Market Volume (MT) Analysis by Country, 2020 & 2030
Figure 49: East Asia Allulose Market Attractiveness, by Country, 2020 to 2030
Figure 50: South Asia Allulose Market Value Share (%) and BPS Analysis by Form, 2015, 2020 & 2030
Figure 51: South Asia Allulose Market Y-o-Y Growth (%) Projections by Form, 2016-2030
Figure 52: South Asia Allulose Market Volume (MT) Analysis by Form, 2020 & 2030
Figure 53: South Asia Allulose Market Attractiveness, by Form, 2020 to 2030
Figure 54: South Asia Allulose Market Value Share (%) and BPS Analysis by End-use, 2015, 2020 & 2030
Figure 55: South Asia Allulose Market Y-o-Y Growth (%) Projections by End-use, 2016-2030
Figure 56: South Asia Allulose Market Volume (MT) Analysis by End-use, 2020 & 2030
Figure 57: South Asia Allulose Market Attractiveness, by End-use, 2020 to 2030
Figure 58: South Asia Allulose Market Value Share (%) and BPS Analysis by Region, 2015, 2020 & 2030
Figure 59: South Asia Allulose Market Y-o-Y Growth (%) Projections by Region, 2020-2030
Figure 60: South Asia Allulose Market Volume (MT) Analysis by Region, 2020 & 2030
Figure 61: South Asia Allulose Market Attractiveness, by Region, 2020 to 2030
Figure 62: Oceania Allulose Market Value Share (%) and BPS Analysis by Form, 2015, 2020 & 2030
Figure 63: Oceania Allulose Market Y-o-Y Growth (%) Projections by Form, 2016-2030
Figure 64: Oceania Allulose Market Volume (MT) Analysis by Form, 2020 & 2030
Figure 65: Oceania Allulose Market Attractiveness, by Form, 2020 to 2030
Figure 66: Oceania Allulose Market Value Share (%) and BPS Analysis by End-use, 2015, 2020 & 2030
Figure 67: Oceania Allulose Market Y-o-Y Growth (%) Projections by End-use, 2016-2030
Figure 68: Oceania Allulose Market Volume (MT) Analysis by End-use, 2020 & 2030
Figure 69: Oceania Allulose Market Attractiveness, by End-use, 2020 to 2030
Figure 70: Oceania Allulose Market Value Share (%) and BPS Analysis by Country, 2015, 2020 & 2030
Figure 71: Oceania Allulose Market Y-o-Y Growth (%) Projections by Country, 2020-2030
Figure 72: Oceania Allulose Market Volume (MT) Analysis by Country, 2020 & 2030
Figure 73: Oceania Allulose Market Attractiveness, by Country, 2020 to 2030
Figure 74: MEA Allulose Market Value Share (%) and BPS Analysis by Form, 2015, 2020 & 2030
Figure 75: MEA Allulose Market Y-o-Y Growth (%) Projections by Form, 2016-2030
Figure 76: MEA Allulose Market Volume (MT) Analysis by Form, 2020 & 2030
Figure 77: MEA Allulose Market Attractiveness, by Form, 2020 to 2030
Figure 78: MEA Allulose Market Value Share (%) and BPS Analysis by End-use, 2015, 2020 & 2030
Figure 79: MEA Allulose Market Y-o-Y Growth (%) Projections by End-use, 2016-2030
Figure 80: MEA Allulose Market Volume (MT) Analysis by End-use, 2020 & 2030
Figure 81: MEA Allulose Market Attractiveness, by End-use, 2020 to 2030
Figure 82: MEA Allulose Market Value Share (%) and BPS Analysis by Country, 2015, 2020 & 2030
Figure 83: MEA Allulose Market Y-o-Y Growth (%) Projections by Country, 2020-2030
Figure 84: MEA Allulose Market Volume (MT) Analysis by Country, 2020 & 2030
Figure 85: MEA Allulose Market Attractiveness, by Country, 2020 to 2030
Copyright © Transparency Market Research, Inc. All Rights reserved
Trust Online

Allulose Market