
Reports
Reports
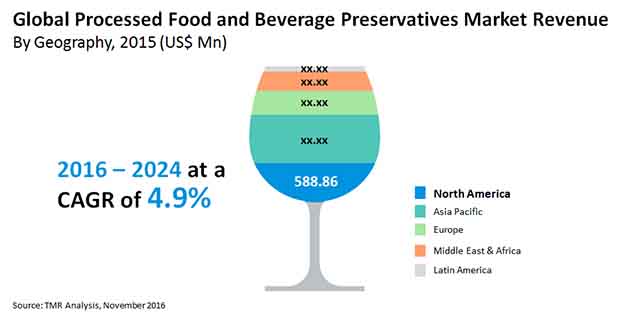
Global Processed Food and Beverage Preservatives Market: Overview
Processed food and beverage preservatives are added to food and beverages to prevent the growth of microorganisms. These preservatives are either natural or synthetic and are known to increase the shelf life of products without impacting the taste, texture, form, and nutritional value of the product. Additionally, they also prevent the product from becoming toxic, thus making them edible for a longer period of time. Owing to these reasons, the research report anticipates that the global processed food and beverage preservatives market is estimated to witness a steady growth. According to the research report, the global processed food and beverage preservative market is expected to reach a valuation of US$2.5 bn by the end of 2024 as compared to US$1.7 bn in 2015. The global market is estimated to progress at a CAGR of 4.9% between 2016 and 2024.
Urbanization Offers Lucrative Opportunities to Global Market
The rapid urbanization and the rise of the working class population are the primary growth drivers for the global market. These reasons have been pivotal to the lack of time available for the preparation of elaborate meals. Thus, several consumers are opting for frozen foods and beverages. The global market is also being driven by the impact of global warming, which has caused climatic changes triggering frequent spoilage of food items. With rising temperatures, it has become crucial to preserve food in the right way to prevent it from turning toxic. Analysts anticipate that the demand for processed food and beverage preservatives is expected will also rise as several consumers are opting for storing food for the sake of convenience.
Out of the natural products used for preserving food and beverages, salt held the lion’s share in the global market, which was closely followed by sugar and vinegar. The research report estimates that rosemary extract segment will be the fastest growing segment in the coming few years. Amongst the synthetic preservatives, benzoate is leading the global market. Sorbate closely follows the lead due to its excessive usage in yogurt, wine, cheese, dried meats, apple cider, and baked goods.
North America to Continue to Grow over Forecast Period
On the basis of geography, the global market is segmented into Europe, Asia Pacific, the Middle East and Africa, North America, and Latin America. Presently, North America has a leading share in the global market due to an exceptionally high demand for packaged foods and beverages by consumers across the region. Several consumers are opting for packaged food items due to their sheer convenience. Analysts anticipate that Asia Pacific will also be an emerging market due to rapid urbanization and changing lifestyle of consumers. Furthermore, the tropical climate of Asia Pacific, which makes food and beverages susceptible to spoilage, will also augment the demand for processed food and beverage preservatives in the region in the coming few years.
Some of the key players in the global processed food and beverage preservatives market are Celanese Corporation, Koninklijke DSM N.V., E. I. du Pont de Nemours and Company, Kerry Group Plc, Shanghai Ruidian Trading Development Co., Galactic SA, Hawkins Watts Limited, Cargill, Incorporated, Innophos Holdings Inc, Kemin Industries, Inc., Akzo Nobel N.V., Albemarle Corporation, Naturalin Bio-Resources Co., Ltd, Shandong Kunda Biotechnology Co., Ltd., Ningbo Pangs Chem Int'l Co., Ltd., Ecochem Group Co., Ltd., and Zhejiang Silver Elephant Bioengineering Co., Ltd.
Processed Food & Beverage Preservatives Market to Attract Higher Revenues from Rising Emphasis towards Dietary Supplements
Processed food and beverage added substances are added to food and beverages to prevent the advancement of microorganisms. These added substances are either typical or fabricated and are known to expand the time frame of ease of use of things without influencing the taste, surface, structure, and solid advantage of the thing. Also, they furthermore hold the thing back from getting harmful, as such making them consumable for a more expanded time period. Owing to these reasons, the investigation report expects that the overall processed food and beverage added substances market is surveyed to notice a predictable turn of events.
The fast urbanization and the ascent of the average populace are the essential development drivers for the worldwide market. These reasons have been vital to the absence of time accessible for the arrangement of expound suppers. In this manner, a few purchasers are selecting frozen foods and beverages. The worldwide market is additionally being driven by the effect of an Earth-wide temperature boost, which has caused climatic changes setting off continuous deterioration of food things. With rising temperatures, it has gotten critical to protect food in the correct manner to keep it from turning poisonous. Examiners expect that the demand for processed food and beverage additives is normal will likewise ascend as a few purchasers are deciding on putting away food for accommodation.
At the cutting edge of driving the overall processed food and beverages additives market is the switching dietary examples of people up the world. With rising globalization and bringing of regulatory obstructions down to trade assorted nations, overall food and beverage associations have entered to each edge of the planet. This has propelled the dietary lives of people, further augmenting the processed food and beverages additives market.
Chapter 1 Preface
1.1 Research Scope
1.2 Market Segmentation
1.3 Research Highlights
Chapter 2 Assumptions and Research Methodology
2.1 Report Assumptions
2.2 Acronyms Used
2.3 Research Methodology
Chapter 3 Executive Summary
3.1 Product Overview
3.2 Market Snapshot
3.3 Key Trends
3.4 Market Opportunity Map
Chapter 4 Market Dynamics
4.1 Introduction
4.2 Drivers and Restraints Snapshot Analysis
4.2.1 Drivers
4.2.2 Restraints
4.2.3 Opportunity
Chapter 5 Processed Food & Beverage Preservatives Market Analysis, by Product Type, 2015–2024
5.1 Introduction
5.2 Global Processed Food & Beverage Preservatives Market Revenue Share Analysis, by Product Type, 2015 & 2024
5.3 Global Processed Food & Beverage Preservatives Market Volume Share Analysis, by Product Type, 2015 & 2024
5.4 Processed Food & Beverage Preservatives Market Analysis, by Product Type, 2015-2024
5.5 Global Processed Food & Beverage Preservatives Market Revenue Share Analysis, by Natural Type, 2015 & 2024
5.6 Global Processed Food & Beverage Preservatives Market Volume Share Analysis, by Natural Type, 2015 & 2024
5.7 Processed Food & Beverage Preservatives Market Analysis, by Natural Type, 2015-2024
5.8 Global Processed Food & Beverage Preservatives Market Revenue Share Analysis, by Synthetic Type, 2015 & 2024
5.9 Global Processed Food & Beverage Preservatives Market Volume Share Analysis, by Synthetic Type, 2015 & 2024
5.10 Processed Food & Beverage Preservatives Market Analysis, by Synthetic Type, 2015-2024
5.11 Global Processed Food & Beverage Preservatives Market Revenue Share Analysis, by Benzoate Type, 2015 & 2024
5.12 Global Processed Food & Beverage Preservatives Market Volume Share Analysis, by Benzoate Type, 2015 & 2024
5.13 Processed Food & Beverage Preservatives Market Analysis, by Benzoate Type, 2015-2024
5.14 Global Processed Food & Beverage Preservatives Market Revenue Share Analysis, by Sulfite Type, 2015 & 2024
5.15 Global Processed Food & Beverage Preservatives Market Volume Share Analysis, by Sulfite Type, 2015 & 2024
5.16 Processed Food & Beverage Preservatives Market Analysis, by Sulfite Type, 2015-2024
5.17 Global Processed Food & Beverage Preservatives Market Revenue Share Analysis, by Sorbate Type, 2015 & 2024
5.18 Global Processed Food & Beverage Preservatives Market Volume Share Analysis, by Sorbate Type, 2015 & 2024
5.19 Processed Food & Beverage Preservatives Market Analysis, by Sorbate Type, 2015-2024
5.20 Processed Food & Beverage Preservatives Market Attractiveness Analysis, by Product Type, 2016-2024
Chapter 6 Processed Food & Beverages Preservatives Market Analysis, by Form
6.1 Global Processed Food & Beverage Preservatives Market Revenue Share Analysis, by Form, 2015 & 2024
6.2 Global Processed Food & Beverage Preservatives Market Volume Share Analysis, by Form, 2015 & 2024
6.3 Global Processed Food & Beverage Preservatives Market Analysis, by Form
6.4 Processed Food & Beverage Preservatives Market Attractiveness Analysis, by Form, 2016-2024
Chapter 7 Processed Food & Beverage Preservatives Market Analysis, by Function
7.1 Introduction
7.2 Global Processed Food & Beverage Preservatives Market Revenue Share Analysis, by Function
7.3 Global Processed Food & Beverage Preservatives Market Volume Share Analysis, by Function
7.4 Processed Food & Beverage Preservatives Market Analysis, by Function
7.5 Processed Food & Beverage Preservatives Market Attractiveness Analysis, by Function, 2016-2024
Chapter 8 Processed Food & Beverage Preservatives Market Analysis, by Application
8.1 Introduction
8.2 Global Processed Food & Beverage Preservatives Market Revenue Share Analysis, by Application
8.3 Global Processed Food & Beverage Preservatives Market Volume Share Analysis, by Application
8.4 Global Processed Food & Beverage Preservatives Market Analysis, by Application
8.5 Processed Food & Beverage Preservatives Market Attractiveness Analysis, by Application, 2016-2024
Chapter 9 Processed Food & Beverage Preservatives Market Analysis, by Region
9.1 Geographical Scenario
9.2 Introduction
9.3 Global Processed Food & Beverage Preservatives Market Revenue Share Analysis, by Region
9.4 Global Processed Food & Beverage Preservatives Market Volume Share Analysis, by Region
9.5 Global Processed Food & Beverage Preservatives Market Revenue Forecast, by Region
9.6 Global Processed Food & Beverage Preservatives Market Volume Forecast, by Region
9.7 Processed Food & Beverage Preservatives Market Attractiveness Analysis, by Region, 2016-2024
Chapter 10 North America Processed Food & Beverage Preservatives Market Analysis, 2016–2024
10.1 North America Processed Food & Beverage Preservatives Market Revenue Share Analysis, by Product Type, 2015 & 2024
10.2 North America Processed Food & Beverage Preservatives Market Volume Share Analysis, by Product Type, 2015 & 2024
10.3 North America Processed Food & Beverage Preservatives Market Revenue Forecast, by Product Type, 2016–2024
10.4 North America Processed Food & Beverage Preservatives Market Volume Forecast, by Product Type, 2015–2024
10.5 North America Processed Food & Beverage Preservatives Market Revenue Share Analysis, by Natural Type, 2015 & 2024
10.6 North America Processed Food & Beverage Preservatives Market Volume Share Analysis, by Natural Type, 2015 & 2024
10.7 North America Processed Food & Beverage Preservatives Market Revenue Forecast, by Natural Type, 2015–2024
10.8 North America Processed Food & Beverage Preservatives Market Volume Forecast, by Natural Type, 2015–2024
10.9 North America Processed Food & Beverage Preservatives Market Revenue Share Analysis, by Synthetic Type, 2015 & 2024
10.10 North America Processed Food & Beverage Preservatives Market Volume Share Analysis, by Synthetic Type, 2015 & 2024
10.11 North America Processed Food & Beverage Preservatives Market Revenue Forecast, by Synthetic Type, 2015–2024
10.12 North America Processed Food & Beverage Preservatives Market Volume Forecast, by Synthetic Type, 2015–2024
10.13 North America Processed Food & Beverage Preservatives Market Revenue Share Analysis, by Benzoate Type, 2015 & 2024
10.14 North America Processed Food & Beverage Preservatives Market Volume Share Analysis, by Benzoate Type, 2015 & 2024
10.15 North America Processed Food & Beverage Preservatives Market Revenue Forecast, by Benzoate Type, 2015–2024
10.16 North America Processed Food & Beverage Preservatives Market Volume Forecast, by Benzoate Type, 2015–2024
10.17 North America Processed Food & Beverage Preservatives Market Revenue Share Analysis, by Sulfite Type, 2015 & 2024
10.18 North America Processed Food & Beverage Preservatives Market Volume Share Analysis, by Sulfite Type, 2015 & 2024
10.19 North America Processed Food & Beverage Preservatives Market Revenue Forecast, by Sulfite Type, 2015–2024
10.20 North America Processed Food & Beverage Preservatives Market Volume Forecast, by Sulfite Type, 2015–2024
10.21 North America Processed Food & Beverage Preservatives Market Revenue Share Analysis, by Sorbate Type, 2015 & 2024
10.22 North America Processed Food & Beverage Preservatives Market Volume Share Analysis, by Sorbate Type, 2015 & 2024
10.23 North America Processed Food & Beverage Preservatives Market Revenue Forecast, by Sorbate Type, 2015–2024
10.24 North America Processed Food & Beverage Preservatives Market Volume Forecast, by Sorbate Type, 2015–2024
10.25 North America Processed Food & Beverage Preservatives Market Revenue Share Analysis, by Form, 2015 & 2024
10.26 North America Processed Food & Beverage Preservatives Market Volume Share Analysis, by Form, 2015 & 2024
10.27 North America Processed Food & Beverage Preservatives Market Revenue Forecast, by Form, 2015–2024
10.28 North America Processed Food & Beverage Preservatives Market Volume Forecast, by Form, 2015–2024
10.29 North America Processed Food & Beverage Preservatives Market Revenue Share Analysis, by Function, 2015 & 2024
10.30 North America Processed Food & Beverage Preservatives Market Volume Share Analysis, by Function, 2015 & 2024
10.31 North America Processed Food & Beverage Preservatives Market Revenue Forecast, by Function, 2015–2024
10.32 North America Processed Food & Beverage Preservatives Market Volume, Forecast, by Function, 2015–2024
10.33 North America Processed Food & Beverage Preservatives Market Revenue Share Analysis, by Application, 2015 & 2024
10.34 North America Processed Food & Beverage Preservatives Market Volume Share Analysis, by Application, 2015 & 2024
10.35 North America Processed Food & Beverage Preservatives Market Revenue , Forecast by Application, 2015–2024
10.36 North America Processed Food & Beverage Preservatives Market Volume, Forecast by Application, 2015–2024
10.37 North America Processed Food & Beverage Preservatives Market Revenue Share Analysis, by Country, 2015 & 2024
10.38 North America Processed Food & Beverage Preservatives Market Volume Share Analysis, by Country, 2015 & 2024
10.39 North America Processed Food & Beverage Preservatives Market Revenue , Forecast by Country, 2015–2024
10.40 North America Processed Food & Beverage Preservatives Market Volume Forecast, by Country, 2015–2024
Chapter 11 Europe Processed Food & Beverage Preservatives Market Analysis, 2015–2024
11.1 Europe Processed Food & Beverage Preservatives Market Revenue Share Analysis, by Product Type, 2015 & 2024
11.2 Europe Processed Food & Beverage Preservatives Market Volume Share Analysis, by Product Type, 2015 & 2024
11.3 Europe Processed Food & Beverage Preservatives Market Revenue Forecast, by Product Type, 2016–2024
11.4 Europe Processed Food & Beverage Preservatives Market Volume Forecast, by Product Type, 2015–2024
11.5 Europe Processed Food & Beverage Preservatives Market Revenue Share Analysis, by Natural Type, 2015 & 2024
11.6 Europe Processed Food & Beverage Preservatives Market Volume Share Analysis, by Natural Type, 2015 & 2024
11.7 Europe Processed Food & Beverage Preservatives Market Revenue Forecast, by Natural Type, 2015–2024
11.8 Europe Processed Food & Beverage Preservatives Market Volume Forecast, by Natural Type, 2015–2024
11.9 Europe Processed Food & Beverage Preservatives Market Revenue Share Analysis, by Synthetic Type, 2015 & 2024
11.10 Europe Processed Food & Beverage Preservatives Market Volume Share Analysis, by Synthetic Type, 2015 & 2024
11.11 Europe Processed Food & Beverage Preservatives Market Revenue Forecast, by Synthetic Type, 2015–2024
11.12 Europe Processed Food & Beverage Preservatives Market Volume Forecast, by Synthetic Type, 2015–2024
11.13 Europe Processed Food & Beverage Preservatives Market Revenue Share Analysis, by Benzoate Type, 2015 & 2024
11.14 Europe Processed Food & Beverage Preservatives Market Volume Share Analysis, by Benzoate Type, 2015 & 2024
11.15 Europe Processed Food & Beverage Preservatives Market Revenue Forecast, by Benzoate Type, 2015–2024
11.16 Europe Processed Food & Beverage Preservatives Market Volume Forecast, by Benzoate Type, 2015–2024
11.17 Europe Processed Food & Beverage Preservatives Market Revenue Share Analysis, by Sulfite Type, 2015 & 2024
11.18 Europe Processed Food & Beverage Preservatives Market Volume Share Analysis, by Sulfite Type, 2015 & 2024
11.19 Europe Processed Food & Beverage Preservatives Market Revenue Forecast, by Sulfite Type, 2015–2024
11.20 Europe Processed Food & Beverage Preservatives Market Volume Forecast, by Sulfite Type, 2015–2024
11.21 Europe Processed Food & Beverage Preservatives Market Revenue Share Analysis, by Sorbate Type, 2015 & 2024
11.22 Europe Processed Food & Beverage Preservatives Market Volume Share Analysis, By Sorbate Type, 2015 & 2024
11.23 Europe Processed Food & Beverage Preservatives Market Revenue, Forecast by Sorbate Type, 2015 - 2024
11.24 Europe Processed Food & Beverage Preservatives Market Volume, Forecast by Sorbate Type, 2015 – 2024
11.25 Europe Processed Food & Beverage Preservatives Market Revenue Share Analysis, By Form, 2015 & 2024
11.26 Europe Processed Food & Beverage Preservatives Market Volume Share Analysis, By Form, 2015 & 2024
11.27 Europe Processed Food & Beverage Preservatives Market Revenue, Forecast by Form, 2015 – 2024
11.28 Europe Processed Food & Beverage Preservatives Market Volume, Forecast by Form, 2015 - 2024
11.29 Europe Processed Food & Beverage Preservatives Market Revenue Share Analysis, By Function, 2015 & 2024
11.30 Europe Processed Food & Beverage Preservatives Market Volume Share Analysis, By Function, 2015 & 2024
11.31 Europe Processed Food & Beverage Preservatives Market Revenue, Forecast by Function, 2015 – 2024
11.32 Europe Processed Food & Beverage Preservatives Market Volume, Forecast by Function, 2015 – 2024
11.33 Europe Processed Food & Beverage Preservatives Market Revenue Share Analysis, By Application, 2015 & 2024
11.34 Europe Processed Food & Beverage Preservatives Market Volume Share Analysis, By Application, 2015 & 2024
11.35 Europe Processed Food & Beverage Preservatives Market Revenue, Forecast by Application, 2015 – 2024
11.36 Europe Processed Food & Beverage Preservatives Market Volume, Forecast by Application, 2015 – 2024
11.37 Europe Processed Food & Beverage Preservatives Market Revenue Share Analysis, By Country, 2015 & 2024
11.38 Europe Processed Food & Beverage Preservatives Market Volume Share Analysis, By Country, 2015 & 2024
11.39 Europe Processed Food & Beverage Preservatives Market Revenue, Forecast by Country, 2015 – 2024
11.40 Europe Processed Food & Beverage Preservatives Market Volume, Forecast by Country, 2015 – 2024
Chapter 12 Asia Pacific Processed Food & Beverage Preservatives Market Analysis, 2015-2024
12.1 Asia Pacific Processed Food & Beverage Preservatives Market Revenue Share Analysis, by Product Type, 2015 & 2024
12.2 Asia Pacific Processed Food & Beverage Preservatives Market Volume Share Analysis, by Product Type, 2015 & 2024
12.3 Asia Pacific Processed Food & Beverage Preservatives Revenue Market, Forecast by Product Type, 2015 – 2024
12.4 Asia Pacific Processed Food & Beverage Preservatives Volume Market, Forecast by Product Type, 2015 - 2024
12.5 Asia Pacific Processed Food & Beverage Preservatives Market Revenue Share Analysis, by Natural Type, 2015 & 2024
12.6 Asia Pacific Processed Food & Beverage Preservatives Market Volume Share Analysis, by Natural Type, 2015 & 2024
12.7 Asia Pacific Processed Food & Beverage Preservatives Revenue Market, Forecast by Natural Type, 2015 – 2024
12.8 Asia Pacific Processed Food & Beverage Preservatives Volume Market, Forecast by Natural Type, 2015 - 2024
12.9 Asia Pacific Processed Food & Beverage Preservatives Market Revenue Share Analysis, by Synthetic Type, 2015 & 2024
12.10 Asia Pacific Processed Food & Beverage Preservatives Market Volume Share Analysis, by Synthetic Type, 2015 & 2024
12.11 Asia Pacific Processed Food & Beverage Preservatives Revenue Market, Forecast by Synthetic Type, 2015 – 2024
12.12 Asia Pacific Processed Food & Beverage Preservatives Volume Market, Forecast by Synthetic Type, 2015 - 2024
12.13 Asia Pacific Processed Food & Beverage Preservatives Market Revenue Share Analysis, by Benzoate Type, 2015 & 2024
12.14 Asia Pacific Processed Food & Beverage Preservatives Market Volume Share Analysis, by Benzoate Type, 2015 & 2024
12.15 Asia Pacific Processed Food & Beverage Preservatives Revenue Market, Forecast by Benzoate Type, 2015 – 2024
12.16 Asia Pacific Processed Food & Beverage Preservatives Volume Market, Forecast by Benzoate Type, 2015 - 2024
12.17 Asia Pacific Processed Food & Beverage Preservatives Market Revenue Share Analysis, by Sulfite Type, 2015 & 2024
12.18 Asia Pacific Processed Food & Beverage Preservatives Market Volume Share Analysis, by Sulfite Type, 2015 & 2024
12.19 Asia Pacific Processed Food & Beverage Preservatives Revenue Market, Forecast by Sulfite Type, 2015 – 2024
12.20 Asia Pacific Processed Food & Beverage Preservatives Volume Market, Forecast by Sulfite Type, 2015 – 2024
12.21 Asia Pacific Processed Food & Beverage Preservatives Market Revenue Share Analysis, by Sorbate Type, 2015 & 2024
12.22 Asia Pacific Processed Food & Beverage Preservatives Market Volume Share Analysis, by Sorbate Type, 2015 & 2024
12.23 Asia Pacific Processed Food & Beverage Preservatives Revenue Market, Forecast by Sorbate Type, 2015 – 2024
12.24 Asia Pacific Processed Food & Beverage Preservatives Volume Market, Forecast by Sorbate Type, 2015 – 2024
12.25 Asia Pacific Processed Food & Beverage Preservatives Market Revenue Share Analysis, by Form, 2015 & 2024
12.26 Asia Pacific Processed Food & Beverage Preservatives Market Volume Share Analysis, by Form, 2015 & 2024
12.27 Asia Pacific Processed Food & Beverage Preservatives Revenue Market, Forecast by Form, 2015 – 2024
12.28 Asia Pacific Processed Food & Beverage Preservatives Volume Market, Forecast by Form, 2015 – 2024
12.29 Asia Pacific Processed Food & Beverage Preservatives Market Revenue Share Analysis, by Function, 2015 & 2024
12.30 Asia Pacific Processed Food & Beverage Preservatives Market Volume Share Analysis, by Function, 2015 & 2024
12.31 Asia Pacific Processed Food & Beverage Preservatives Revenue Market, Forecast by Function, 2015 – 2024
12.32 Asia Pacific Processed Food & Beverage Preservatives Volume Market, Forecast by Function, 2015 – 2024
12.33 Asia Pacific Processed Food & Beverage Preservatives Market Revenue Share Analysis, by Application, 2015 & 2024
12.34 Asia Pacific Processed Food & Beverage Preservatives Market Volume Share Analysis, by Application, 2015 & 2024
12.35 Asia Pacific Processed Food & Beverage Preservatives Revenue Market, Forecast by Application, 2015 – 2024
12.36 Asia Pacific Processed Food & Beverage Preservatives Volume Market, Forecast by Application, 2015 – 2024
12.37 Asia Pacific Processed Food & Beverage Preservatives Market Revenue Share Analysis, by Country, 2015 & 2024
12.38 Asia Pacific Processed Food & Beverage Preservatives Market Volume Share Analysis, by Country, 2015 & 2024
12.39 Asia Pacific Processed Food & Beverage Preservatives Revenue Market, Forecast by Country, 2015 – 2024
12.40 Asia Pacific Processed Food & Beverage Preservatives Volume Market, Forecast by Country, 2015 – 2024
Chapter 13 Middle East and Africa Processed Food & Beverage Preservatives Market Analysis, 2015-2024
13.1 Middle East and Africa Processed Food & Beverage Preservatives Market Revenue Share Analysis, by Product Type, 2015 & 2024
13.2 Middle East and Africa Processed Food & Beverage Preservatives Market Volume Share Analysis, by Product Type, 2015 & 2024
13.3 Middle East and Africa Processed Food & Beverage Preservatives Revenue Market, Forecast by Product Type, 2015 – 2024
13.4 Middle East and Africa Processed Food & Beverage Preservatives Volume Market, Forecast by Product Type, 2015 – 2024
13.5 Middle East and Africa Processed Food & Beverage Preservatives Market Revenue Share Analysis, by Natural Type, 2015 & 2024
13.6 Middle East and Africa Processed Food & Beverage Preservatives Market Volume Share Analysis, by Natural Type, 2015 & 2024
13.7 Middle East and Africa Processed Food & Beverage Preservatives Revenue Market, Forecast by Natural Type, 2015 – 2024
13.8 Middle East and Africa Processed Food & Beverage Preservatives Volume Market, Forecast by Natural Type, 2015 – 2024
13.9 Middle East and Africa Processed Food & Beverage Preservatives Market Revenue Share Analysis, by Synthetic Type, 2015 & 2024
13.10 Middle East and Africa Processed Food & Beverage Preservatives Market Volume Share Analysis, by Synthetic Type, 2015 & 2024
13.11 Middle East and Africa Processed Food & Beverage Preservatives Revenue Market, Forecast by Synthetic Type, 2015 – 2024
13.12 Middle East and Africa Processed Food & Beverage Preservatives Volume Market, Forecast by Synthetic Type, 2015 – 2024
13.13 Middle East and Africa Processed Food & Beverage Preservatives Market Revenue Share Analysis, by Benzoate Type, 2015 & 2024
13.14 Middle East and Africa Processed Food & Beverage Preservatives Market Volume Share Analysis, by Benzoate Type, 2015 & 2024
13.15 Middle East and Africa Processed Food & Beverage Preservatives Revenue Market, Forecast by Benzoate Type, 2015 – 2024
13.16 Middle East and Africa Processed Food & Beverage Preservatives Volume Market, Forecast by Benzoate Type, 2015 – 2024
13.17 Middle East and Africa Processed Food & Beverage Preservatives Market Revenue Share Analysis, by Sulfite Type, 2015 & 2024
13.18 Middle East and Africa Processed Food & Beverage Preservatives Market Volume Share Analysis, by Sulfite Type, 2015 & 2024
13.19 Middle East and Africa Processed Food & Beverage Preservatives Revenue Market, Forecast by Sulfite Type, 2015 – 2024
13.20 Middle East and Africa Processed Food & Beverage Preservatives Volume Market, Forecast by Sulfite Type, 2015 – 2024
13.21 Middle East and Africa Processed Food & Beverage Preservatives Market Revenue Share Analysis, by Sorbate Type, 2015 & 2024
13.22 Middle East and Africa Processed Food & Beverage Preservatives Market Volume Share Analysis, by Sorbate Type, 2015 & 2024
13.23 Middle East and Africa Processed Food & Beverage Preservatives Revenue Market, Forecast by Sorbate Type, 2015 – 2024
13.24 Middle East and Africa Processed Food & Beverage Preservatives Volume Market, Forecast by Sorbate Type, 2015 – 2024
13.25 Middle East and Africa Processed Food & Beverage Preservatives Market Revenue Share Analysis, by Form, 2015 & 2024
13.26 Middle East and Africa Processed Food & Beverage Preservatives Market Volume Share Analysis, by Form, 2015 & 2024
13.27 Middle East and Africa Processed Food & Beverage Preservatives Revenue Market, Forecast by Form, 2015 – 2024
13.28 Middle East and Africa Processed Food & Beverage Preservatives Volume Market, Forecast by Form, 2015 – 2024
13.29 Middle East and Africa Processed Food & Beverage Preservatives Market Revenue Share Analysis, by Function, 2015 & 2024
13.30 Middle East and Africa Processed Food & Beverage Preservatives Market Volume Share Analysis, by Function, 2015 & 2024
13.31 Middle East and Africa Processed Food & Beverage Preservatives Revenue Market, Forecast by Function, 2015 – 2024
13.32 Middle East and Africa Processed Food & Beverage Preservatives Volume Market, Forecast by Function, 2015 – 2024
13.33 Middle East and Africa Processed Food & Beverage Preservatives Market Revenue Share Analysis, by Application, 2015 & 2024
13.34 Middle East and Africa Processed Food & Beverage Preservatives Market Volume Share Analysis, by Application, 2015 & 2024
13.35 Middle East and Africa Processed Food & Beverage Preservatives Revenue Market, Forecast by Application, 2015 – 2024
13.36 Middle East and Africa Processed Food & Beverage Preservatives Volume Market, Forecast by Application, 2015 – 2024
13.37 Middle East and Africa Processed Food & Beverage Preservatives Market Revenue Share Analysis, by Country, 2015 & 2024
13.38 Middle East and Africa Processed Food & Beverage Preservatives Market Volume Share Analysis, by Country, 2015 & 2024
13.39 Middle East and Africa Processed Food & Beverage Preservatives Revenue Market, Forecast by Country, 2015 – 2024
13.40 Middle East and Africa Processed Food & Beverage Preservatives Volume Market, Forecast by Country, 2015 – 2024
Chapter 14 Latin America Processed Food & Beverage Preservatives Market Analysis, 2015-2024
14.1 Latin America Processed Food & Beverage Preservatives Market Revenue Share Analysis, by Product Type, 2015 & 2024
14.2 Latin America Processed Food & Beverage Preservatives Market Volume Share Analysis, by Product Type, 2015 & 2024
14.3 Latin America Processed Food & Beverage Preservatives Revenue Market, Forecast by Product Type, 2015 – 2024
14.4 Latin America Processed Food & Beverage Preservatives Volume Market, Forecast by Product Type, 2015 – 2024
14.5 Latin America Processed Food & Beverage Preservatives Market Revenue Share Analysis, by Natural Type, 2015 & 2024
14.6 Latin America Processed Food & Beverage Preservatives Market Volume Share Analysis, by Natural Type, 2015 & 2024
14.7 Latin America Processed Food & Beverage Preservatives Revenue Market, Forecast by Natural Type, 2015 – 2024
14.8 Latin America Processed Food & Beverage Preservatives Volume Market, Forecast by Natural Type, 2015 – 2024
14.9 Latin America Processed Food & Beverage Preservatives Market Revenue Share Analysis, by Synthetic Type, 2015 & 2024
14.10 Latin America Processed Food & Beverage Preservatives Market Volume Share Analysis, by Synthetic Type, 2015 & 2024
14.11 Latin America Processed Food & Beverage Preservatives Revenue Market, Forecast by Synthetic Type, 2015 – 2024
14.12 Latin America Processed Food & Beverage Preservatives Volume Market, Forecast by Product Type, 2015 – 2024
14.13 Latin America Processed Food & Beverage Preservatives Market Revenue Share Analysis, by Benzoate Type, 2015 & 2024
14.14 Latin America Processed Food & Beverage Preservatives Market Volume Share Analysis, by Benzoate Type, 2015 & 2024
14.15 Latin America Processed Food & Beverage Preservatives Revenue Market, Forecast by Benzoate Type, 2015 – 2024
14.16 Latin America Processed Food & Beverage Preservatives Volume Market, Forecast by Benzoate Type, 2015 – 2024
14.17 Latin America Processed Food & Beverage Preservatives Market Revenue Share Analysis, by Sulfite Type, 2015 & 2024
14.18 Latin America Processed Food & Beverage Preservatives Market Volume Share Analysis, by Sulfite Type, 2015 & 2024
14.19 Latin America Processed Food & Beverage Preservatives Revenue Market, Forecast by Sulfite Type, 2015 – 2024
14.20 Latin America Processed Food & Beverage Preservatives Volume Market, Forecast by Sulfite Type, 2015 – 2024
14.21 Latin America Processed Food & Beverage Preservatives Market Revenue Share Analysis, by Sorbate Type, 2015 & 2024
14.22 Latin America Processed Food & Beverage Preservatives Market Volume Share Analysis, by Sorbate Type, 2015 & 2024
14.23 Latin America Processed Food & Beverage Preservatives Revenue Market, Forecast by Sorbate Type, 2015 – 2024
14.24 Latin America Processed Food & Beverage Preservatives Volume Market, Forecast by Sorbate Type, 2015 – 2024
14.25 Latin America Processed Food & Beverage Preservatives Market Revenue Share Analysis, by Form, 2015 & 2024
14.26 Latin America Processed Food & Beverage Preservatives Market Volume Share Analysis, by Form, 2015 & 2024
14.27 Latin America Processed Food & Beverage Preservatives Revenue Market, Forecast by Form, 2015 – 2024
14.28 Latin America Processed Food & Beverage Preservatives Volume Market, Forecast by Form, 2015 - 2024
14.29 Latin America Processed Food & Beverage Preservatives Market Revenue Share Analysis, by Function, 2015 & 2024
14.30 Latin America Processed Food & Beverage Preservatives Market Volume Share Analysis, by Function, 2015 & 2024
14.31 Latin America Processed Food & Beverage Preservatives Revenue Market, Forecast by Function, 2015 – 2024
14.32 Latin America Processed Food & Beverage Preservatives Volume Market, Forecast by Function, 2015 – 2024
14.33 Latin America Processed Food & Beverage Preservatives Market Revenue Share Analysis, by Application, 2015 & 2024
14.34 Latin America Processed Food & Beverage Preservatives Market Volume Share Analysis, by Application, 2015 & 2024
14.35 Latin America Processed Food & Beverage Preservatives Revenue Market, Forecast by Application, 2015 – 2024
14.36 Latin America Processed Food & Beverage Preservatives Volume Market, Forecast by Application, 2015 – 2024
14.37 Latin America Processed Food & Beverage Preservatives Market Revenue Share Analysis, by Country, 2015 & 2024
14.38 Latin America Processed Food & Beverage Preservatives Market Volume Share Analysis, by Country, 2015 & 2024
14.39 Latin America Processed Food & Beverage Preservatives Revenue Market, Forecast by Country, 2015 – 2024
14.40 Latin America Processed Food & Beverage Preservatives Volume Market, Forecast by Country, 2015 - 2024
Chapter 15 Company Profiles
15.1 Celanese Corporation
Company Details (HQ, Foundation Year, Employee Strength)
Market Presence, By Segment and Geography
SWOT Analysis
Strategic Overview
Revenue and Net Sales
15.2 Koninklijke DSM N.V.
Company Details (HQ, Foundation Year, Employee Strength)
Market Presence, By Segment and Geography
SWOT Analysis
Strategic Overview
Revenue and Net Sales
15.3 E. I. du Pont de Nemours and Company
Company Details (HQ, Foundation Year, Employee Strength)
Market Presence, By Segment and Geography
SWOT Analysis
Strategic Overview
Revenue and Net Sales
15.4 Kerry Group Plc
Company Details (HQ, Foundation Year, Employee Strength)
Market Presence, By Segment and Geography
SWOT Analysis
Strategic Overview
Revenue and Net Sales
15.5 Galactic SA
Company Details (HQ, Foundation Year, Employee Strength)
Market Presence, By Segment and Geography
SWOT Analysis
Strategic Overview
Revenue and Net Sales
15.6 Hawkins Watts Limited
Company Details (HQ, Foundation Year, Employee Strength)
Market Presence, By Segment and Geography
SWOT Analysis
Strategic Overview
Revenue and Net Sales
15.7 Innophos Holdings Inc
Company Details (HQ, Foundation Year, Employee Strength)
Market Presence, By Segment and Geography
SWOT Analysis
Strategic Overview
Revenue and Net Sales
15.8 Kemin Industries, Inc.
Company Details (HQ, Foundation Year, Employee Strength)
Market Presence, By Segment and Geography
SWOT Analysis
Strategic Overview
Revenue and Net Sales
15.9 Cargill, Incorporated
Company Details (HQ, Foundation Year, Employee Strength)
Market Presence, By Segment and Geography
SWOT Analysis
Strategic Overview
Revenue and Net Sales
15.10 Akzo Nobel N.V.
Company Details (HQ, Foundation Year, Employee Strength)
Market Presence, By Segment and Geography
SWOT Analysis
Strategic Overview
Revenue and Net Sales
15.11 Albemarle Corporation
Company Details (HQ, Foundation Year, Employee Strength)
Market Presence, By Segment and Geography
SWOT Analysis
Strategic Overview
Revenue and Net Sales
15.12 Naturalin Bio-Resources Co., Ltd
Company Details (HQ, Foundation Year, Employee Strength)
Market Presence, By Segment and Geography
SWOT Analysis
Strategic Overview
Revenue and Net Sales
15.13 Shandong Kunda Biotechnology Co., Ltd.
Company Details (HQ, Foundation Year, Employee Strength)
Market Presence, By Segment and Geography
SWOT Analysis
Strategic Overview
Revenue and Net Sales
15.14 Shanghai Ruidian Trading Development Co.
Company Details (HQ, Foundation Year, Employee Strength)
Market Presence, By Segment and Geography
SWOT Analysis
Strategic Overview
Revenue and Net Sales
15.15 Ecochem Group Co., Ltd
Company Details (HQ, Foundation Year, Employee Strength)
Market Presence, By Segment and Geography
SWOT Analysis
Strategic Overview
Revenue and Net Sales
15.16 Ningbo Pangs Chem Int'l Co., Ltd.
Company Details (HQ, Foundation Year, Employee Strength)
Market Presence, By Segment and Geography
SWOT Analysis
Strategic Overview
Revenue and Net Sales
15.17 Zhejiang Silver Elephant Bioengineering Co., Ltd.
Company Details (HQ, Foundation Year, Employee Strength)
Market Presence, By Segment and Geography
SWOT Analysis
Strategic Overview
Revenue and Net Sales
15.18 Shandong Tong Tai Wei Run Chemical Co., Ltd.
Company Details (HQ, Foundation Year, Employee Strength)
Market Presence, By Segment and Geography
SWOT Analysis
Strategic Overview
Revenue and Net Sales
15.19 Laiwu Taihe Biochemistry Co., Ltd.
Company Details (HQ, Foundation Year, Employee Strength)
Market Presence, By Segment and Geography
SWOT Analysis
Strategic Overview
Revenue and Net Sales
15.20 SEEBIO BIOTECH (SHANGHAI) CO.,LTD.
Company Details (HQ, Foundation Year, Employee Strength)
Market Presence, By Segment and Geography
SWOT Analysis
Strategic Overview
Revenue and Net Sales
List of Tables
1 Global Processed Food & Beverage Preservatives Market Revenue (US$ Mn) Forecast, by Region, 2015–2024
2 Global Processed Food & Beverage Preservatives Market Volume (Kilo Tons) Forecast, by Region, 2015–2024
3 North America Processed Food & Beverage Preservatives Market Revenue (US$ Mn) Forecast, by Product Type, 2015–2024
4 North America Processed Food & Beverage Preservatives Market Volume (kilo tons) Forecast, by Product Type, 2015–2024
5 North America Processed Food & Beverage Preservatives Market Revenue (US$ Mn) Forecast, by Natural Type, 2015–2024
6 North America Processed Food & Beverage Preservatives Market Volume (kilo tons) Forecast, by Natural Type, 2015–2024
7 North America Processed Food & Beverage Preservatives Market Revenue (US$ Mn) Forecast, by Synthetic Type, 2015–2024
8 North America Processed Food & Beverage Preservatives Market Volume (kilo tons) Forecast, by Synthetic Type, 2015–2024
9 North America Processed Food & Beverage Preservatives Market Revenue (US$ Mn) Forecast, by Benzoate Type, 2015–2024
10 North America Processed Food & Beverage Preservatives Market Volume (kilo tons) Forecast, by Benzoate Type, 2015–2024
11 North America Processed Food & Beverage Preservatives Market Revenue (US$ Mn) Forecast, by Sulfite Type, 2015–2024
12 North America Processed Food & Beverage Preservatives Market Volume (Kilo Tons) Forecast, by Sulfite Type, 2015–2024
13 North America Processed Food & Beverage Preservatives Market Revenue (US$ Mn) Forecast, by Sorbate Type, 2015–2024
14 North America Processed Food & Beverage Preservatives Market Volume (Kilo Tons) Forecast, by Sorbate Type, 2015–2024
15 North America Processed Food & Beverage Preservatives Market Revenue (US$ Mn) Forecast, by Form, 2015–2024
16 North America Processed Food & Beverage Preservatives Market Volume (Kilo Tons) Forecast, by Form, 2015–2024
17 North America Processed Food & Beverage Preservatives Market Revenue (US$ Mn) Forecast, by Function, 2015–2024
18 North America Processed Food & Beverage Preservatives Market Volume (Kilo Tons) Forecast, by Function, 2015–2024
19 North America Processed Food & Beverage Preservatives Market Revenue (US$ Mn) Forecast, by Application, 2015–2024
20 North America Processed Food & Beverage Preservatives Market Volume (Kilo Tons) Forecast, by Application, 2015–2024
21 North America Processed Food & Beverage Preservatives Market Revenue (US$ Mn) Forecast, by Country, 2015–2024
22 North America Processed Food & Beverage Preservatives Market Volume (Kilo tons) Forecast, by Country, 2015–2024
23 Europe Processed Food & Beverage Preservatives Market Revenue (US$ Mn) Forecast, by Product Type, 2015–2024
24 Europe Processed Food & Beverage Preservatives Market Volume (Kilo Tons) Forecast, by Product Type, 2015–2024
25 Europe Processed Food & Beverage Preservatives Market Revenue (US$ Mn) Forecast, by Natural Type, 2015–2024
26 Europe Processed Food & Beverage Preservatives Market Volume (Kilo Tons) Forecast, by Natural Type, 2015–2024
27 Europe Processed Food & Beverage Preservatives Market Revenue (US$ Mn) Forecast, by Synthetic Type, 2015–2024
28 Europe Processed Food & Beverage Preservatives Market Volume (Kilo Tons) Forecast, by Synthetic Type, 2015–2024
29 Europe Processed Food & Beverage Preservatives Market Revenue (US$ Mn), Forecast by Benzoate Type, 2015–2024
30 Europe Processed Food & Beverage Preservatives Market Volume (Kilo Tons) Forecast, by Benzoate Type, 2015–2024
31 Europe Processed Food & Beverage Preservatives Market Revenue (US$ Mn) Forecast, by Sulfite Type, 2015–2024
32 Europe Processed Food & Beverage Preservatives Market Volume (Kilo Tons) Forecast, by Sulfite Type, 2015–2024
33 Europe Processed Food & Beverage Preservatives Market Revenue (US$ Mn), Forecast by Sorbate Type, 2015 – 2024
34 Europe Processed Food & Beverage Preservatives Market Volume (Kilo Tons), Forecast by Sorbate Type, 2015 – 2024
35 Europe Processed Food & Beverage Preservatives Market Revenue (US$ Mn), Forecast by Form, 2015 – 2024
36 Europe Processed Food & Beverage Preservatives Market Volume (Kilo Tons), Forecast by Form, 2015 – 2024
37 Europe Processed Food & Beverage Preservatives Market Revenue (US$ Mn), Forecast by Function, 2015 – 2024
38 Europe Processed Food & Beverage Preservatives Market Volume (Kilo Tons), Forecast by Function, 2015 – 2024
39 Europe Processed Food & Beverage Preservatives Market Revenue (US$ Mn), Forecast by Application, 2015 – 2024
40 Europe Processed Food & Beverage Preservatives Market Volume (Kilo Tons), Forecast by Application, 2015 – 2024
41 Europe Processed Food & Beverage Preservatives Market Revenue (US$ Mn), Forecast by Country, 2015 – 2024
42 Europe Processed Food & Beverage Preservatives Market Volume (Kilo tons), Forecast by Country, 2015 – 2024
43 Asia Pacific Processed Food & Beverage Preservatives Revenue Market (US$ Mn), Forecast by Product Type, 2015 – 2024
44 Asia Pacific Processed Food & Beverage Preservatives Volume Market (Kilo Tons), Forecast by Product Type, 2015 – 2024
45 Asia Pacific Processed Food & Beverage Preservatives Revenue Market (US$ Mn), Forecast by Natural Type, 2015 – 2024
46 Asia Pacific Processed Food & Beverage Preservatives Volume Market (Kilo Tons), Forecast by Natural Type, 2015 – 2024
47 Asia Pacific Processed Food & Beverage Preservatives Revenue Market (US$ Mn), Forecast by Synthetic Type, 2015 – 2024
48 Asia Pacific Processed Food & Beverage Preservatives Volume Market (Kilo Tons), Forecast by Synthetic Type, 2015 – 2024
49 Asia Pacific Processed Food & Beverage Preservatives Revenue Market (US$ Mn), Forecast by Benzoate Type, 2015 – 2024
50 Asia Pacific Processed Food & Beverage Preservatives Volume Market (Kilo Tons), Forecast by Benzoate Type, 2015 – 2024
51 Asia Pacific Processed Food & Beverage Preservatives Revenue Market (US$ Mn), Forecast by Sulfite Type, 2015 – 2024
52 Asia Pacific Processed Food & Beverage Preservatives Volume Market (Kilo Tons), Forecast by Sulfite Type, 2015 – 2024
53 Asia Pacific Processed Food & Beverage Preservatives Revenue Market (US$ Mn), Forecast by Sorbate Type, 2015 – 2024
54 Asia Pacific Processed Food & Beverage Preservatives Volume Market (Kilo Tons), Forecast by Sorbate Type, 2015 – 2024
55 Asia Pacific Processed Food & Beverage Preservatives Revenue Market (US$ Mn), Forecast by Form, 2015 – 2024
56 Asia Pacific Processed Food & Beverage Preservatives Volume Market (Kilo Tons), Forecast by Form, 2015 – 2024
57 Asia Pacific Processed Food & Beverage Preservatives Revenue Market (US$ Mn), Forecast by Function, 2015 – 2024
58 Asia Pacific Processed Food & Beverage Preservatives Volume Market (Kilo Tons), Forecast by Function, 2015 – 2024
59 Asia Pacific Processed Food & Beverage Preservatives Revenue Market (US$ Mn), Forecast by Application, 2015 – 2024
60 Asia Pacific Processed Food & Beverage Preservatives Volume Market (Kilo Tons), Forecast by Application, 2015 – 2024
61 Asia Pacific Processed Food & Beverage Preservatives Revenue Market (US$ Mn), Forecast by Country, 2015 – 2024
62 Asia Pacific Processed Food & Beverage Preservatives Volume Market (Kilo tons), Forecast by Country, 2015 – 2024
63 Middle East and Africa Processed Food & Beverage Preservatives Revenue Market (US$ Mn), Forecast by Product Type, 2015 – 2024
64 Middle East and Africa Processed Food & Beverage Preservatives Volume Market (Kilo Tons), Forecast by Product Type, 2015 – 2024
65 Middle East and Africa Processed Food & Beverage Preservatives Revenue Market (US$ Mn), Forecast by Natural Type, 2015 – 2024
66 Middle East and Africa Processed Food & Beverage Preservatives Volume Market (Kilo Tons), Forecast by Natural Type, 2015 – 2024
67 Middle East and Africa Processed Food & Beverage Preservatives Revenue Market (US$ Mn), Forecast by Synthetic Type, 2015 – 2024
68 Middle East and Africa Processed Food & Beverage Preservatives Volume Market (Kilo Tons), Forecast by Synthetic Type, 2015 – 2024
69 Middle East and Africa Processed Food & Beverage Preservatives Revenue Market (US$ Mn), Forecast by Benzoate Type, 2015 – 2024
70 Middle East and Africa Processed Food & Beverage Preservatives Volume Market (Kilo Tons), Forecast by Benzoate Type, 2015 - 2024
71 Middle East and Africa Processed Food & Beverage Preservatives Revenue Market (US$ Mn), Forecast by SulfiteType, 2015 – 2024
72 Middle East and Africa Processed Food & Beverage Preservatives Volume Market (Kilo Tons), Forecast by Sulfite Type, 2015 – 2024
73 Middle East and Africa Processed Food & Beverage Preservatives Revenue Market (US$ Mn), Forecast by Sorbate Type, 2015 – 2024
74 Middle East and Africa Processed Food & Beverage Preservatives Volume Market (Kilo Tons), Forecast by Sorbate Type, 2015 – 2024
75 Middle East and Africa Processed Food & Beverage Preservatives Revenue Market (US$ Mn), Forecast by Form, 2015 – 2024
76 Middle East and Africa Processed Food & Beverage Preservatives Volume Market (Kilo Tons), Forecast by Form, 2015 – 2024
77 Middle East and Africa Processed Food & Beverage Preservatives Revenue Market (US$ Mn), Forecast by Function, 2015 – 2024
78 Middle East and Africa Processed Food & Beverage Preservatives Volume Market (Kilo Tons), Forecast by Function, 2015 – 2024
79 Middle East and Africa Processed Food & Beverage Preservatives Revenue Market (US$ Mn), Forecast by Application, 2015 – 2024
80 Middle East and Africa Processed Food & Beverage Preservatives Volume Market (Kilo Tons), Forecast by Application, 2015 - 2024
81 Middle East and Africa Processed Food & Beverage Preservatives Revenue Market (US$ Mn), Forecast by Country, 2015 – 2024
82 Middle East and Africa Processed Food & Beverage Preservatives Volume Market (Kilo tons), Forecast by Country, 2015 – 2024
83 Latin America Processed Food & Beverage Preservatives Revenue Market (US$ Mn), Forecast by Product Type, 2015 – 2024
84 Latin America Processed Food & Beverage Preservatives Volume Market (Kilo Tons), Forecast by Product Type, 2015 – 2024
85 Latin America Processed Food & Beverage Preservatives Revenue Market (US$ Mn), Forecast by Natural Type, 2015 – 2024
86 Latin America Processed Food & Beverage Preservatives Volume Market (Kilo Tons), Forecast by Natural Type, 2015 – 2024
87 Latin America Processed Food & Beverage Preservatives Revenue Market (US$ Mn), Forecast by Synthetic Type, 2015 – 2024
88 Latin America Processed Food & Beverage Preservatives Volume Market (Kilo Tons), Forecast by Synthetic Type, 2015 – 2024
89 Latin America Processed Food & Beverage Preservatives Revenue Market (US$ Mn), Forecast by Benzoate Type, 2015 – 2024
90 Latin America Processed Food & Beverage Preservatives Volume Market (Kilo Tons), Forecast by Benzoate Type, 2015 – 2024
91 Latin America Processed Food & Beverage Preservatives Revenue Market (US$ Mn), Forecast by Sulfite Type, 2015 – 2024
92 Latin America Processed Food & Beverage Preservatives Volume Market (Kilo Tons), Forecast by Sulfite Type, 2015 – 2024
93 Latin America Processed Food & Beverage Preservatives Revenue Market (US$ Mn), Forecast by Sorbate Type, 2015 – 2024
94 Latin America Processed Food & Beverage Preservatives Volume Market (Kilo Tons), Forecast by Sorbate Type, 2015 – 2024
95 Latin America Processed Food & Beverage Preservatives Revenue Market (US$ Mn), Forecast by Form, 2015 – 2024
96 Latin America Processed Food & Beverage Preservatives Volume Market (Kilo Tons), Forecast by Form, 2015 – 2024
97 Latin America Processed Food & Beverage Preservatives Revenue Market (US$ Mn), Forecast by Function, 2015 – 2024
98 Latin America Processed Food & Beverage Preservatives Volume Market (Kilo Tons), Forecast by Function, 2015 – 2024
99 Latin America Processed Food & Beverage Preservatives Revenue Market (US$ Mn), Forecast by Application, 2015 – 2024
100 Latin America Processed Food & Beverage Preservatives Volume Market (Kilo Tons), Forecast by Application, 2015 – 2024
111 Latin America Processed Food & Beverage Preservatives Revenue Market (US$ Mn), Forecast by Country, 2015 – 2024
112 Latin America Processed Food & Beverage Preservatives Volume Market (Kilo Tons), Forecast by Country, 2015 - 2024
List of Figures
1 Global Processed Food & Beverage Preservatives Market Revenue (US $ Mn), 2015
2 Global Processed Food & Beverage Preservatives Market Volume (Kilo tonnes), 2015
3 Global Processed Food & Beverage Preservatives Market Revenue Share Analysis, by Product Type, 2015 & 2024
4 Global Processed Food & Beverage Preservatives Market Volume Share Analysis, by Product Type, 2015 & 2024
5 Global Processed Food & Beverage Natural Preservatives Market, Revenue (US$ Mn ) and Volume (Kilo Tons), 2015–2024
6 Global Processed Food & Beverage Synthetic Preservatives Market, Revenue (US$ Mn ) and Volume (Kilo Tons), 2015–2024
7 Global Processed Food & Beverage Preservatives Market Revenue Share Analysis, by Natural Type, 2015 & 2024
8 Global Processed Food & Beverage Preservatives Market Volume Share Analysis, by Natural Type, 2015 & 2024
9 Global Processed Food & Beverage Preservatives Salt Market, Revenue (US$ Mn ) and Volume (Kilo Tons), 2015–2024
10 Global Processed Food & Beverage Preservatives Sugar Market, Revenue (US$ Mn ) and Volume (Kilo Tons), 2015–2024
11 Global Processed Food & Beverage Preservatives Alcohol Market, Revenue (US$) and Volume ( Kilo Tons), 2015–2024
12 Global Processed Food & Beverage Preservatives Vinegar Market, Revenue (US$) and Volume ( Kilo Tons), 2015–2024
13 Global Processed Food & Beverage Preservatives Rosemary Extracts Market, Revenue (US$) and Volume (Kilo Tons), 2015–2024
14 Global Processed Food & Beverage Preservatives Others Market, Revenue (US$) and Volume (Kilo Tons), 2015–2024
15 Global Processed Food & Beverage Preservatives Market Revenue Share Analysis, by Synthetic Type, 2015 & 2024
16 Global Processed Food & Beverage Preservatives Market Volume Share Analysis, by Synthetic Type, 2015 & 2024
17 Global Processed Food & Beverage Preservatives Benzoate Market, Revenue (US$) and Volume (Kilo Tons), 2015–2024
18 Global Processed Food & Beverage Preservatives Nitrite Market, Revenue and Volume (US$ Mn, Kilo Tons), 2015–2024
19 Global Processed Food & Beverage Preservatives Sulfite Market, Revenue (US$) and Volume (Kilo Tons), 2015–2024
20 Global Processed Food & Beverage Preservatives Sorbate Market, Revenue (US$) and Volume (Kilo Tons), 2015–2024
21 Global Processed Food & Beverage Preservatives Propionate Market, Revenue (US$) and Volume (Kilo Tons), 2015–2024
22 Global Processed Food & Beverage Preservatives Others Market, Revenue (US$) and Volume (Kilo Tons), 2015–2024
23 Global Processed Food & Beverage Preservatives Market Revenue Share Analysis, by Benzoate Type, 2015 & 2024
24 Global Processed Food & Beverage Preservatives Market Volume Share Analysis, by Benzoate Type, 2015 & 2024
25 Global Processed Food & Beverage Preservatives Sodium Benzoate Market, Revenue (US$) and Volume (Kilo Tons), 2015–2024
26 Global Processed Food & Beverage Preservatives Benzoic Acid Market, Revenue (US$) and Volume (Kilo Tons), 2015–2024
27 Global Processed Food & Beverage Preservatives Market Revenue Share Analysis, by Sulfite Type, 2015 & 2024
28 Global Processed Food & Beverage Preservatives Market Volume Share Analysis, by Sulfite Type, 2015 & 2024
29 Global Processed Food & Beverage Preservatives Sulfur Dioxide Market, Revenue (US$) and Volume (Kilo Tons), 2015–2024
30 Global Processed Food & Beverage Preservatives Acetic Acid Market, Revenue (US$) and Volume (Kilo Tons), 2015–2024
31 Global Processed Food & Beverage Preservatives Sodium Diacetate Market, Revenue (US$) and Volume (Kilo Tons), 2015–2024
32 Global Processed Food & Beverage Preservatives Lactic Acid Market, Revenue (US$) and Volume (Kilo Tons), 2015–2024
33 Global Processed Food & Beverage Preservatives Market Revenue Share Analysis, by Sorbate Type, 2015 & 2024
34 Global Processed Food & Beverage Preservatives Market Volume Share Analysis, by Sorbate Type, 2015 & 2024
35 Global Processed Food & Beverage Preservatives Sodium Sorbate Market, Revenue (US$) and Volume (Kilo Tons), 2015–2024
36 Global Processed Food & Beverage Preservatives Potassium Sorbate Market, Revenue (US$) and Volume (Kilo Tons), 2015–2024
37 Processed Food & Beverage Preservatives Market Attractiveness Analysis, by Product Type, 2015
38 Global Processed Food & Beverage Preservatives Market Revenue Share Analysis, by Form, 2015 & 2024
39 Global Processed Food & Beverage Preservatives Market Volume Share Analysis, by Form, 2015 & 2024
40 Global Processed Food & Beverage Preservatives Market Revenue (US$ Mn) and Volume (Kilo Tons), by Solid Form, 2015–2024
41 Global Processed Food & Beverage Preservatives Market Revenue (US$ Mn) and Volume (Kilo Tons), by Liquid Form, 2015–2024
42 Processed Food & Beverage Preservatives Market Attractiveness Analysis, by Form, 2015
43 Global Processed Food & Beverage Preservatives Market Revenue Share Analysis, by Function, 2015 & 2024
44 Global Processed Food & Beverage Preservatives Market Volume Share Analysis, by Function, 2015 & 2024
45 Global Processed Food & Beverage Preservatives Market Revenue (US$ Mn) and Volume (Kilo Tons), by Antimicrobials, 2015–2024
46 Global Processed Food & Beverage Preservatives Market Revenue (US$ Mn) and Volume (Kilo Tons), by Antioxidants, 2015–2024
47 Global Processed Food & Beverage Preservatives Market Revenue (US$ Mn) and Volume (Kilo Tons), by Chelating Agents, 2015–2024
48 Global Processed Food & Beverage Preservatives Market Revenue (US$ Mn) and Volume (Kilo Tons), by Others, 2015–2024
49 Processed Food & Beverage Preservatives Market Attractiveness Analysis, by Function, 2015
50 Global Processed Food & Beverage Preservatives Market Revenue Share Analysis, by Application, 2015 & 2024
51 Global Processed Food & Beverage Preservatives Market Volume Share Analysis, by Application, 2015 & 2024
52 Global Processed Food & Beverage Preservatives Market Revenue (US$ Mn) and Volume (Kilo Tons), by Bakery, 2015–2024
53 Global Processed Food & Beverage Preservatives Market Revenue (US$ Mn) and Volume (Kilo Tons), by Confectionery, 2015–2024
54 Global Processed Food & Beverage Preservatives Market Revenue (US$ Mn) and Volume (Kilo Tons), by Meat, Poultry & Seafood, 2015–2024
55 Global Processed Food & Beverage Preservatives Market Revenue (US$ Mn) and Volume (Kilo Tons), by Dairy, 2015–2024
56 Global Processed Food & Beverage Preservatives Market Revenue (US$ Mn) and Volume (Kilo Tons), by Beverages, 2015–2024
57 Global Processed Food & Beverage Preservatives Market Revenue (US$ Mn) and Volume (Kilo Tons), by Snack Food, 2015–2024
58 Global Processed Food & Beverage Preservatives Market Revenue (US$ Mn) and Volume (Kilo Tons), by Frozen Food, 2015–2024
59 Global Processed Food & Beverage Preservatives Market Revenue (US$ Mn) and Volume (Kilo Tons), by Fats & Oils, 2015–2024
60 Global Processed Food & Beverage Preservatives Market Revenue (US$ Mn) and Volume (Kilo Tons), by Others, 2015–2024
61 Processed Food & Beverage Preservatives Market Attractiveness Analysis, by Application, 2015
62 Global Processed Food & Beverage Preservatives Market Revenue Share Analysis, by Region, 2015 & 2024
63 Global Processed Food & Beverage Preservatives Market Volume Share Analysis, by Region, 2015 & 2024
64 Processed Food & Beverage Preservatives Market Attractiveness Analysis, by Product Type, 2015
65 North America Processed Food & Beverage Preservatives Market Revenue Share Analysis, by Product Type, 2015 & 2024
66 North America Processed Food & Beverage Preservatives Market Volume Share Analysis, by Product Type, 2015 & 2024
67 North America Processed Food & Beverage Preservatives Market Revenue Share Analysis, by Natural Type, 2015 & 2024
68 North America Processed Food & Beverage Preservatives Market Volume Share Analysis, by Natural Type, 2015 & 2024
69 North America Processed Food & Beverage Preservatives Market Revenue Share Analysis, by Synthetic Type, 2015 & 2024
70 North America Processed Food & Beverage Preservatives Market Volume Share Analysis, by Synthetic Type, 2015 & 2024
71 North America Processed Food & Beverage Preservatives Market Revenue Share Analysis, by Benzoate Type, 2015 & 2024
72 North America Processed Food & Beverage Preservatives Market Volume Share Analysis, by Benzoate Type, 2015 & 2024
73 North America Processed Food & Beverage Preservatives Market Revenue Share Analysis, by Sulfite Type, 2015 & 2024
74 North America Processed Food & Beverage Preservatives Market Volume Share Analysis, by Sulfite Type, 2015 & 2024
75 North America Processed Food & Beverage Preservatives Market Revenue Share Analysis, by Sorbate Type, 2015 & 2024
76 North America Processed Food & Beverage Preservatives Market Volume Share Analysis, by Sorbate Type, 2015 & 2024
77 North America Processed Food & Beverage Preservatives Market Revenue Share Analysis, by Form, 2015 & 2024
78 North America Processed Food & Beverage Preservatives Market Volume Share Analysis, by Form, 2015 & 2024
79 North America Processed Food & Beverage Preservatives Market Revenue Share Analysis, by Function, 2015 & 2024
80 North America Processed Food & Beverage Preservatives Market Volume Share Analysis, by Function, 2015 & 2024
81 North America Processed Food & Beverage Preservatives Market Revenue Share Analysis, by Application, 2015 & 2024
82 North America Processed Food & Beverage Preservatives Market Value Share Analysis, by Application, 2015 & 2024
83 North America Processed Food & Beverage Preservatives Market Revenue Share Analysis, by Country, 2015 & 2024
84 North America Processed Food & Beverage Preservatives Market Volume Share Analysis, by Country, 2015 & 2024
85 Europe Processed Food & Beverage Preservatives Market Revenue Share Analysis, by Product Type, 2015 & 2024
86 Europe Processed Food & Beverage Preservatives Market Volume Share Analysis, by Product Type, 2015 & 2024
87 Europe Processed Food & Beverage Preservatives Market Revenue Share Analysis, by Natural Type, 2015 & 2024
88 Europe Processed Food & Beverage Preservatives Market Volume Share Analysis, by Natural Type, 2015 & 2024
89 Europe Processed Food & Beverage Preservatives Market Revenue Share Analysis, by Synthetic Type, 2015 & 2024
90 Europe Processed Food & Beverage Preservatives Market Volume Share Analysis, by Synthetic Type, 2015 & 2024
91 Europe Processed Food & Beverage Preservatives Market Revenue Share Analysis, by Benzoate Type, 2015 & 2024
92 Europe Processed Food & Beverage Preservatives Market Volume Share Analysis, by Benzoate Type, 2015 & 2024
93 Europe Processed Food & Beverage Preservatives Market Revenue Share Analysis, by Sulfite Type, 2015 & 2024
94 Europe Processed Food & Beverage Preservatives Market Volume Share Analysis, by Sulfite Type, 2015 & 2024
95 Europe Processed Food & Beverage Preservatives Market Revenue Share Analysis, by Sorbate Type, 2015 & 2024
96 Europe Processed Food & Beverage Preservatives Market Volume Share Analysis, By Sorbate Type, 2015 & 2024
97 Europe Processed Food & Beverage Preservatives Market Revenue Share Analysis, By Form, 2015 & 2024
98 Europe Processed Food & Beverage Preservatives Market Volume Share Analysis, By Form, 2015 & 2024
99 Europe Processed Food & Beverage Preservatives Market Revenue Share Analysis, By Function, 2015 & 2024
100 Europe Processed Food & Beverage Preservatives Market Volume Share Analysis, By Function, 2015 & 2024
101 Europe Processed Food & Beverage Preservatives Market Revenue Share Analysis, By Application, 2015 & 2024
102 Europe Processed Food & Beverage Preservatives Market Volume Share Analysis, By Application, 2015 & 2024
103 Europe Processed Food & Beverage Preservatives Market Revenue Share Analysis, By Country, 2015 & 2024
104 Europe Processed Food & Beverage Preservatives Market Volume Share Analysis, By Country, 2015 & 2024
105 Asia Pacific Processed Food & Beverage Preservatives Market Revenue Share Analysis, by Product Type, 2015 & 2024
106 Asia Pacific Processed Food & Beverage Preservatives Market Volume Share Analysis, by Product Type, 2015 & 2024
107 Asia Pacific Processed Food & Beverage Preservatives Market Revenue Share Analysis, by Natural Type, 2015 & 2024
108 Asia Pacific Processed Food & Beverage Preservatives Market Volume Share Analysis, by Natural Type, 2015 & 2024
109 Asia Pacific Processed Food & Beverage Preservatives Market Revenue Share Analysis, by Synthetic Type, 2015 & 2024
110 Asia Pacific Processed Food & Beverage Preservatives Market Volume Share Analysis, by Synthetic Type, 2015 & 2024
111 Asia Pacific Processed Food & Beverage Preservatives Market Revenue Share Analysis, by Benzoate Type, 2015 & 2024
112 Asia Pacific Processed Food & Beverage Preservatives Market Volume Share Analysis, by Benzoate Type, 2015 & 2024
113 Asia Pacific Processed Food & Beverage Preservatives Market Revenue Share Analysis, by Sulfite Type, 2015 & 2024
114 Asia Pacific Processed Food & Beverage Preservatives Market Volume Share Analysis, by Sulfite Type, 2015 & 2024
115 Asia Pacific Processed Food & Beverage Preservatives Market Revenue Share Analysis, by Sorbate Type, 2015 & 2024
116 Asia Pacific Processed Food & Beverage Preservatives Market Volume Share Analysis, by Sorbate Type, 2015 & 2024
117 Asia Pacific Processed Food & Beverage Preservatives Market Revenue Share Analysis, by Form, 2015 & 2024
118 Asia Pacific Processed Food & Beverage Preservatives Market Volume Share Analysis, by Form, 2015 & 2024
119 Asia Pacific Processed Food & Beverage Preservatives Market Revenue Share Analysis, by Function, 2015 & 2024
120 Asia Pacific Processed Food & Beverage Preservatives Market Volume Share Analysis, by Function, 2015 & 2024
121 Asia Pacific Processed Food & Beverage Preservatives Market Revenue Share Analysis, by Application, 2015 & 2024
122 Asia Pacific Processed Food & Beverage Preservatives Market Volume Share Analysis, by Application, 2015 & 2024
123 Asia Pacific Processed Food & Beverage Preservatives Market Revenue Share Analysis, by Country, 2015 & 2024
124 Asia Pacific Processed Food & Beverage Preservatives Market Volume Share Analysis, by Country, 2015 & 2024
125 Middle East and Africa Processed Food & Beverage Preservatives Market Revenue Share Analysis, by Product Type, 2015 & 2024
126 Middle East and Africa Processed Food & Beverage Preservatives Market Volume Share Analysis, by Product Type, 2015 & 2024
127 Middle East and Africa Processed Food & Beverage Preservatives Market Revenue Share Analysis, by Natural Type, 2015 & 2024
128 Middle East and Africa Processed Food & Beverage Preservatives Market Volume Share Analysis, by Natural Type, 2015 & 2024
129 Middle East and Africa Processed Food & Beverage Preservatives Market Revenue Share Analysis, by Synthetic Type, 2015 & 2024
130 Middle East and Africa Processed Food & Beverage Preservatives Market Volume Share Analysis, by Synthetic Type, 2015 & 2024
131 Middle East and Africa Processed Food & Beverage Preservatives Market Revenue Share Analysis, by Benzoate Type, 2015 & 2024
132 Middle East and Africa Processed Food & Beverage Preservatives Market Volume Share Analysis, by Benzoate Type, 2015 & 2024
133 Middle East and Africa Processed Food & Beverage Preservatives Market Revenue Share Analysis, by Sulfite Type, 2015 & 2024
134 Middle East and Africa Processed Food & Beverage Preservatives Market Volume Share Analysis, by Sulfite Type, 2015 & 2024
135 Middle East and Africa Processed Food & Beverage Preservatives Market Revenue Share Analysis, by Sorbate Type, 2015 & 2024
136 Middle East and Africa Processed Food & Beverage Preservatives Market Volume Share Analysis, by Sorbate Type, 2015 & 2024
137 Middle East and Africa Processed Food & Beverage Preservatives Market Revenue Share Analysis, by Form, 2015 & 2024
138 Middle East and Africa Processed Food & Beverage Preservatives Market Volume Share Analysis, by Form, 2015 & 2024
139 Middle East and Africa Processed Food & Beverage Preservatives Market Revenue Share Analysis, by Function, 2015 & 2024
140 Middle East and Africa Processed Food & Beverage Preservatives Market Volume Share Analysis, by Function, 2015 & 2024
141 Middle East and Africa Processed Food & Beverage Preservatives Market Revenue Share Analysis, by Application, 2015 & 2024
142 Middle East and Africa Processed Food & Beverage Preservatives Market Volume Share Analysis, by Application, 2015 & 2024
143 Middle East and Africa Processed Food & Beverage Preservatives Market Revenue Share Analysis, by Country, 2015 & 2024
144 Middle East and Africa Processed Food & Beverage Preservatives Market Volume Share Analysis, by Country, 2015 & 2024
145 Latin America Processed Food & Beverage Preservatives Market Revenue Share Analysis, by Product Type, 2015 & 2024
146 Latin America Processed Food & Beverage Preservatives Market Volume Share Analysis, by Product Type, 2015 & 2024
147 Latin America Processed Food & Beverage Preservatives Market Revenue Share Analysis, by Natural Type, 2015 & 2024
148 Latin America Processed Food & Beverage Preservatives Market Volume Share Analysis, by Natural Type, 2015 & 2024
149 Latin America Processed Food & Beverage Preservatives Market Revenue Share Analysis, by Synthetic Type, 2015 & 2024
150 Latin America Processed Food & Beverage Preservatives Market Volume Share Analysis, by Synthetic Type, 2015 & 2024
151 Latin America Processed Food & Beverage Preservatives Market Revenue Share Analysis, by Benzoate Type, 2015 & 2024
152 Latin America Processed Food & Beverage Preservatives Market Volume Share Analysis, by Benzoate Type, 2015 & 2024
153 Latin America Processed Food & Beverage Preservatives Market Revenue Share Analysis, by Sulfite Type, 2015 & 2024
154 Latin America Processed Food & Beverage Preservatives Market Volume Share Analysis, by Sulfite Type, 2015 & 2024
155 Latin America Processed Food & Beverage Preservatives Market Revenue Share Analysis, by Sorbate Type, 2015 & 2024
156 Latin America Processed Food & Beverage Preservatives Market Volume Share Analysis, by Sorbate Type, 2015 & 2024
157 Latin America Processed Food & Beverage Preservatives Market Revenue Share Analysis, by Form, 2015 & 2024
158 Latin America Processed Food & Beverage Preservatives Market Volume Share Analysis, by Form, 2015 & 2024
159 Latin America Processed Food & Beverage Preservatives Market Revenue Share Analysis, by Function, 2015 & 2024
160 Latin America Processed Food & Beverage Preservatives Market Volume Share Analysis, by Function, 2015 & 2024
161 Latin America Processed Food & Beverage Preservatives Market Revenue Share Analysis, by Application, 2015 & 2024
162 Latin America Processed Food & Beverage Preservatives Market Value Share Analysis, by Application, 2015 & 2024
163 Latin America Processed Food & Beverage Preservatives Market Revenue Share Analysis, by Country, 2015 & 2024
164 Latin America Processed Food & Beverage Preservatives Market Volume Share Analysis, by Country, 2015 & 2024
Copyright © Transparency Market Research, Inc. All Rights reserved
Trust Online

Processed Food & Beverage Preservatives Market