
Reports
Reports
Analysts’ Viewpoint on Set-top Boxes Market Scenario
The global set-top boxes market growth is fueled by numerous factors, such as rising flexibility in subscription models and growing demand for smart TVs with dynamic content. Smart TVs are expected to offer more choices to consumers with additional access to services such as Netflix, YouTube, and other streaming services, which are projected to boost the global set-top boxes market during the forecast period. Moreover, over-the-top (OTT) enables consumers to view the content of their choice without having to pay an additional fee. This is one of the key factors that is projected to boost the growth of the set-top boxes market in the near future. Introduction of smart TVs, HD, and Ultra HD channels, and technological innovations increase the adoption rate of high-end set-top boxes. Digital video recording is one of the key drivers of the market. The feature allows users to record the show and watch it later. The availability of TVs integrated with set-top boxes is one of the key trends that creates momentum in market growth. These TVs provide access to online video streaming platforms and social media platforms. In addition, they offer better storage option with up to 2TB capacity.
A set-top box (STB) is a device that is used to convert the video content transmitted from a pay TV operator to a format compatible with an end-user or subscriber TV. STBs may receive the video content from satellite, terrestrial, cable, or Internet-based transmission. STBs offer a greater number of channels compared to conventional broadcasting services and further improves the quality of the video content considerably. The introduction of High Definition (HD) channels, digitization of TV broadcasting, and demand for higher picture quality are resulting in the growth of the STB market. With advancements in technology, STB is increasingly being used to stream digital TV content through the Internet, further enabling a user to surf the Web, stream videos, access various applications, play games, and use allied features, such as OTT services. With advanced coding and compression techniques, it has become much easier to decode high-quality videos using comparatively less bandwidth.
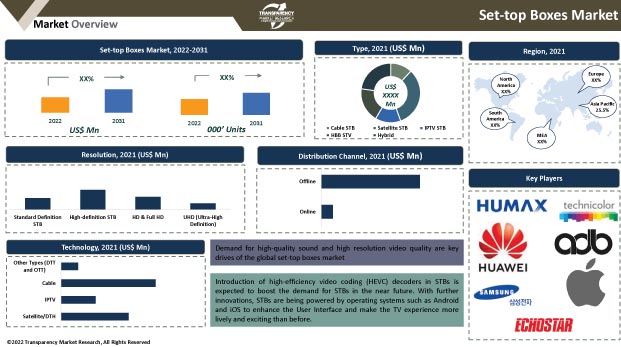
The introduction of high-efficiency video coding (HEVC) decoders in STBs is expected to boost the demand for the latter in the upcoming years. STBs are being powered by operating systems such as Android and iOS due to further innovations, to enhance the user interface and make the TV experience more lively and exciting than before.
The set-top boxes (STB) market is expected to register robust growth in the near future. Rising flexibility in subscription models and growing demand for smart TVs with dynamic content are likely to fuel the growth of the market. Smart TVs are expected to offer even more choices to users with additional access to services such as Netflix, YouTube, and other streaming services. Moreover, emerging subscription models in the market are expected to provide more choice with an increasing number of them moving toward pay-per-channel models. This is apparent in countries such as the U.S., where services such as HBO are highly demanded. Recent regulations in India empowered set-top-box providers to compete better with dynamic content from the Internet, making way for more competition and more choices for consumers. These trends are expected to be major drivers for the set-top boxes market.
Companies are always focused on quality to achieve market efficiency of set-top boxes. Companies are actively using integration and acquisition strategies to reap the benefits of partner innovation, distribution base, and promotional success. Increasing acceptance of high quality and new products for household appliances and rising global income are expected to further the demand for STB products for television sets.
On September 22, 2021, merger agreement of Zee-Sony was announced in India. The merger between two companies is expected to create a media behemoth that will generate US$ 2 Bn in revenue and a market share of more than 25% in the broadcast space. The combined business boasts 75 TV channels, two OTT platforms, and two film and distribution companies. Additionally, increasing demand for TV sets in retail outlets may increase the use of set-top box products.
Furthermore, cases of epidemics such as the current outbreak of COVID-19, which forced people to stay in their homes, have increased the use of online video and may further intensify the demand for STB products. In addition, the increasing consumer acceptance of digital STBs that are more efficient than analog STBs has created a need for new products based on digital technology.
Moreover, the growing e-commerce sector has made it easier to supply electronic products. Nevertheless, government regulations regarding the limited bandwidth usage of high-volume speakers is expected to hamper the growth of the set-top boxes market.
Digital growth in television networks and advancements in digital broadcasting technologies are key drivers of the set-top boxes market. Users are increasingly looking for seamless, high-quality video streaming, and profitable services such as channel package subscriptions, HD channels, and interactive videos. Additionally, the widespread adoption of set-top boxes has been witnessed in recent years.
The growing acquisition of smart TVs coupled with the rapid growth of Over the Top (OTT) media services has allowed viewers access to their chosen content at no additional cost. Moreover, various technological advancements such as the introduction of dynamic sensors, Bluetooth connectivity, IoT integration (Internet of Things), and support for interactive playgrounds, virtual reality, and artificial intelligence have further enhanced product demand. The implementation of government policies that authorize the installation of set-top boxes in several countries and the increase in revenues also have a positive impact on the growth of the set-top boxes market.
Satellite TV is one of the most important types in the market for set-top boxes. One of the innovations in satellite TV is the launch of the recording studio, which enables consumers to record their programs in real-time and watch them later at a convenient time. Besides, satellite STB units are becoming increasingly equipped with interactive features, such as video on demand, and electronic program guides.
STB units are highly developed, and provide a range of interactive and multimedia communication services directly through the user's television system, such as Internet browsing, email, and instant messaging, in addition to basic functionality. D2H offers a HD SMART set-top box that converts an existing LED TV into a smart TV. This set-top box allows users to browse content from Twitter, Facebook, and Daily Motion, videos on desired sites, OTT apps, and news. HD smart set-top boxes serve as tools to create a personal and new customer experience.
The two biggest advantages that set-top box manufacturers have against conventional cable services are the ability to provide a greater variety of channels, and to broadcast HD and ultra-HD channels. In the near future, increasingly digitized set-top box services coupled with highly interactive features is expected to be added, thus increasing the appeal of set-top boxes to consumers. This will serve as a primary driver for all set-top box manufacturers across the globe.
The effect of the proliferation of HD services in all developed regions are factors for set-top box providers to focus on them. Additionally, the near-sale of HEVC high-end boxes is expected to counteract problems service providers have with 4K video data transfer, which is data decoding. HEVC-enabled set-top boxes are projected to improve the speed at which 4K video can be recorded, thus enabling smooth 4K performance for users in a market where demand is high.
Another concept currently in high demand is the hybrid set-top box, which is a combination of Internet-based TV services and satellite-based HD services. Hybrid set-top boxes are expected to help TV channel providers assume a better competitive role against Internet-based OTT providers.
The rapid rate of industrial development in many Asia Pacific countries allows users to have a strong purchasing skills, providing a wide range of regional opportunities for set-top box companies to grow. Additionally, the growth of the IT industry is helping to create a better online service infrastructure that enables users to stream much-needed videos at affordable prices. In line with the developments, Asia Pacific could be a very lucrative market for set-top boxes soon.
Australia, China, and India already have a large network of Internet users. Improved use of advanced Internet services and the proliferation of smart TVs and IPTVs in the region will enable Asia Pacific to showcase a much faster growth rate in the upcoming years. The increase in HD services has been a key success for developed economies such as North America and Europe, with the release of a wide selection of HD TVs and HD channels. This makes it easier for many set-top box providers to access these regions. The demand for HD viewing services is growing rapidly in emerging economies of Asia Pacific, South America, and Middle East & Africa.
The global set-top boxes market is highly fragmented in nature and several key global players hold significant market share. Detailed profiles of providers of set-top boxes have been provided in the report to evaluate their financials, key product offerings, recent developments, and strategies.
Key players operating in the global set-top boxes market are Humax Co., Ltd., Huawei Technologies Co., Ltd., Technicolor SA, ADB (Advanced Digital Broadcast) SA, Apple, Inc., Samsung Electronics Co. Ltd., ARRIS Group, Inc., EchoStar Corporation, Kaonmedia Co. Ltd., and Sagemcom SAS, among others.
Some key developments and strategies adopted by manufacturers in the global set-top boxes market are highlighted below:
|
Attribute |
Detail |
|
Market Size Value in 2021 (Base Year) |
US$ 18.9 Bn |
|
Market Forecast Value in 2031 |
US$ 35.2 Bn |
|
Growth Rate (CAGR) |
6.4% |
|
Forecast Period |
2022-2031 |
|
Quantitative Units |
US$ Bn for Value and Million Units for Volume |
|
Market Analysis |
Global qualitative analysis includes drivers, restraints, opportunities, key trends, upcoming key trends, Porter’s Five Forces analysis, value chain analysis, SWOT analysis, technology analysis, regulatory analysis, etc. Furthermore, at the regional level, qualitative analysis includes key trends, price trends, and key supplier analysis. |
|
Competition Landscape |
|
|
Regions Covered |
|
|
Market Segmentation |
|
|
Companies Profiled |
|
|
Customization Scope |
Available upon Request |
|
Pricing |
Available upon Request |
The market size of set-top boxes stood at US$ 18.9 Bn in 2021
The set-top boxes market is estimated to grow at a CAGR of 6.4%
The set-top boxes market is estimated to reach US$ 35.2 Bn by 2031
Technological advancements and popularity of Android television are key drivers of the market
Satellite STBs contributed key share to the set-top boxes market
Asia Pacific is a more attractive region for vendors in the set-top boxes market
Humax Co., Ltd., Huawei Technologies Co., Ltd., Technicolor SA, ADB (Advanced Digital Broadcast) SA, Apple, Inc., Samsung Electronics Co. Ltd., ARRIS Group, Inc., EchoStar Corporation, Kaonmedia Co. Ltd., and Sagemcom SAS, etc.
1. Preface
1.1. Market Definition and Scope
1.2. Market Segmentation
1.3. Key Research Objectives
1.4. Research Highlights
2. Assumptions
3. Research Methodology
4. Executive Summary
5. Market Overview
5.1. Market Dynamics
5.1.1. Drivers
5.1.2. Restraints
5.1.3. Opportunities
5.2. Key Trends Analysis
5.2.1. Demand Side Analysis
5.2.2. Supply Side Analysis
5.3. Key Market Indicators
5.3.1. Overall Television Overview
5.4. Porter’s Five Forces Analysis
5.5. Technological Overview
5.6. Value Chain Analysis
5.7. Industry SWOT Analysis
5.8. COVID-19 Impact Analysis
5.9. Standards and Regulations
5.10. Global Set-top Boxes Market Analysis and Forecast, 2017 - 2031
5.10.1. Market Value Projections (US$ Bn)
5.10.2. Market Volume Projections (Million Units)
6. Global Set-top Boxes Market Analysis and Forecast, By Type
6.1. Set-top Boxes Market Size (US$ Bn and Million Units), By Type, 2017 - 2031
6.1.1.1. Cable STB
6.1.1.2. Satellite STB
6.1.1.3. IPTV STB
6.1.1.4. HBB STV
6.1.1.5. Hybrid
6.2. Incremental Opportunity, By Type
7. Global Set-top Boxes Market Analysis and Forecast, By Resolution
7.1. Set-top Boxes Market Size (US$ Bn and Million Units), By Resolution, 2017 - 2031
7.1.1. Standard Definition STB
7.1.2. High-definition STB
7.1.3. HD & Full HD
7.1.4. UHD (Ultra-High Definition)
7.1.5. 4K & Above
7.2. Incremental Opportunity, By Resolution
8. Global Set-top Boxes Market Analysis and Forecast, By Technology
8.1. Set-top Boxes Market Size (US$ Bn and Million Units), By Technology, 2017 - 2031
8.1.1. Satellite/DTH
8.1.2. IPTV
8.1.3. Cable
8.1.4. Other Types (DTT, OTT, etc.)
8.2. Incremental Opportunity, By Technology
9. Global Set-top Boxes Market Analysis and Forecast, By Distribution Channel
9.1. Set-top Boxes Market Size (US$ Bn and Million Units), By Distribution Channel, 2017 - 2031
9.1.1. Online
9.1.1.1. Company Website
9.1.1.2. E-commerce Website
9.1.2. Offline
9.1.2.1. Direct
9.1.2.2. Indirect
9.2. Incremental Opportunity, By Distribution Channel
10. Global Set-top Boxes Market Analysis and Forecast, by Region
10.1. Set-top Boxes Market Size (US$ Bn and Million Units), By Region, 2017 - 2031
10.1.1. North America
10.1.2. Europe
10.1.3. Asia Pacific
10.1.4. Middle East & Africa
10.1.5. South America
10.2. Incremental Opportunity, By Region
11. North America Set-top Boxes Market Analysis and Forecast
11.1. Regional Snapshot
11.2. Price Trend Analysis
11.2.1. Weighted Average Selling Price (US$)
11.3. Key Supplier Analysis
11.4. Key Trends Analysis
11.4.1. Demand Side Analysis
11.4.2. Supply Side Analysis
11.5. COVID-19 Impact Analysis
11.6. Set-top Boxes Market Size (US$ Bn and Million Units), By Type, 2017 - 2031
11.6.1.1. Cable STB
11.6.1.2. Satellite STB
11.6.1.3. IPTV STB
11.6.1.4. HBB STV
11.6.1.5. Hybrid
11.7. Set-top Boxes Market Size (US$ Bn and Million Units), By Resolution, 2017 - 2031
11.7.1. Standard Definition STB
11.7.2. High-definition STB
11.7.3. HD & Full HD
11.7.4. UHD (Ultra-High Definition)
11.7.5. 4K & Above
11.8. Set-top Boxes Market Size (US$ Bn and Million Units), By Technology, 2017 - 2031
11.8.1. Satellite/DTH
11.8.2. IPTV
11.8.3. Cable
11.8.4. Other Types (DTT, OTT, etc.)
11.9. Set-top Boxes Market Size (US$ Bn and Million Units), By Distribution Channel, 2017 - 2031
11.9.1. Online
11.9.1.1. Company Website
11.9.1.2. E-commerce Website
11.9.2. Offline
11.9.2.1. Direct
11.9.2.2. Indirect
11.10. Set-top Boxes Market Size (US$ Bn and Million Units), By Country & Sub-region, 2017 - 2031
11.10.1. U.S.
11.10.2. Canada
11.10.3. Rest of North America
11.11. Incremental Opportunity Analysis
12. Europe Set-top Boxes Market Analysis and Forecast
12.1. Regional Snapshot
12.2. Price Trend Analysis
12.2.1. Weighted Average Selling Price (US$)
12.3. Key Supplier Analysis
12.4. Key Trends Analysis
12.4.1. Demand Side Analysis
12.4.2. Supply Side Analysis
12.5. COVID-19 Impact Analysis
12.6. Set-top Boxes Market Size (US$ Bn and Million Units), By Type, 2017 - 2031
12.6.1.1. Cable STB
12.6.1.2. Satellite STB
12.6.1.3. IPTV STB
12.6.1.4. HBB STV
12.6.1.5. Hybrid
12.7. Set-top Boxes Market Size (US$ Bn and Million Units), By Resolution, 2017 - 2031
12.7.1. Standard Definition STB
12.7.2. High-definition STB
12.7.3. HD & Full HD
12.7.4. UHD (Ultra-High Definition)
12.7.5. 4K & Above
12.8. Set-top Boxes Market Size (US$ Bn and Million Units), By Technology, 2017 - 2031
12.8.1. Satellite/DTH
12.8.2. IPTV
12.8.3. Cable
12.8.4. Other Types (DTT, OTT, etc.)
12.9. Set-top Boxes Market Size (US$ Bn and Million Units), By Distribution Channel, 2017 - 2031
12.9.1. Online
12.9.1.1. Company Website
12.9.1.2. E-commerce Website
12.9.2. Offline
12.9.2.1. Direct
12.9.2.2. Indirect
12.10. Set-top Boxes Market Size (US$ Bn and Million Units), By Country & Sub-region, 2017 - 2031
12.10.1. U.K.
12.10.2. Germany
12.10.3. France
12.10.4. Rest of Europe
12.11. Incremental Opportunity Analysis
13. Asia Pacific Set-top Boxes Market Analysis and Forecast
13.1. Regional Snapshot
13.2. Price Trend Analysis
13.2.1. Weighted Average Selling Price (US$)
13.3. Key Supplier Analysis
13.4. Key Trends Analysis
13.4.1. Demand Side Analysis
13.4.2. Supply Side Analysis
13.5. COVID-19 Impact Analysis
13.6. Set-top Boxes Market Size (US$ Bn and Million Units), By Type, 2017 - 2031
13.6.1.1. Cable STB
13.6.1.2. Satellite STB
13.6.1.3. IPTV STB
13.6.1.4. HBB STV
13.6.1.5. Hybrid
13.7. Set-top Boxes Market Size (US$ Bn and Million Units), By Resolution, 2017 - 2031
13.7.1. Standard Definition STB
13.7.2. High-definition STB
13.7.3. HD & Full HD
13.7.4. UHD (Ultra-High Definition)
13.7.5. 4K & Above
13.8. Set-top Boxes Market Size (US$ Bn and Million Units), By Technology, 2017 - 2031
13.8.1. Satellite/DTH
13.8.2. IPTV
13.8.3. Cable
13.8.4. Other Types (DTT, OTT, etc.)
13.9. Set-top Boxes Market Size (US$ Bn and Million Units), By Distribution Channel, 2017 - 2031
13.9.1. Online
13.9.1.1. Company Website
13.9.1.2. E-commerce Website
13.9.2. Offline
13.9.2.1. Direct
13.9.2.2. Indirect
13.10. Set-top Boxes Market Size (US$ Bn and Million Units), By Country & Sub-region, 2017 - 2031
13.10.1. China
13.10.2. India
13.10.3. Japan
13.10.4. Rest of Asia Pacific
14. Middle East & Africa Set-top Boxes Market Analysis and Forecast
14.1. Regional Snapshot
14.2. Price Trend Analysis
14.2.1. Weighted Average Selling Price (US$)
14.3. Key Supplier Analysis
14.4. Key Trends Analysis
14.4.1. Demand Side Analysis
14.4.2. Supply Side Analysis
14.5. COVID-19 Impact Analysis
14.6. Set-top Boxes Market Size (US$ Bn and Million Units), By Type, 2017 - 2031
14.6.1.1. Cable STB
14.6.1.2. Satellite STB
14.6.1.3. IPTV STB
14.6.1.4. HBB STV
14.6.1.5. Hybrid
14.7. Set-top Boxes Market Size (US$ Bn and Million Units), By Resolution, 2017 - 2031
14.7.1. Standard Definition STB
14.7.2. High-definition STB
14.7.3. HD & Full HD
14.7.4. UHD (Ultra-High Definition)
14.7.5. 4K & Above
14.8. Set-top Boxes Market Size (US$ Bn and Million Units), By Technology, 2017 - 2031
14.8.1. Satellite/DTH
14.8.2. IPTV
14.8.3. Cable
14.8.4. Other Types (DTT, OTT, etc.)
14.9. Set-top Boxes Market Size (US$ Bn and Million Units), By Distribution Channel, 2017 - 2031
14.9.1. Online
14.9.1.1. Company Website
14.9.1.2. E-commerce Website
14.9.2. Offline
14.9.2.1. Direct
14.9.2.2. Indirect
14.10. Set-top Boxes Market Size (US$ Bn and Million Units), By Country & Sub-region, 2017 - 2031
14.10.1. GCC
14.10.2. South Africa
14.10.3. Rest of Middle East & Africa
14.11. Incremental Opportunity Analysis
15. South America Set-top Boxes Market Analysis and Forecast
15.1. Regional Snapshot
15.2. Price Trend Analysis
15.2.1. Weighted Average Selling Price (US$)
15.3. Key Supplier Analysis
15.4. Key Trends Analysis
15.4.1. Demand Side Analysis
15.4.2. Supply Side Analysis
15.5. COVID-19 Impact Analysis
15.6. Set-top Boxes Market Size (US$ Bn and Million Units), By Type, 2017 - 2031
15.6.1.1. Cable STB
15.6.1.2. Satellite STB
15.6.1.3. IPTV STB
15.6.1.4. HBB STV
15.6.1.5. Hybrid
15.7. Set-top Boxes Market Size (US$ Bn and Million Units), By Resolution, 2017 - 2031
15.7.1. Standard Definition STB
15.7.2. High-definition STB
15.7.3. HD & Full HD
15.7.4. UHD (Ultra-High Definition)
15.7.5. 4K & Above
15.8. Set-top Boxes Market Size (US$ Bn and Million Units), By Technology, 2017 - 2031
15.8.1. Satellite/DTH
15.8.2. IPTV
15.8.3. Cable
15.8.4. Other Types (DTT, OTT, etc.)
15.9. Set-top Boxes Market Size (US$ Bn and Million Units), By Distribution Channel, 2017 - 2031
15.9.1. Online
15.9.1.1. Company Website
15.9.1.2. E-commerce Website
15.9.2. Offline
15.9.2.1. Direct
15.9.2.2. Indirect
15.10. Set-top Boxes Market Size (US$ Bn and Million Units), By Country & Sub-region, 2017 - 2031
15.10.1. Brazil
15.10.2. Rest of South America
15.11. Incremental Opportunity Analysis
16. Competition Landscape
16.1. Market Player – Competition Dashboard
16.2. Market Share Analysis (%), 2020
16.3. Company Profiles (Details – Company Overview, Sales Area/Geographical Presence, Financial/Revenue, Strategy & Business Overview, Sales Channel Analysis, Size Portfolio)
16.3.1. Humax Co., Ltd.
16.3.1.1. Company Overview
16.3.1.2. Sales Area/Geographical Presence
16.3.1.3. Financial/Revenue
16.3.1.4. Strategy & Business Overview
16.3.1.5. Sales Channel Analysis
16.3.1.6. Size Portfolio
16.3.2. Huawei Technologies Co., Ltd.
16.3.2.1. Company Overview
16.3.2.2. Sales Area/Geographical Presence
16.3.2.3. Financial/Revenue
16.3.2.4. Strategy & Business Overview
16.3.2.5. Sales Channel Analysis
16.3.2.6. Size Portfolio
16.3.3. Technicolor SA
16.3.3.1. Company Overview
16.3.3.2. Sales Area/Geographical Presence
16.3.3.3. Financial/Revenue
16.3.3.4. Strategy & Business Overview
16.3.3.5. Sales Channel Analysis
16.3.3.6. Size Portfolio
16.3.4. ADB (Advanced Digital Broadcast) SA
16.3.4.1. Company Overview
16.3.4.2. Sales Area/Geographical Presence
16.3.4.3. Financial/Revenue
16.3.4.4. Strategy & Business Overview
16.3.4.5. Sales Channel Analysis
16.3.4.6. Size Portfolio
16.3.5. Apple, Inc.
16.3.5.1. Company Overview
16.3.5.2. Sales Area/Geographical Presence
16.3.5.3. Financial/Revenue
16.3.5.4. Strategy & Business Overview
16.3.5.5. Sales Channel Analysis
16.3.5.6. Size Portfolio
16.3.6. Samsung Electronics Co. Ltd.
16.3.6.1. Company Overview
16.3.6.2. Sales Area/Geographical Presence
16.3.6.3. Financial/Revenue
16.3.6.4. Strategy & Business Overview
16.3.6.5. Sales Channel Analysis
16.3.6.6. Size Portfolio
16.3.7. ARRIS Group, Inc.
16.3.7.1. Company Overview
16.3.7.2. Sales Area/Geographical Presence
16.3.7.3. Financial/Revenue
16.3.7.4. Strategy & Business Overview
16.3.7.5. Sales Channel Analysis
16.3.7.6. Size Portfolio
16.3.8. EchoStar Corporation
16.3.8.1. Company Overview
16.3.8.2. Sales Area/Geographical Presence
16.3.8.3. Financial/Revenue
16.3.8.4. Strategy & Business Overview
16.3.8.5. Sales Channel Analysis
16.3.8.6. Size Portfolio
16.3.9. Kaonmedia Co. Ltd.
16.3.9.1. Company Overview
16.3.9.2. Sales Area/Geographical Presence
16.3.9.3. Financial/Revenue
16.3.9.4. Strategy & Business Overview
16.3.9.5. Sales Channel Analysis
16.3.9.6. Size Portfolio
16.3.10. Sagemcom SAS
16.3.10.1. Company Overview
16.3.10.2. Sales Area/Geographical Presence
16.3.10.3. Financial/Revenue
16.3.10.4. Strategy & Business Overview
16.3.10.5. Sales Channel Analysis
16.3.10.6. Size Portfolio
17. Key Takeaways
17.1. Identification of Potential Market Spaces
17.1.1. Type
17.1.2. Resolution
17.1.3. Technology
17.1.4. Distribution Channel
17.1.5. Region
17.2. Understanding the Buying Process of Customers
17.3. Preferred Sales & Marketing Strategy
List of Tables
Table 1: Global Set-top Boxes Market Value (US$ Bn) Forecast, 2017-2031
Table 2: Global Set-top Boxes Market Volume (Million Units) Forecast, 2017-2031
Table 3: Global Set-top Boxes Market Value (US$ Bn) Forecast, 2017-2031
Table 4: Global Set-top Boxes Market Volume (Million Units) Forecast, 2017-2031
Table 5: Global Set-top Boxes Market Value (US$ Bn) Forecast, 2017-2031
Table 6: Global Set-top Boxes Market Volume (Million Units) Forecast, 2017-2031
Table 7: Global Set-top Boxes Market Value (US$ Bn) Forecast, 2017-2031
Table 8: Global Set-top Boxes Market Volume (Million Units) Forecast, 2017-2031
Table 9: Global Set-top Boxes Market Value (US$ Bn) Forecast, 2017-2031
Table 10: Global Set-top Boxes Market Volume (Million Units) Forecast, 2017-2031
Table 11: North America Set-top Boxes Market Value (US$ Bn) Forecast, 2017-2031
Table 12: North America Set-top Boxes Market Volume (Million Units) Forecast, 2017-2031
Table 13: North America Set-top Boxes Market Value (US$ Bn) Forecast, 2017-2031
Table 14: North America Set-top Boxes Market Volume (Million Units) Forecast, 2017-2031
Table 15: North America Set-top Boxes Market Value (US$ Bn) Forecast, 2017-2031
Table 16: North America Set-top Boxes Market Volume (Million Units) Forecast, 2017-2031
Table 17: North America Set-top Boxes Market Value (US$ Bn) Forecast, 2017-2031
Table 18: North America Set-top Boxes Market Volume (Million Units) Forecast, 2017-2031
Table 19: North America Set-top Boxes Market Value (US$ Bn) Forecast, 2017-2031
Table 20: Europe Set-top Boxes Market Volume (Million Units) Forecast, 2017-2031
Table 21: Europe Set-top Boxes Market Value (US$ Bn) Forecast, 2017-2031
Table 22: Europe Set-top Boxes Market Volume (Million Units) Forecast, 2017-2031
Table 23: Europe Set-top Boxes Market Value (US$ Bn) Forecast, 2017-2031
Table 24: Europe Set-top Boxes Market Volume (Million Units) Forecast, 2017-2031
Table 25: Europe Set-top Boxes Market Value (US$ Bn) Forecast, 2017-2031
Table 26: Europe Set-top Boxes Market Volume (Million Units) Forecast, 2017-2031
Table 27: Europe Set-top Boxes Market Value (US$ Bn) Forecast, 2017-2031
Table 28: Europe Set-top Boxes Market Volume (Million Units) Forecast, 2017-2031
Table 29: Europe Set-top Boxes Market Value (US$ Bn) Forecast, 2017-2031
Table 30: Europe Set-top Boxes Market Volume (Million Units) Forecast, 2017-2031
Table 31: Asia Pacific Set-top Boxes Market Value (US$ Bn) Forecast, 2017-2031
Table 32: Asia Pacific Set-top Boxes Market Volume (Million Units) Forecast, 2017-2031
Table 33: Asia Pacific Set-top Boxes Market Value (US$ Bn) Forecast, 2017-2031
Table 34: Asia Pacific Set-top Boxes Market Volume (Million Units) Forecast, 2017-2031
Table 35: Asia Pacific Set-top Boxes Market Value (US$ Bn) Forecast, 2017-2031
Table 36: Asia Pacific Set-top Boxes Market Volume (Million Units) Forecast, 2017-2031
Table 37: Asia Pacific Set-top Boxes Market Value (US$ Bn) Forecast, 2017-2031
Table 38: Asia Pacific Set-top Boxes Market Volume (Million Units) Forecast, 2017-2031
Table 39: Asia Pacific Set-top Boxes Market Value (US$ Bn) Forecast, 2017-2031
Table 40: Asia Pacific Set-top Boxes Market Volume (Million Units) Forecast, 2017-2031
Table 41: Middle East & Africa Set-top Boxes Market Value (US$ Bn) Forecast, 2017-2031
Table 42: Middle East & Africa Set-top Boxes Market Volume (Million Units) Forecast, 2017-2031
Table 43: Middle East & Africa Set-top Boxes Market Value (US$ Bn) Forecast, 2017-2031
Table 44: Middle East & Africa Set-top Boxes Market Volume (Million Units) Forecast, 2017-2031
Table 45: Middle East & Africa Set-top Boxes Market Value (US$ Bn) Forecast, 2017-2031
Table 46: Middle East & Africa Set-top Boxes Market Volume (Million Units) Forecast, 2017-2031
Table 47: Middle East & Africa Set-top Boxes Market Value (US$ Bn) Forecast, 2017-2031
Table 48: Middle East & Africa Set-top Boxes Market Volume (Million Units) Forecast, 2017-2031
Table 49: Middle East & Africa Set-top Boxes Market Value (US$ Bn) Forecast, 2017-2031
Table 50: Middle East & Africa Set-top Boxes Market Volume (Million Units) Forecast, 2017-2031
Table 51: South America Set-top Boxes Market Value (US$ Bn) Forecast, 2017-2031
Table 52: South America Set-top Boxes Market Volume (Million Units) Forecast, 2017-2031
Table 53: South America Set-top Boxes Market Value (US$ Bn) Forecast, 2017-2031
Table 54: South America Set-top Boxes Market Volume (Million Units) Forecast, 2017-2031
Table 55: South America Set-top Boxes Market Value (US$ Bn) Forecast, 2017-2031
Table 56: South America Set-top Boxes Market Volume (Million Units) Forecast, 2017-2031
Table 57: South America Set-top Boxes Market Value (US$ Bn) Forecast, 2017-2031
Table 58: South America Set-top Boxes Market Volume (Million Units) Forecast, 2017-2031
Table 59: South America Set-top Boxes Market Value (US$ Bn) Forecast, 2017-2031
Table 60: South America Set-top Boxes Market Volume (Million Units) Forecast, 2017-2031,
List of Figures
Figure 1: Global Set-top Boxes Market Value (US$ Bn) Forecast, 2017-2031, by Type
Figure 2: Global Set-top Boxes Market Volume (Million Units) Forecast, 2017-2031, by Type
Figure 3: Global Set-top Boxes Market, Incremental Opportunities, Forecast, 2017-2031, by Type
Figure 4: Global Set-top Boxes Market Value (US$ Bn) Forecast, 2017-2031, By Resolution
Figure 5: Global Set-top Boxes Market Volume (Million Units) Forecast, 2017-2031, By Resolution
Figure 6: Global Set-top Boxes Market, Incremental Opportunities, Forecast, 2017-2031, By Resolution
Figure 7: Global Set-top Boxes Market Value (US$ Bn) Forecast, 2017-2031, By Technology
Figure 8: Global Set-top Boxes Market Volume (Million Units) Forecast, 2017-2031, By Technology
Figure 9: Global Set-top Boxes Market, Incremental Opportunities, Forecast, 2017-2031, By Technology
Figure 10: Global Set-top Boxes Market Value (US$ Bn) Forecast, 2017-2031, By Distribution Channel
Figure 11: Global Set-top Boxes Market Volume (Million Units) Forecast, 2017-2031, By Distribution Channel
Figure 12: Global Set-top Boxes Market, Incremental Opportunities, Forecast, 2017-2031, By Distribution Channel
Figure 13: Global Set-top Boxes Market Value (US$ Bn) Forecast, 2017-2031, By Region
Figure 14: Global Set-top Boxes Market Volume (Million Units) Forecast, 2017-2031, By Region
Figure 15: Global Set-top Boxes Market, Incremental Opportunities, Forecast, 2017-2031, By Region
Figure 16: North America Set-top Boxes Market Value (US$ Bn) Forecast, 2017-2031, by Type
Figure 17: North America Set-top Boxes Market Volume (Million Units) Forecast, 2017-2031, by Type
Figure 18: North America Set-top Boxes Market, Incremental Opportunities, Forecast, 2017-2031, by Type
Figure 19: North America Set-top Boxes Market Value (US$ Bn) Forecast, 2017-2031, By Resolution
Figure 20: North America Set-top Boxes Market Volume (Million Units) Forecast, 2017-2031, By Resolution
Figure 21: North America Set-top Boxes Market, Incremental Opportunities, Forecast, 2017-2031, By Resolution
Figure 22: North America Set-top Boxes Market Value (US$ Bn) Forecast, 2017-2031, By Technology
Figure 23: North America Set-top Boxes Market Volume (Million Units) Forecast, 2017-2031, By Technology
Figure 24: North America Set-top Boxes Market, Incremental Opportunities, Forecast, 2017-2031, By Technology
Figure 25: North America Set-top Boxes Market Value (US$ Bn) Forecast, 2017-2031, By Distribution Channel
Figure 26: North America Set-top Boxes Market Volume (Million Units) Forecast, 2017-2031, By Distribution Channel
Figure 27: North America Set-top Boxes Market, Incremental Opportunities, Forecast, 2017-2031, By Distribution Channel
Figure 28: North America Set-top Boxes Market Value (US$ Bn) Forecast, 2017-2031, By Country
Figure 29: North America Set-top Boxes Market Volume (Million Units) Forecast, 2017-2031, By Country
Figure 30: North America Set-top Boxes Market, Incremental Opportunities, Forecast, 2017-2031, By Country
Figure 31: Europe Set-top Boxes Market Value (US$ Bn) Forecast, 2017-2031, by Type
Figure 32: Europe Set-top Boxes Market Volume (Million Units) Forecast, 2017-2031, by Type
Figure 33: Europe Set-top Boxes Market, Incremental Opportunities, Forecast, 2017-2031, by Type
Figure 34: Europe Set-top Boxes Market Value (US$ Bn) Forecast, 2017-2031, By Resolution
Figure 35: Europe Set-top Boxes Market Volume (Million Units) Forecast, 2017-2031, By Resolution
Figure 36: Europe Set-top Boxes Market, Incremental Opportunities, Forecast, 2017-2031, By Resolution
Figure 37: Europe Set-top Boxes Market Value (US$ Bn) Forecast, 2017-2031, By Technology
Figure 38: Europe Set-top Boxes Market Volume (Million Units) Forecast, 2017-2031, By Technology
Figure 39: Europe Set-top Boxes Market, Incremental Opportunities, Forecast, 2017-2031, By Technology
Figure 40: Europe Set-top Boxes Market Value (US$ Bn) Forecast, 2017-2031, By Distribution Channel
Figure 41: Europe Set-top Boxes Market Volume (Million Units) Forecast, 2017-2031, By Distribution Channel
Figure 42: Europe Set-top Boxes Market, Incremental Opportunities, Forecast, 2017-2031, By Distribution Channel
Figure 43: Europe Set-top Boxes Market Value (US$ Bn) Forecast, 2017-2031, By Country
Figure 44: Europe Set-top Boxes Market Volume (Million Units) Forecast, 2017-2031, By Country
Figure 45: Europe Set-top Boxes Market, Incremental Opportunities, Forecast, 2017-2031, By Country
Figure 46: Asia Pacific Set-top Boxes Market Value (US$ Bn) Forecast, 2017-2031, by Type
Figure 47: Asia Pacific Set-top Boxes Market Volume (Million Units) Forecast, 2017-2031, by Type
Figure 48: Asia Pacific Set-top Boxes Market, Incremental Opportunities, Forecast, 2017-2031, by Type
Figure 49: Asia Pacific Set-top Boxes Market Value (US$ Bn) Forecast, 2017-2031, By Resolution
Figure 50: Asia Pacific Set-top Boxes Market Volume (Million Units) Forecast, 2017-2031, By Resolution
Figure 51: Asia Pacific Set-top Boxes Market, Incremental Opportunities, Forecast, 2017-2031, By Resolution
Figure 52: Asia Pacific Set-top Boxes Market Value (US$ Bn) Forecast, 2017-2031, By Technology
Figure 53: Asia Pacific Set-top Boxes Market Volume (Million Units) Forecast, 2017-2031, By Technology
Figure 54: Asia Pacific Set-top Boxes Market, Incremental Opportunities, Forecast, 2017-2031, By Technology
Figure 55: Asia Pacific Set-top Boxes Market Value (US$ Bn) Forecast, 2017-2031, By Distribution Channel
Figure 56: Asia Pacific Set-top Boxes Market Volume (Million Units) Forecast, 2017-2031, By Distribution Channel
Figure 57: Asia Pacific Set-top Boxes Market, Incremental Opportunities, Forecast, 2017-2031, By Distribution Channel
Figure 58: Asia Pacific Set-top Boxes Market Value (US$ Bn) Forecast, 2017-2031, By Country
Figure 59: Asia Pacific Set-top Boxes Market Volume (Million Units) Forecast, 2017-2031, By Country
Figure 60: Asia Pacific Set-top Boxes Market, Incremental Opportunities, Forecast, 2017-2031, By Country
Figure 61: Middle East & Africa Set-top Boxes Market Value (US$ Bn) Forecast, 2017-2031, by Type
Figure 62: Middle East & Africa Set-top Boxes Market Volume (Million Units) Forecast, 2017-2031, by Type
Figure 63: Middle East & Africa Set-top Boxes Market, Incremental Opportunities, Forecast, 2017-2031, by Type
Figure 64: Middle East & Africa Set-top Boxes Market Value (US$ Bn) Forecast, 2017-2031, By Resolution
Figure 65: Middle East & Africa Set-top Boxes Market Volume (Million Units) Forecast, 2017-2031, By Resolution
Figure 66: Middle East & Africa Set-top Boxes Market, Incremental Opportunities, Forecast, 2017-2031, By Resolution
Figure 67: Middle East & Africa Set-top Boxes Market Value (US$ Bn) Forecast, 2017-2031, By Technology
Figure 68: Middle East & Africa Set-top Boxes Market Volume (Million Units) Forecast, 2017-2031, By Technology
Figure 69: Middle East & Africa Set-top Boxes Market, Incremental Opportunities, Forecast, 2017-2031, By Technology
Figure 70: Middle East & Africa Set-top Boxes Market Value (US$ Bn) Forecast, 2017-2031, By Distribution Channel
Figure 71: Middle East & Africa Set-top Boxes Market Volume (Million Units) Forecast, 2017-2031, By Distribution Channel
Figure 72: Middle East & Africa Set-top Boxes Market, Incremental Opportunities, Forecast, 2017-2031, By Distribution Channel
Figure 73: Middle East & Africa Set-top Boxes Market Value (US$ Bn) Forecast, 2017-2031, By Country
Figure 74: Middle East & Africa Set-top Boxes Market Volume (Million Units) Forecast, 2017-2031, By Country
Figure 75: Middle East & Africa Set-top Boxes Market, Incremental Opportunities, Forecast, 2017-2031, By Country
Figure 76: South America Set-top Boxes Market Value (US$ Bn) Forecast, 2017-2031, by Type
Figure 77: South America Set-top Boxes Market Volume (Million Units) Forecast, 2017-2031, by Type
Figure 78: South America Set-top Boxes Market, Incremental Opportunities, Forecast, 2017-2031, by Type
Figure 79: South America Set-top Boxes Market Value (US$ Bn) Forecast, 2017-2031, By Resolution
Figure 80: South America Set-top Boxes Market Volume (Million Units) Forecast, 2017-2031, By Resolution
Figure 81: South America Set-top Boxes Market, Incremental Opportunities, Forecast, 2017-2031, By Resolution
Figure 82: South America Set-top Boxes Market Value (US$ Bn) Forecast, 2017-2031, By Technology
Figure 83: South America Set-top Boxes Market Volume (Million Units) Forecast, 2017-2031, By Technology
Figure 84: South America Set-top Boxes Market, Incremental Opportunities, Forecast, 2017-2031, By Technology
Figure 85: South America Set-top Boxes Market Value (US$ Bn) Forecast, 2017-2031, By Distribution Channel
Figure 86: South America Set-top Boxes Market Volume (Million Units) Forecast, 2017-2031, By Distribution Channel
Figure 87: South America Set-top Boxes Market, Incremental Opportunities, Forecast, 2017-2031, By Distribution Channel
Figure 88: South America Set-top Boxes Market Value (US$ Bn) Forecast, 2017-2031, By Country
Figure 89: South America Set-top Boxes Market Volume (Million Units) Forecast, 2017-2031, By Country
Figure 90: South America Set-top Boxes Market, Incremental Opportunities, Forecast, 2017-2031, By Country
Copyright © Transparency Market Research, Inc. All Rights reserved
Trust Online

Set-Top Boxes Market