
Reports
Reports
Global Television Broadcasting Services Market: Snapshot
Growth in the demand for high quality audio-video content as well as the emergence of new technologies such as internet of tings or IoT and over the top or OTT services are expected to fuel the demand in the global television broadcasting services market in the next few years. These new technologies can help in easily providing high definition video content to consumers as they require. Furthermore, rising requirement of various enterprises to reach out to larger base of customers and attract new potential audiences is also expected to aid in the expansion of the global television broadcasting services market in coming years. Similarly, increase in the global consumption of digital content is also favoring the growth in the global television broadcasting services market.
Other essential factors positively influencing the demand dynamics in the global television broadcasting services market include rise in the level of digitalization across the globe, rising experiments by players to enhance and innovate the existing broadcasting systems, and rising rate of transition to digital from analog. Furthermore, enterprise focus on advertisement as a promising source for revenue is also favoring the development of the global television broadcasting services market. Similarly, efforts by key vendors in the global television broadcasting services market to establish a facility in which the on-demand videos can be played as well as constant technical and creative advancements in the media and broadcast industry are also favorable for the growth of the industry.
On the other hand, stringent government regulations and guidelines pertaining to the broadcasting of content may hinder the growth trajectory of the global television broadcasting services market in coming years. However, rising adoption of various technologically advanced solutions in several developed as well as developing economies and massive number of well-established international players is expected to favor the development in the global television broadcasting services market in the next few years. During the COVID-19 pandemic, there was a significant increase in the number of viewership for television in order to consume new video content in the comfort of the home. This aided the growth in global television broadcasting services market.
Television broadcasting is a type of broadcasting in which a TV signal is transferred by radio waves from anearthbound transmitter of a TV station to televisionviewers. The TV industry has seen a noteworthyrevolution with the advent of digital broadcasting and the Internet. With the strong penetration of Internet anddeveloping digital ecosystemsaround the globe, online television broadcasting has been expanded in the past decade. However, traditional pay television still dominates the television broadcasting services market.
Cable TV broadcasting is expected to dominate throughout the forecast period. Cabletelevision broadcasting services growth is mainly supported by the older generation who spend considerable time watchingtraditional television. Majority of North Americans are still using cable TV because their pay TV subscription is bundled with their internet subscription. Apart from this, they prefer pay TV service to watch live broadcasts. In addition, cable television broadcasting services service providers are planning to provide video-on demand (VoD) services in order to maintain their position in the global market.
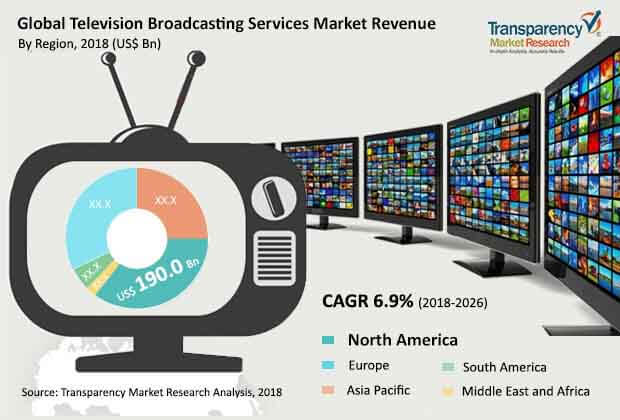
The global television broadcasting services market is witnessing strong growth owing to factors such as increasing demand for high definition (HD) content and advertisement as a growing source of revenue. At present, OTT services and production studios have huge demand from consumers and therefore broadcasters are highly focused on creating large volumes of higher-quality content. Traditional broadcasting medium provided low quality data; however, with technological advancements and advent of new technologies and streaming media devices, IoT has made availabilityof high quality content feasible. Therefore,continuous advancements in broadcast and media industry is also a major factor expected to create new opportunities for the television broadcasting services market.Apart from this, growing transition from analog to digital transmissionisalso a significant factor fueling the growth of the television broadcasting services market across the world. The global television broadcasting services market is anticipated to expand at a CAGR of 6.9% during the forecast period 2018 to 2026 and was valued atUS$ 418.1 Bnin 2017.
Government bodies of different nations have different broadcasting and content regulations. Therefore, television broadcasters must comply with legal requirements. Thus, strict and intangible rules of different economies are anticipated to limit the reach of television and it could hamper the market growth during the forecast period.
The adoption rate of Internet services such as IPTV and OTT in developed nations such as Europe and North America is estimated to increase substantially in the next few years. Thus, most television broadcasting service providers are highly concentrating on providing on-demand solutions for next-generation HD television and IPTV services. Apart from this, broadcast experts are unceasinglyproviding cloud-based solutions for managementand production while in delivery, broadcasting service providers are migrating to the large web-scale cloud vendors.Cloud based services offer agile, flexible, scalable, and reliable distribution to meet consumer demands, such as the explosion of devices, or hike in popularity during live events.Companies are focusing on offering technologically advanced and scalable solutions. For instance, in December 2017, Amagi launched a cloud based TV delivery platform in the U.S. It has changed the way broadcasters deliver the content. Charter Communications, which recently acquired Time Warner Cable also providesa cloud platform for content delivery.Sling TV is already involved in offering cable like service in the cloud for around US$20 per month.
The global television broadcasting services market includes different players such as A&E Television Networks, LLC, AT & T, Inc., British Broadcasting Corporation, CANAL+ GROUP, CBS Interactive, Channel Four Television Corporation, CenturyLink, Inc., 21st Century Fox, Comcast Corporation, Canadian Broadcasting Corporation, Heartland Media, LLC, RTL Group, Time Warner, Inc., Tivo Corporation, and Viacom International, Inc.
Television Broadcasting Services Market is expected to rise to US$755.7 Bn by 2026
Television Broadcasting Services Market to expand at a CAGR of 6.9% during the forecast period 2026
Increase in the global consumption of digital content is also favoring the growth in the global television broadcasting services market
Television Broadcasting Services Market includes different players such as A&E Television Networks, LLC, AT & T, Inc., British Broadcasting Corporation, CANAL+ GROUP, CBS Interactive, Channel Four Television Corporation, CenturyLink, Inc., 21st Century Fox, Comcast Corporation, Canadian Broadcasting Corporation, Heartland Media, LLC, RTL Group, Time Warner, Inc., Tivo Corporation, and Viacom International, Inc
During the COVID-19 pandemic, there was a significant increase in the number of viewership for television in order to consume new video content in the comfort of the home. This aided the growth in global television broadcasting services market
Chapter 1. Preface
1.1. Market Definition and Scope
1.2. Market Segmentation
1.3. Key Research Objectives
1.4. Research Highlights
Chapter 2. Assumptions and Research Methodology
Chapter 3. Executive Summary : Global Television Broadcasting Services Market
Chapter 4. Market Overview
4.1. Introduction
4.2. Market Dynamics
4.2.1. Drivers
4.2.2. Restraints
4.2.3. Opportunities
4.3. Key Market Indicators
4.3.1. Impact of Multi-channel Network over Television Broadcasting Services
4.3.2. Analysis of Linear Television Consumption
4.3.3. Industry Infrastructure Spend Analysis (US$ Mn)
4.3.3.1. Historic Trend, 2012-2017
4.3.3.2. Forecast, 2018-2026
4.3.3.3. Spend by Component, 2012, 2017, 2026 (%)
4.3.3.3. Third Party Broadcast Products & Services Vendor Spend
4.3.3.3.1.1. Traditional broadcast products & services
4.3.3.3.1.2. Digital Ecosystem Category, IT COTs Vendors & Cloud-Service Providers
4.3.3.3. In-house Spend
4.4. Key Trends Analysis
4.5. Global Television Broadcasting ServicesMarket Analysis and Forecasts
4.5.1. Market Revenue Projections (US$ Mn), 2017-2026
4.5.2. Historic Revenue Trends (US$ Mn), 2012-2016
4.5.3. Pricing/Billing Trend Analysis
4.6. Porter’s Five Forces Analysis
4.7. Television Broadcasting Services Ecosystem Analysis
4.8. Market Outlook
Chapter 5. Global Television Broadcasting Services Market Analysis and Forecasts, by Delivery Platform
5.1. Overview & Definitions
5.2. Television Broadcasting Services Market Size (US$ Mn) Forecast by Delivery Platform, 2016 - 2026
5.2.1. Digital Terrestrial Broadcast
5.2.2. Satellite Broadcast
5.2.3. Cable Television Broadcasting Services
5.2.4. Internet Protocol Television (IPTV)
5.2.5. Over-the-top Television (OTT)
5.3. Delivery Platform Comparison Matrix
5.4. Market Attractiveness by Delivery Platform
Chapter 6. Global Television Broadcasting Services Market Analysis and Forecasts, by Broadcaster Type
6.1. Overview & Definitions
6.2. Television Broadcasting Services Market Size (US$ Mn) Forecast by Broadcaster Type, 2016 - 2026
6.2.1. Public
6.2.2. Commercial
6.3. Broadcaster Type Comparison Matrix
6.4. Market Attractiveness by Broadcaster Type
Chapter 7. Global Television Broadcasting Services Market Analysis and Forecasts, by Services/ Revenue Model
7.1. Overview& Definitions
7.2. Television Broadcasting Services Market Size (US$ Mn) Forecast by Services/ Revenue Model, 2016 - 2026
7.2.1. Subscription
7.2.1.1. Pay-per View
7.2.1.2. On Demand
7.2.2. Advertisement
7.2.2.1. Digital Interactive Broadcasting
7.3. Services/ Revenue Model Comparison Matrix
7.4. Market Attractiveness by Services/ Revenue Model
Chapter 8. Global Television Broadcasting Services Market Analysis and Forecast, By Region
8.1. Key Findings
8.2. Global Television Broadcasting Services Market Analysis (US$ Mn) and Forecast, By Region,2015 – 2025
8.2.1. North America
8.2.2. Europe
8.2.3. Asia Pacific
8.2.4. Middle East and Africa
8.2.5. South America
8.3. Market Attractiveness By Region
Chapter 9. North America Television Broadcasting Services Market Analysis and Forecast
9.1. Key Findings
9.2. Television Broadcasting Services Market Size (US$ Mn) Forecast by Delivery Platform, 2016 - 2026
9.2.1. Digital Terrestrial Broadcast
9.2.2. Satellite Broadcast
9.2.3. Cable Television Broadcasting Services
9.2.4. Internet Protocol Television (IPTV)
9.2.5. Over-the-top Television (OTT)
9.3. Television Broadcasting Services Market Size (US$ Mn) Forecast by Broadcaster Type, 2016 - 2026
9.3.1. Public
9.3.2. Commercial
9.4. Television Broadcasting Services Market Size (US$ Mn) Forecast by Services/ Revenue Model, 2016 - 2026
9.4.1. Subscription
9.4.1.1. Pay-per View
9.4.1.2. On Demand
9.4.2. Advertisement
9.4.2.1. Digital Interactive Broadcasting
9.5. Television Broadcasting Services Market Size (US$ Mn) Forecast By Country, 2016 - 2026
9.5.1. U.S.
9.5.2. Canada
9.5.3. Rest of North America
9.6. Market Attractiveness Analysis
9.6.1. By Country
9.6.2. By Delivery Platform
9.6.3. By Broadcaster Type
9.6.4. By Services/ Revenue Model
Chapter 10. Europe Television Broadcasting Services Market Analysis and Forecast
10.1. Key Findings
10.2. Television Broadcasting Services Market Size (US$ Mn) Forecast by Delivery Platform, 2016 - 2026
10.2.1. Digital Terrestrial Broadcast
10.2.2. Satellite Broadcast
10.2.3. Cable Television Broadcasting Services
10.2.4. Internet Protocol Television (IPTV)
10.2.5. Over-the-top Television (OTT)
10.3. Television Broadcasting Services Market Size (US$ Mn) Forecast by Broadcaster Type, 2016 - 2026
10.3.1. Public
10.3.2. Commercial
10.4. Television Broadcasting Services Market Size (US$ Mn) Forecast by Services/ Revenue Model, 2016 - 2026
10.4.1. Subscription
10.4.1.1. Pay-per View
10.4.1.2. On Demand
10.4.2. Advertisement
10.4.2.1. Digital Interactive Broadcasting
10.5. Television Broadcasting Services Market Size (US$ Mn) Forecast By Country, 2016 - 2026
10.5.1. Germany
10.5.2. U.K.
10.5.3. France
10.5.4. Russia
10.5.5. Rest of Europe
10.6. Market Attractiveness Analysis
10.6.1. By Country
10.6.2. By Delivery Platform
10.6.3. By Broadcaster Type
10.6.4. By Services/ Revenue Model
Chapter 11. APAC Television Broadcasting Services Market Analysis and Forecast
11.1. Key Findings
11.2. Television Broadcasting Services Market Size (US$ Mn) Forecast by Delivery Platform, 2016 - 2026
11.2.1. Digital Terrestrial Broadcast
11.2.2. Satellite Broadcast
11.2.3. Cable Television Broadcasting Services
11.2.4. Internet Protocol Television (IPTV)
11.2.5. Over-the-top Television (OTT)
11.3. Television Broadcasting Services Market Size (US$ Mn) Forecast by Broadcaster Type, 2016 - 2026
11.3.1. Public
11.3.2. Commercial
11.4. Television Broadcasting Services Market Size (US$ Mn) Forecast by Services/ Revenue Model, 2016 - 2026
11.4.1. Subscription
11.4.1.1. Pay-per View
11.4.1.2. On Demand
11.4.2. Advertisement
11.4.2.1. Digital Interactive Broadcasting
11.5. Television Broadcasting Services Market Size (US$ Mn) Forecast By Country, 2016 - 2026
11.5.1. China
11.5.2. India
11.5.3. Japan
11.5.4. Australia
11.5.5. Rest of Asia Pacific
11.6. Market Attractiveness Analysis
11.6.1. By Country
11.6.2. By Delivery Platform
11.6.3. By Broadcaster Type
11.6.4. By Services/ Revenue Model
Chapter 12. MEA Television Broadcasting Services Market Analysis and Forecast
12.1. Key Findings
12.2. Television Broadcasting Services Market Size (US$ Mn) Forecast by Delivery Platform, 2016 - 2026
12.2.1. Digital Terrestrial Broadcast
12.2.2. Satellite Broadcast
12.2.3. Cable Television Broadcasting Services
12.2.4. Internet Protocol Television (IPTV)
12.2.5. Over-the-top Television (OTT)
12.3. Television Broadcasting Services Market Size (US$ Mn) Forecast by Broadcaster Type, 2016 - 2026
12.3.1. Public
12.3.2. Commercial
12.4. Television Broadcasting Services Market Size (US$ Mn) Forecast by Services/ Revenue Model, 2016 - 2026
12.4.1. Subscription
12.4.1.1. Pay-per View
12.4.1.2. On Demand
12.4.2. Advertisement
12.4.2.1. Digital Interactive Broadcasting
12.5. Television Broadcasting Services Market Size (US$ Mn) Forecast By Country, 2016 - 2026
12.5.1. GCC
12.5.2. South Africa
12.5.3. Rest of MEA
12.6. Market Attractiveness Analysis
12.6.1. By Country
12.6.2. By Delivery Platform
12.6.3. By Broadcaster Type
12.6.4. By Services/ Revenue Model
Chapter 13. South America Television Broadcasting Services Market Analysis and Forecast
13.1. Key Findings
13.2. Television Broadcasting Services Market Size (US$ Mn) Forecast by Delivery Platform, 2016 - 2026
13.2.1. Digital Terrestrial Broadcast
13.2.2. Satellite Broadcast
13.2.3. Cable Television Broadcasting Services
13.2.4. Internet Protocol Television (IPTV)
13.2.5. Over-the-top Television (OTT)
13.3. Television Broadcasting Services Market Size (US$ Mn) Forecast by Broadcaster Type, 2016 - 2026
13.3.1. Public
13.3.2. Commercial
13.4. Television Broadcasting Services Market Size (US$ Mn) Forecast by Services/ Revenue Model, 2016 - 2026
13.4.1. Subscription
13.4.1.1. Pay-per View
13.4.1.2. On Demand
13.4.2. Advertisement
13.4.2.1. Digital Interactive Broadcasting
13.5. Television Broadcasting Services Market Size (US$ Mn) Forecast By Country, 2016 - 2026
13.5.1. Brazil
13.5.2. Rest of South America
13.6. Market Attractiveness Analysis
13.6.1. By Country
13.6.2. By Delivery Platform
13.6.3. By Broadcaster Type
13.6.4. By Services/ Revenue Model
Chapter 14. Competition Landscape
14.1. Market Player – Competition Matrix
14.2. Market Share Analysis By Company (2017)
14.3. Company Profiles (Details – Overview, Financials, SWOT Analysis, Strategy)
14.3.1. A&E Television Networks, LLC
14.3.1.1. Overview
14.3.1.2. Financials
14.3.1.3. SWOT Analysis
14.3.1.4. Strategy
14.3.2. AT & T, Inc.
14.3.2.1. Overview
14.3.2.2. Financials
14.3.2.3. SWOT Analysis
14.3.2.4. Strategy
14.3.3. British Broadcasting Corporation
14.3.3.1. Overview
14.3.3.2. Financials
14.3.3.3. SWOT Analysis
14.3.3.4. Strategy
14.3.4. CANAL+ GROUP
14.3.4.1. Overview
14.3.4.2. Financials
14.3.4.3. SWOT Analysis
14.3.4.4. Strategy
14.3.5. CBS Interactive
14.3.5.1. Overview
14.3.5.2. Financials
14.3.5.3. SWOT Analysis
14.3.5.4. Strategy
14.3.6. Channel Four Television Corporation
14.3.6.1. Overview
14.3.6.2. Financials
14.3.6.3. SWOT Analysis
14.3.6.4. Strategy
14.3.7. CenturyLink, Inc.
14.3.7.1. Overview
14.3.7.2. Financials
14.3.7.3. SWOT Analysis
14.3.7.4. Strategy
14.3.8. 21st Century Fox
14.3.8.1. Overview
14.3.8.2. Financials
14.3.8.3. SWOT Analysis
14.3.8.4. Strategy
14.3.9. Comcast Corporation
14.3.9.1. Overview
14.3.9.2. Financials
14.3.9.3. SWOT Analysis
14.3.9.4. Strategy
14.3.10. Heartland Media, LLC
14.3.10.1. Overview
14.3.10.2. Financials
14.3.10.3. SWOT Analysis
14.3.10.4. Strategy
14.3.11. RTL Group
14.3.11.1. Overview
14.3.11.2. Financials
14.3.11.3. SWOT Analysis
14.3.11.4. Strategy
14.3.12. Time warner, Inc.
14.3.12.1. Overview
14.3.12.2. Financials
14.3.12.3. SWOT Analysis
14.3.12.4. Strategy
14.3.13. Tivo Corporation
14.3.13.1. Overview
14.3.13.2. Financials
14.3.13.3. SWOT Analysis
14.3.13.4. Strategy
14.3.14. Viacom International, Inc.
14.3.14.1. Overview
14.3.14.2. Financials
14.3.14.3. SWOT Analysis
14.3.14.4. Strategy
Chapter 15. Key Takeaways
List of Tables
Table 1. Infrastructure Expenditure Analysis of Broadcasting Industry (US$ Mn), 2017
Table 2. Spend by Component, 2012, 2017, 2026 (%)
Table 3. Global Television Broadcasting Services Market Revenue (US$ Bn) Forecast, By Delivery Platform, 2016 - 2026
Table 4. Global Television Broadcasting Services Market Revenue (US$ Bn) Forecast, By Broadcaster Type, 2016 - 2026
Table 5. Global Television Broadcasting Services Market Revenue (US$ Bn) Forecast, By Services/ Revenue Model, 2016 - 2026
Table 6. Global Television Broadcasting Services Market Revenue (US$ Bn) Forecast, By Region, 2016 - 2026
Table 7. North America Television Broadcasting Services Market Revenue (US$ Bn) Forecast, By Delivery Platform, 2016 - 2026
Table 8. North America Television Broadcasting Services Market Revenue (US$ Bn) Forecast, By Broadcaster Type, 2016 - 2026
Table 9. North America Television Broadcasting Services Market Revenue (US$ Bn) Forecast, By Services/ Revenue Model, 2016 - 2026
Table 10. North America Television Broadcasting Services Market Revenue (US$ Bn) Forecast, By Country, 2016 - 2026
Table 11. Europe Television Broadcasting Services Market Revenue (US$ Bn) Forecast, By Delivery Platform, 2016 - 2026
Table 12. Europe Television Broadcasting Services Market Revenue (US$ Bn) Forecast, By Broadcaster Type, 2016 - 2026
Table 13. Europe Television Broadcasting Services Market Revenue (US$ Bn) Forecast, By Services/ Revenue Model, 2016 - 2026
Table 14. Europe Television Broadcasting Services Market Revenue (US$ Bn) Forecast, By Country, 2016 - 2026
Table 15. Asia Pacific Television Broadcasting Services Market Revenue (US$ Bn) Forecast, By Delivery Platform, 2016 - 2026
Table 16. Asia Pacific Television Broadcasting Services Market Revenue (US$ Bn) Forecast, By Broadcaster Type, 2016 - 2026
Table 17. Asia Pacific Television Broadcasting Services Market Revenue (US$ Bn) Forecast, By Services/ Revenue Model, 2016 - 2026
Table 18. Asia Pacific Television Broadcasting Services Market Revenue (US$ Bn) Forecast, By Country, 2016 - 2026
Table 19. MEA Television Broadcasting Services Market Revenue (US$ Bn) Forecast, By Delivery Platform, 2016 - 2026
Table 20. MEA Television Broadcasting Services Market Revenue (US$ Bn) Forecast, By Broadcaster Type, 2016 - 2026
Table 21. MEA Television Broadcasting Services Market Revenue (US$ Bn) Forecast, By Services/ Revenue Model, 2016 - 2026
Table 22. MEA Television Broadcasting Services Market Revenue (US$ Bn) Forecast, By Country, 2016 - 2026
Table 23. South America Television Broadcasting Services Market Revenue (US$ Bn) Forecast, By Delivery Platform, 2016 - 2026
Table 24. South America Television Broadcasting Services Market Revenue (US$ Bn) Forecast, By Broadcaster Type, 2016 - 2026
Table 25. South America Television Broadcasting Services Market Revenue (US$ Bn) Forecast, By Services/ Revenue Model, 2016 - 2026
Table 26. South America Television Broadcasting Services Market Revenue (US$ Bn) Forecast, By Country, 2016 – 2026
List of Figures
Figure 1. Trend Analysis of Infrastructure Expenditure (2012-2026) (Y-o-Y)
Figure 2. Global Television Broadcasting Services Market Size (US$ Bn) Forecast, 2016– 2026
Figure 3. Global Television Broadcasting Services Market Y-o-Y Growth (Value %) Forecast, 2016 – 2026
Figure 4. Global Television Broadcasting Services Market Opportunity Analysis, 2016 – 2026
Figure 5. Global Television Broadcasting Services Market Value Share, by Delivery Platform (2018)
Figure 6. Global Television Broadcasting Services Market Value Share, by Delivery Platform (2026)
Figure 7. Global Television Broadcasting Services Market Value Share, by Broadcaster Type (2018)
Figure 8. Global Television Broadcasting Services Market Value Share, by Broadcaster Type (2026)
Figure 9. Global Television Broadcasting Services Market Value Share, by Revenue Stream (2018)
Figure 10. Global Television Broadcasting Services Market Value Share, by Revenue Stream (2026)
Figure 11. Global Television Broadcasting Services Market Value Share, by Delivery Platform (2018)
Figure 12. Global Television Broadcasting Services Market Value Share, by Delivery Platform (2026)
Figure 13. Comparison Matrix: Global Television Broadcasting Services Market, by Delivery Platform
Figure 14. Global Television Broadcasting Services Market Attractiveness Analysis, by Delivery Platform
Figure 15. Global Television Broadcasting ServicesMarket Value Share (%) Analysis, By Broadcaster Type (2018)
Figure 16. Global Television Broadcasting ServicesMarket Value Share (%) Analysis, By Broadcaster Type (2026)
Figure 17. Comparison Matrix: Global Television Broadcasting Services Market, by Broadcaster Type
Figure 18. Television Broadcasting Services Market Attractiveness Analysis, By Broadcaster Type
Figure 19. Global Television Broadcasting ServicesMarket Value Share (%) Analysis, By Services/ Revenue Model (2018)
Figure 20. Global Television Broadcasting ServicesMarket Value Share (%) Analysis, By Services/ Revenue Model (2026)
Figure 21. Comparison Matrix: Global Television Broadcasting Services Market, by Services/ Revenue Model
Figure 22. Television Broadcasting Services Market Attractiveness Analysis, By Services/ Revenue Model
Figure 23. Global Television Broadcasting ServicesMarket Value Share (%) Analysis, By Region (2018)
Figure 24. Global Television Broadcasting ServicesMarket Value Share (%) Analysis, By Region (2026)
Figure 25. Global Television Broadcasting Services Market Attractiveness Analysis, by Region
Figure 26. North America Television Broadcasting Services Market Revenue (US$ Bn) and Y-o-Y Forecast, 2018– 2026
Figure 27. North Television Broadcasting Services Opportunity Growth Analysis (US$ Bn) Forecast, 2016 – 2026
Figure 28. North America Television Broadcasting Services Market Value Share, by Delivery Platform (2018)
Figure 29. North America Television Broadcasting Services Market Value Share, by Delivery Platform (2026)
Figure 30. North America Television Broadcasting ServicesMarket Value Share (%) Analysis, By Broadcaster Type (2018)
Figure 31. North America Television Broadcasting ServicesMarket Value Share (%) Analysis, By Broadcaster Type (2026)
Figure 32. North America Television Broadcasting ServicesMarket Value Share (%) Analysis, By Services/ Revenue Model (2018)
Figure 33. North America Television Broadcasting ServicesMarket Value Share (%) Analysis, By Services/ Revenue Model (2026)
Figure 34. North America Television Broadcasting ServicesMarket Value Share (%) Analysis, By Country (2018)
Figure 35. North America Television Broadcasting ServicesMarket Value Share (%) Analysis, By Country (2026)
Figure 36. North America Television Broadcasting Services Market Attractiveness Analysis, by Delivery Platform
Figure 37. North America Television Broadcasting Services Market Attractiveness Analysis, by Broadcaster Type
Figure 38. North America Television Broadcasting Services Market Attractiveness Analysis, by Services/ Revenue Model
Figure 39. North America Television Broadcasting Services Market Attractiveness Analysis, by Country
Figure 40. Europe Television Broadcasting Services Market Revenue (US$ Bn) and Y-o-Y Forecast, 2018– 2026
Figure 41. Europe Television Broadcasting Services Opportunity Growth Analysis (US$ Bn) Forecast, 2016 – 2026
Figure 42. Europe Television Broadcasting Services Market Value Share, by Delivery Platform (2018)
Figure 43. Europe Television Broadcasting Services Market Value Share, by Delivery Platform (2026)
Figure 44. Europe Television Broadcasting ServicesMarket Value Share (%) Analysis, By Broadcaster Type (2018)
Figure 45. Europe Television Broadcasting ServicesMarket Value Share (%) Analysis, By Broadcaster Type (2026)
Figure 46. Europe Television Broadcasting ServicesMarket Value Share (%) Analysis, By Services/ Revenue Model (2018)
Figure 47. Europe Television Broadcasting ServicesMarket Value Share (%) Analysis, By Services/ Revenue Model (2026)
Figure 48. Europe Television Broadcasting ServicesMarket Value Share (%) Analysis, By Country (2018)
Figure 49. Europe Television Broadcasting ServicesMarket Value Share (%) Analysis, By Country (2026)
Figure 50. Europe Television Broadcasting Services Market Attractiveness Analysis, by Delivery Platform
Figure 51. Europe Television Broadcasting Services Market Attractiveness Analysis, by Broadcaster Type
Figure 52. Europe Television Broadcasting Services Market Attractiveness Analysis, by Services/ Revenue Model
Figure 53. Europe Television Broadcasting Services Market Attractiveness Analysis, by Country
Figure 54. Asia Pacific Television Broadcasting Services Market Revenue (US$ Bn) and Y-o-Y Forecast, 2018– 2026
Figure 55. Asia Pacific Television Broadcasting Services Opportunity Growth Analysis (US$ Bn) Forecast, 2016 – 2026
Figure 56. Asia Pacific Television Broadcasting Services Market Value Share, by Delivery Platform (2018)
Figure 57. Asia Pacific Television Broadcasting Services Market Value Share, by Delivery Platform (2026)
Figure 58. Asia Pacific Television Broadcasting ServicesMarket Value Share (%) Analysis, By Broadcaster Type (2018)
Figure 59. Asia Pacific Television Broadcasting ServicesMarket Value Share (%) Analysis, By Broadcaster Type (2026)
Figure 60. Asia Pacific Television Broadcasting ServicesMarket Value Share (%) Analysis, By Services/ Revenue Model (2018)
Figure 61. Asia Pacific Television Broadcasting ServicesMarket Value Share (%) Analysis, By Services/ Revenue Model (2026)
Figure 62. Asia Pacific Television Broadcasting ServicesMarket Value Share (%) Analysis, By Country (2018)
Figure 63. Asia Pacific Television Broadcasting ServicesMarket Value Share (%) Analysis, By Country (2026)
Figure 64. Asia Pacific Television Broadcasting Services Market Attractiveness Analysis, by Delivery Platform
Figure 65. Asia Pacific Television Broadcasting Services Market Attractiveness Analysis, by Broadcaster Type
Figure 66. Asia Pacific Television Broadcasting Services Market Attractiveness Analysis, by Services/ Revenue Model
Figure 67. Asia Pacific Television Broadcasting Services Market Attractiveness Analysis, by Country
Figure 68. MEA Television Broadcasting Services Market Revenue (US$ Bn) and Y-o-Y Forecast, 2018– 2026
Figure 69. MEA Television Broadcasting Services Opportunity Growth Analysis (US$ Bn) Forecast, 2016 – 2026
Figure 70. MEA Television Broadcasting Services Market Value Share, by Delivery Platform (2018)
Figure 71. MEA Television Broadcasting Services Market Value Share, by Delivery Platform (2026)
Figure 72. MEA Television Broadcasting ServicesMarket Value Share (%) Analysis, By Broadcaster Type (2018)
Figure 73. MEA Television Broadcasting ServicesMarket Value Share (%) Analysis, By Broadcaster Type (2026)
Figure 74. MEA Television Broadcasting ServicesMarket Value Share (%) Analysis, By Services/ Revenue Model (2018)
Figure 75. MEA Television Broadcasting ServicesMarket Value Share (%) Analysis, By Services/ Revenue Model (2026)
Figure 76. MEA Television Broadcasting ServicesMarket Value Share (%) Analysis, By Country (2018)
Figure 77. MEA Television Broadcasting ServicesMarket Value Share (%) Analysis, By Country (2026)
Figure 78. MEA Television Broadcasting Services Market Attractiveness Analysis, by Delivery Platform
Figure 79. MEA Television Broadcasting Services Market Attractiveness Analysis, by Broadcaster Type
Figure 80. MEA Television Broadcasting Services Market Attractiveness Analysis, by Services/ Revenue Model
Figure 81. MEA Television Broadcasting Services Market Attractiveness Analysis, by Country
Figure 82. South America Television Broadcasting Services Market Revenue (US$ Bn) and Y-o-Y Forecast, 2018– 2026
Figure 83. South America Television Broadcasting Services Opportunity Growth Analysis (US$ Bn) Forecast, 2016 – 2026
Figure 84. South America Television Broadcasting Services Market Value Share, by Delivery Platform (2018)
Figure 85. South America Television Broadcasting Services Market Value Share, by Delivery Platform (2026)
Figure 86. South America Television Broadcasting ServicesMarket Value Share (%) Analysis, By Broadcaster Type (2018)
Figure 87. South America Television Broadcasting ServicesMarket Value Share (%) Analysis, By Broadcaster Type (2026)
Figure 88. South America Television Broadcasting ServicesMarket Value Share (%) Analysis, By Services/ Revenue Model (2018)
Figure 89. South America Television Broadcasting ServicesMarket Value Share (%) Analysis, By Services/ Revenue Model (2026)
Figure 90. South America Television Broadcasting ServicesMarket Value Share (%) Analysis, By Country (2018)
Figure 91. South America Television Broadcasting ServicesMarket Value Share (%) Analysis, By Country (2026)
Figure 92. South America Television Broadcasting Services Market Attractiveness Analysis, by Delivery Platform
Figure 93. South America Television Broadcasting Services Market Attractiveness Analysis, by Broadcaster Type
Figure 94. South America Television Broadcasting Services Market Attractiveness Analysis, by Services/ Revenue Model
Figure 95. South America Television Broadcasting Services Market Attractiveness Analysis, by Country
Copyright © Transparency Market Research, Inc. All Rights reserved
Trust Online

Television Broadcasting Services Market