
Reports
Reports
Global OTT Services Market – Snapshot
OTT services are delivered over the internet, however, they don’t have any involvement in the planning or provisioning of service. As these services are directly offered to consumers ‘over the top’ of internet service provider’s network, they have derived the name - over the top services. In response to the proliferation of smartphones and their compatibility with OTT applications, the demand for OTT services is poised to rise exponentially in the coming years. Likewise, affordable rates of high speed mobile internet has bolstered the adoption of OTT market at large.
Th global over the top (OTT) services market has grown by leaps and bounds in recent years, mainly due to the availability of smart technologies amongst the masses. There has been little contention about the utility of OTT services amongst consumers of varying age groups. The consumption of knowledge has been made easier through the use of OTT services and offerings. Moreover, people have become more inclined towards high-end technologies and utility-driven means of consuming informative and entertainment content. The emergence of new OTT platforms has widened the scope of offerings available at the disposal of the masses. Henceforth, the global over the top (OTT) services market is foreseen to grow at a sturdy pace in the years to follow.
Several key entities such as Netflix and Amazon Prime have made a niche for themselves in the global over the top (OTT) services market.
The OTT service providers have emerged as tough competitors for telecom service providers and cable operators. The mobile network operator messaging revenue has already declined to a great extent in the last five years and the impact has started to show up in their voice revenues as well. Also, the number of cord-cutters and cord trimmers has gone up due to on-demand media content available and reasonable rates as compared to traditional cable operators.
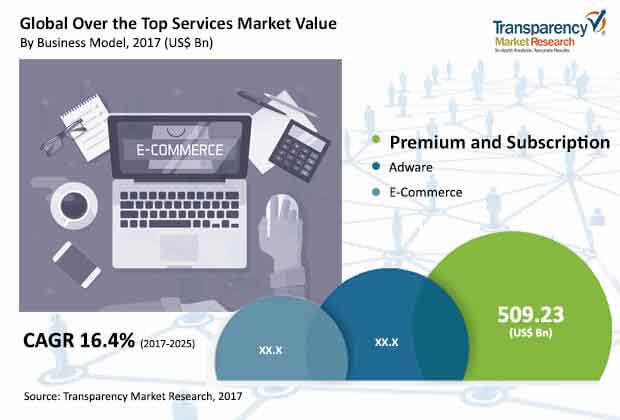
The global over the top services market was valued at US$1,049.21 billion in 2017 and the demand for OTT is estimated to expand at a CAGR of 16.4% from 2017 to 2025, reaching a value of US$3,538.04 billion by 2025.
Premium and Subscription Emerge as Leading Segment based on Business Model
On the basis of business model, the market is segmented into premium and subscriptions, adware, and ecommerce. The premium and subscription business model segment emerged dominant with a share of nearly 48.5% in the overall market in 2017. The segment earns revenue from fixed fee that the customer pays to download and access their application. The memberships or freemium turned premium service applications are also part of premium and subscriptions’ business model. Revenue generated by the premium and subscription segment is expected to increase owing to the increase in revenue of OTT media content and cloud service applications. The adware business model that earns revenue from advertisements on OTT applications is also expected to contribute for the OTT market. The ecommerce business model earns revenue from sales of its own products and services.
E-services that comprise of e-learning, e-health, e-business and e-commerce was the largest application segment in terms of revenue in the OTT services market in 2017, generating a revenue of 447.60 billion. The e-services segment is also anticipated to hold its foremost place throughout the forecast period. Media content and cloud services are also expected to produce higher revenues in the forthcoming period owing to quick content and service on demand made available through high speed internet at a reasonable price.
Asia Pacific to Showcase Higher CAGR than Other Regional Segments
North America led the OTT services market in 2017 and is expected to remain dominant throughout the forecast period 2017 to 2025. The primary drivers for the growth of OTT services market in North America region are the highest mobile internet penetration levels as compared to other regions with internet speed from 13.1 Mbps to 14 Mbps in the U.S.A and Canada. Apart from North America, Europe and Asia Pacific are expected to experience significant growth in the OTT services market during the forecast period. TMR forecasts the Asia Pacific OTT services market to exhibit the highest CAGR of 16.1% between 2017 and 2025.
Based on end use, the global OTT services market can be bifurcated into personal and commercial segments. Among end-use verticals, the commercial segment emerged dominant in the OTT services market. Within the commercial segment, the ecommerce sector held the largest share of 32.1% in 2017. Apart from ecommerce, the media and entertainment, IT, education, and healthcare held considerable share within the commercial segment. This trend is expected to continue prevailing in the coming years owing to the increasing application of OTT in media and entertainment, and ecommerce.
Major OTT services market players profiled in the report are Amazon Inc., Twitter Inc., Netflix, Inc., Facebook, Inc., Dropbox, Inc., Google, Inc., LinkedIn Corporation, Skype (Microsoft Corporation), Apple, Inc., Evernote Corporation, Hulu, LLC., and Rakuten, Inc.
1. Preface
1.1. Market Definition and Scope
1.2. Market Segmentation
1.3. Key Research Objectives
1.4. Research Highlights
2. Assumptions and Research Methodology
3. Executive Summary: Global Over The Top (OTT) Services Market
4. Market Overview
4.1. Introduction
4.1.1. Definitions
4.1.2. Industry Evolution / Developments
4.2. Global OTT Services Market Overview
4.3. Key Market Indicators
4.4. Market Dynamics
4.4.1. Drivers
4.4.2. Restraints
4.4.3. Opportunity
4.5. Global OTT Services Market Analysis and Forecasts, 2015 – 2025
4.5.1. Market Revenue Projections (US$ Bn)
4.6. Porter’s Five Force Analysis
4.7. Ecosystem Analysis
4.8. Market Outlook
5. Global OTT Services Market Analysis and Forecasts, By Business Model
5.1. Introduction & Definition
5.2. Key Findings / Developments
5.3. Key Trends
5.4. Market Size (US$ Bn) Forecast By Business Model 2015 – 2025 (US$ Bn)
5.4.1. Premium and Subscriptions
5.4.2. Adware
5.4.3. E-commerce
5.5. Business Model Comparison Matrix
5.6. Market Attractiveness By Business Model
6. Global OTT Services Market Analysis and Forecasts, By Application
6.1. Introduction & Definition
6.2. Key Findings / Developments
6.3. Key Trends
6.4. Market Size (US$ Bn) Forecast By Application 2015 – 2025 (US$ Bn)
6.4.1. Communication
6.4.2. E-Services
6.4.3. Media Content
6.4.3.1. Audio/Video
6.4.3.2. Gaming
6.4.3.3. Web Content
6.4.4. Cloud Services
6.5. Application Comparison Matrix
6.6. Market Attractiveness By Application
7. Global OTT Services Market Analysis and Forecasts, By End-use Vertical
7.1. Introduction & Definition
7.2. Key Findings / Developments
7.3. Key Trends
7.4. Market Size (US$ Bn) Forecast By End-use Vertical, 2015 – 2025 (US$ Bn)
7.4.1. Personal
7.4.2. Commercial
7.4.2.1. Healthcare
7.4.2.2. Media and Entertainment
7.4.2.3. Ecommerce
7.4.2.4. IT
7.4.2.5. Education
7.4.2.6. Others (Manufacturing, Energy and Transportation)
7.5. End-use Vertical Comparison Matrix
7.6. Market Attractiveness By End-use Vertical
8. Global OTT Services Market Analysis and Forecasts, By Region
8.1. Key Findings
8.2. Market Size (US$ Bn) Forecast By Region, 2015 – 2025 (US$ Bn)
8.2.1. North America
8.2.2. Europe
8.2.3. Asia Pacific
8.2.4. Middle East and Africa
8.2.5. South America
8.3. Market Attractiveness By Country/Region
9. North America OTT Services Market Analysis and Forecast
9.1. Key Findings
9.2. Key Trends
9.3. Market Size (US$ Bn) Forecast By Business Model, 2015 – 2025 (US$ Bn)
9.3.1. Premium and Subscriptions
9.3.2. Adware
9.3.3. E-commerce
9.4. Market Size (US$ Bn) Forecast By Application 2015 – 2025 (US$ Bn)
9.4.1. Communication
9.4.2. E-Services
9.4.3. Media Content
9.4.3.1. Audio/Video
9.4.3.2. Gaming
9.4.3.3. Web Content
9.4.4. Cloud Services
9.5. Market Size (US$ Bn) Forecast By End-use Vertical, 2015 – 2025 (US$ Bn)
9.5.1. Personal
9.5.2. Commercial
9.5.2.1. Healthcare
9.5.2.2. Media and Entertainment
9.5.2.3. Ecommerce
9.5.2.4. IT
9.5.2.5. Education
9.5.2.6. Others (Manufacturing, Energy and Transportation)
9.6. Market Size (US$ Bn) Forecast By Country, 2015 – 2025 (US$ Bn)
9.6.1. The U.S.
9.6.2. Canada
9.6.3. Rest of North America
9.7. Market Attractiveness Analysis
9.7.1. By Country
9.7.2. By Business Model
9.7.3. By Application
9.7.4. By End-use Vertical
10. Europe OTT Services Market Analysis and Forecast
10.1. Key Findings
10.2. Key Trends
10.3. Market Size (US$ Bn) Forecast By Business Model, 2015 – 2025 (US$ Bn)
10.3.1. Premium and Subscriptions
10.3.2. Adware
10.3.3. E-commerce
10.4. Market Size (US$ Bn) Forecast By Application 2015 – 2025 (US$ Bn)
10.4.1. Communication
10.4.2. E-Services
10.4.3. Media Content
10.4.3.1. Audio/Video
10.4.3.2. Gaming
10.4.3.3. Web Content
10.4.4. Cloud Services
10.5. Market Size (US$ Bn) Forecast By End-use Vertical, 2015 – 2025 (US$ Bn)
10.5.1. Personal
10.5.2. Commercial
10.5.2.1. Healthcare
10.5.2.2. Media and Entertainment
10.5.2.3. IT
10.5.2.4. Education
10.5.2.5. Others (Manufacturing, Energy and Transportation)
10.6. Market Size (US$ Bn) Forecast By Country, 2015 – 2025 (US$ Bn)
10.6.1. Germany
10.6.2. France
10.6.3. The U.K.
10.6.4. Rest of Europe
10.7. Market Attractiveness Analysis
10.7.1. By Country
10.7.2. By Business Model
10.7.3. By Application
10.7.4. By End-use Vertical
11. Asia Pacific OTT Services Market Analysis and Forecast
11.1. Key Findings
11.2. Key Trends
11.3. Market Size (US$ Bn) Forecast By Business Model, 2015 – 2025 (US$ Bn)
11.3.1. Premium and Subscriptions
11.3.2. Adware
11.3.3. E-commerce
11.4. Market Size (US$ Bn) Forecast By Application 2015 – 2025 (US$ Bn)
11.4.1. Communication
11.4.2. E-Services
11.4.3. Media Content
11.4.3.1. Audio/Video
11.4.3.2. Gaming
11.4.3.3. Web Content
11.4.4. Cloud Services
11.5. Market Size (US$ Bn) Forecast By End-use Vertical, 2015 – 2025 (US$ Bn)
11.5.1. Personal
11.5.2. Commercial
11.5.2.1. Healthcare
11.5.2.2. Media and Entertainment
11.5.2.3. Ecommerce
11.5.2.4. IT
11.5.2.5. Education
11.5.2.6. Others (Manufacturing, Energy and Transportation)
11.6. Market Size (US$ Bn) Forecast By Country, 2015 – 2025 (US$ Bn)
11.6.1. China
11.6.2. Japan
11.6.3. Rest of Asia Pacific
11.7. Market Attractiveness Analysis
11.7.1. By Country
11.7.2. By Business Model
11.7.3. By Application
11.7.4. By End-use Vertical
12. Middle East and Africa OTT Services Market Analysis and Forecast
12.1. Key Findings
12.2. Key Trends
12.3. Market Size (US$ Bn) Forecast By Business Model, 2015 – 2025 (US$ Bn)
12.3.1. Premium and Subscriptions
12.3.2. Adware
12.3.3. E-commerce
12.4. Market Size (US$ Bn) Forecast By Application 2015 – 2025 (US$ Bn)
12.4.1. Communication
12.4.2. E-Services
12.4.3. Media Content
12.4.3.1. Audio/Video
12.4.3.2. Gaming
12.4.3.3. Web Content
12.4.4. Cloud Services
12.5. Market Size (US$ Bn) Forecast By End-use Vertical, 2015 – 2025 (US$ Bn)
12.5.1. Personal
12.5.2. Commercial
12.5.2.1. Healthcare
12.5.2.2. Media and Entertainment
12.5.2.3. Ecommerce
12.5.2.4. IT
12.5.2.5. Education
12.5.2.6. Others (Manufacturing, Energy and Transportation)
12.6. Market Size (US$ Bn) Forecast By Country, 2015 – 2025 (US$ Bn)
12.6.1. GCC
12.6.2. South Africa
12.6.3. Rest of MEA
12.7. Market Attractiveness Analysis
12.7.1. By Country
12.7.2. By Business Model
12.7.3. By Application
12.7.4. By End-use Vertical
13. South America OTT Services Market Analysis and Forecast
13.1. Key Findings
13.2. Key Trends
13.3. Market Size (US$ Bn) Forecast By Business Model, 2015 – 2025 (US$ Bn)
13.3.1. Premium and Subscriptions
13.3.2. Adware
13.3.3. E-commerce
13.4. Market Size (US$ Bn) Forecast By Application 2015 – 2025 (US$ Bn)
13.4.1. Communication
13.4.2. E-Services
13.4.3. Media Content
13.4.3.1. Audio/Video
13.4.3.2. Gaming
13.4.3.3. Web Content
13.4.4. Cloud Services
13.5. Market Size (US$ Bn) Forecast By End-use Vertical, 2015 – 2025 (US$ Bn)
13.5.1. Personal
13.5.2. Commercial
13.5.2.1. Healthcare
13.5.2.2. Media and Entertainment
13.5.2.3. Ecommerce
13.5.2.4. IT
13.5.2.5. Education
13.5.2.6. Others (Manufacturing, Energy and Transportation)
13.6. Market Size (US$ Bn) Forecast By Country, 2015 – 2025 (US$ Bn)
13.6.1. Brazil
13.6.2. Rest of South America
13.7. Market Attractiveness Analysis
13.7.1. By Country
13.7.2. By Business Model
13.7.3. By Application
13.7.4. By End-use Vertical
14. Competition Landscape
14.1. Market Player – Competition Matrix (By Tier and Size of Companies)
14.2. Market Share Analysis By Company (2016)
14.3. Company Profiles (Details – Overview, Financials, Recent Developments, Strategy)
14.3.1. Players
14.3.1.1. Facebook, Inc.
14.3.1.1.1. Company Details (HQ, Foundation Year, Revenue, Employee Strength)
14.3.1.1.2. Company Description
14.3.1.1.3. SWOT Analysis
14.3.1.1.4. Strategic Overview
14.3.1.2. Twitter Inc.
14.3.1.2.1. Company Details (HQ, Foundation Year, Revenue, Employee Strength)
14.3.1.2.2. Company Description
14.3.1.2.3. SWOT Analysis
14.3.1.2.4. Strategic Overview
14.3.1.3. LinkedIn Corp.
14.3.1.3.1. Company Details (HQ, Foundation Year, Revenue, Employee Strength)
14.3.1.3.2. Company Description
14.3.1.3.3. SWOT Analysis
14.3.1.3.4. Strategic Overview
14.3.1.4. Netflix, Inc.
14.3.1.4.1. Company Details (HQ, Foundation Year, Revenue, Employee Strength)
14.3.1.4.2. Company Description
14.3.1.4.3. SWOT Analysis
14.3.1.4.4. Strategic Overview
14.3.1.5. Google, Inc.
14.3.1.5.1. Company Details (HQ, Foundation Year, Revenue, Employee Strength)
14.3.1.5.2. Company Description
14.3.1.5.3. SWOT Analysis
14.3.1.5.4. Strategic Overview
14.3.1.6. Skype (Microsoft Corporation)
14.3.1.6.1. Company Details (HQ, Foundation Year, Revenue, Employee Strength)
14.3.1.6.2. Company Description
14.3.1.6.3. SWOT Analysis
14.3.1.6.4. Strategic Overview
14.3.1.7. Amazon Inc.
14.3.1.7.1. Company Details (HQ, Foundation Year, Revenue, Employee Strength)
14.3.1.7.2. Company Description
14.3.1.7.3. SWOT Analysis
14.3.1.7.4. Strategic Overview
14.3.1.8. Apple, Inc.
14.3.1.8.1. Company Details (HQ, Foundation Year, Revenue, Employee Strength)
14.3.1.8.2. Company Description
14.3.1.8.3. SWOT Analysis
14.3.1.8.4. Strategic Overview
14.3.1.9. Rakuten, Inc.
14.3.1.9.1. Company Details (HQ, Foundation Year, Revenue, Employee Strength)
14.3.1.9.2. Company Description
14.3.1.9.3. SWOT Analysis
14.3.1.9.4. Strategic Overview
14.3.1.10. Evernote Corporation
14.3.1.10.1. Company Details (HQ, Foundation Year, Revenue, Employee Strength)
14.3.1.10.2. Company Description
14.3.1.10.3. SWOT Analysis
14.3.1.10.4. Strategic Overview
14.3.1.11. Dropbox, Inc.
14.3.1.11.1. Company Details (HQ, Foundation Year, Revenue, Employee Strength)
14.3.1.11.2. Company Description
14.3.1.11.3. SWOT Analysis
14.3.1.11.4. Strategic Overview
14.3.1.12. Hulu, LLC
14.3.1.12.1. Company Details (HQ, Foundation Year, Revenue, Employee Strength)
14.3.1.12.2. Company Description
14.3.1.12.3. SWOT Analysis
14.3.1.12.4. Strategic Overview
15. Key Takeaways
List of Tables
Table 1: Global OTT Market Forecast, By Business Model, 2015–2025 (US$ Bn)
Table 2: Global OTT Market Forecast, By Application, 2015–2025 (US$ Bn)
Table 3: Global OTT Market Forecast, By Media Content, 2015–2025 (US$ Bn)
Table 4: Global OTT Market Forecast, By End-use Vertical, 2015–2025 (US$ Bn)
Table 5: Global OTT Market Forecast, By Commercial, 2015–2025 (US$ Bn)
Table 6: Global OTT Market Forecast, By Region, 2015–2025 (US$ Bn)
Table 7: North America OTT Market Forecast, By Business Model, 2015–2025 (US$ Bn)
Table 8: North America OTT Market Forecast, By Application, 2015–2025 (US$ Bn)
Table 9: North America VR Market Forecast, By Media Content, 2015–2025 (US$ Bn)
Table 10: North America OTT Market Forecast, By End-use Vertical, 2015–2025 (US$ Bn)
Table 11: North America OTT Market Forecast, By Commercial, 2015–2025 (US$ Bn)
Table 12: North America OTT Market Forecast, By Country, 2015–2025 (US$ Bn)
Table 13: Europe OTT Market Forecast, By Business Model, 2015–2025 (US$ Bn)
Table 14: Europe OTT Market Forecast, By Application, 2015–2025 (US$ Bn)
Table 15: Europe VR Market Forecast, By Media Content, 2015–2025 (US$ Bn)
Table 16: Europe OTT Market Forecast, By End-use Vertical, 2015–2025 (US$ Bn)
Table 17: Europe OTT Market Forecast, By Commercial, 2015–2025 (US$ Bn)
Table 18: Europe OTT Market Forecast, By Country, 2015–2025 (US$ Bn)
Table 19: APAC OTT Market Forecast, By Business Model, 2015–2025 (US$ Bn)
Table 20: APAC OTT Market Forecast, By Application, 2015–2025 (US$ Bn)
Table 21: APAC VR Market Forecast, By Media Content, 2015–2025 (US$ Bn)
Table 22: APAC OTT Market Forecast, By End-use Vertical, 2015–2025 (US$ Bn)
Table 23: APAC OTT Market Forecast, By Commercial, 2015–2025 (US$ Bn)
Table 24: APAC OTT Market Forecast, By Country, 2015–2025 (US$ Bn)
Table 25: MEA OTT Market Forecast, By Business Model, 2015–2025 (US$ Bn)
Table 26: MEA OTT Market Forecast, By Application, 2015–2025 (US$ Bn)
Table 27: MEA VR Market Forecast, By Media Content, 2015–2025 (US$ Bn)
Table 28: MEA OTT Market Forecast, By End-use Vertical, 2015–2025 (US$ Bn)
Table 29: MEA OTT Market Forecast, By Commercial, 2015–2025 (US$ Bn)
Table 30: MEA OTT Market Forecast, By Country, 2015–2025 (US$ Bn)
Table 31: South America OTT Market Forecast, By Business Model, 2015–2025 (US$ Bn)
Table 32: South America OTT Market Forecast, By Application, 2015–2025 (US$ Bn)
Table 33: South America VR Market Forecast, By Media Content, 2015–2025 (US$ Bn)
Table 34: South America OTT Market Forecast, By End-use Vertical, 2015–2025 (US$ Bn)
Table 35: South America OTT Market Forecast, By Commercial, 2015–2025 (US$ Bn)
Table 36: South America OTT Market Forecast, By Country, 2015–2025 (US$ Bn)
List of Figures
Figure 1: Market Revenue Projections, 2015 – 2025 (US$ Bn)
Figure 2: Market Value Share By Business Model (2017)
Figure 4: Market Value Share By End-use Vertical (2017)
Figure 3: Market Value Share By Application (2017)
Figure 5: Market Value Share By Geography (2017)
Figure 6: Global OTT Market Value Share Analysis, By Business Model, 2017 and 2025
Figure 7: Premium & Subscription Graph
Figure 8: Adware Graph
Figure 9: E-commerce Graph
Figure 10: Business Model Comparison Matrix
Figure 11: OTT Market Attractiveness Analysis, By Business Model
Figure 12: Global OTT Market Value Share Analysis, By Application, 2017 and 2025
Figure 13: Communication Graph
Figure 14: E-services Graph
Figure 15: Media Content Graph
Figure 16: Cloud Service Graph
Figure 17: Global OTT Market Value Share Analysis, By Media Content, 2017 and 2025
Figure 18: Application Comparison Matrix
Figure 19: Global OTT Market Forecast, By Application
Figure 20: Global OTT Market Value Share Analysis, By End-use Vertical, 2017 and 2025
Figure 21: Personal Graph
Figure 22: Commercial Graph
Figure 23: Global OTT Market Value Share Analysis, By Commercial, 2017 and 2025
Figure 24: End-use Vertical Comparison Matrix
Figure 25: Global OTT Market Forecast, By End-use Vertical
Figure 26: OTT Market CAGR (2017 – 2025) Analysis, By Country
Figure 27: OTT Market Attractiveness Analysis, By Region
Figure 28: North America OTT Market Revenue (US$ Bn) and Y-o-Y Forecast, 2017 – 2025
Figure 29: North America OTT Market Value Share Analysis, By Business Model, 2017 and 2025
Figure 30: North America OTT Market Value Share Analysis, By Application, 2017 and 2025
Figure 31: North America OTT Market Value Share Analysis, By End-use Vertical, 2017 and 2025
Figure 32: North America OTT Market Value Share Analysis, By Country, 2017 and 2025
Figure 33: North America OTT Market Attractiveness Analysis, By Business Model
Figure 34: North America OTT Market Attractiveness Analysis, By Application
Figure 35: North America OTT Market Attractiveness Analysis, By End-use Vertical
Figure 36: North America OTT Market Attractiveness Analysis, By Country
Figure 37: Europe OTT Market Revenue (US$ Bn) and Y-o-Y Forecast, 2017 – 2025
Figure 38: Europe OTT Market Value Share Analysis, By Business Model, 2017 and 2025
Figure 39: Europe OTT Market Value Share Analysis, By Application, 2017 and 2025
Figure 40: Europe OTT Market Value Share Analysis, By End-use Vertical, 2017 and 2025
Figure 41: Europe OTT Market Value Share Analysis, By Country, 2017 and 2025
Figure 42: Europe OTT Market Attractiveness Analysis, By Business Model
Figure 43: Europe OTT Market Attractiveness Analysis, By Application
Figure 44: Europe OTT Market Attractiveness Analysis, By End-use Vertical
Figure 45: Europe OTT Market Attractiveness Analysis, By Country
Figure 46: APAC OTT Market Revenue (US$ Bn) and Y-o-Y Forecast, 2017 – 2025
Figure 47: APAC OTT Market Value Share Analysis, By Business Model, 2017 and 2025
Figure 48: APAC OTT Market Value Share Analysis, By Application, 2017 and 2025
Figure 49: APAC OTT Market Value Share Analysis, By End-use Vertical, 2017 and 2025
Figure 50: APAC OTT Market Value Share Analysis, By Country, 2017 and 2025
Figure 51: APAC OTT Market Attractiveness Analysis, By Business Model
Figure 52: APAC OTT Market Attractiveness Analysis, By Application
Figure 53: APAC OTT Market Attractiveness Analysis, By End-use Vertical
Figure 54: APAC OTT Market Attractiveness Analysis, By Country
Figure 55: MEA OTT Market Revenue (US$ Bn) and Y-o-Y Forecast, 2017 – 2025
Figure 56: MEA OTT Market Value Share Analysis, By Business Model, 2017 and 2025
Figure 57: MEA OTT Market Value Share Analysis, By Application, 2017 and 2025
Figure 58: MEA OTT Market Value Share Analysis, By End-use Vertical, 2017 and 2025
Figure 59: MEA OTT Market Value Share Analysis, By Country, 2017 and 2025
Figure 60: MEA OTT Market Attractiveness Analysis, By Business Model
Figure 61: MEA OTT Market Attractiveness Analysis, By Application
Figure 62: MEA OTT Market Attractiveness Analysis, By End-use Vertical
Figure 63: MEA OTT Market Attractiveness Analysis, By Country
Figure 64: South America OTT Market Revenue (US$ Bn) and Y-o-Y Forecast, 2017 – 2025
Figure 65: South America OTT Market Value Share Analysis, By Business Model, 2017 and 2025
Figure 66: South America OTT Market Value Share Analysis, By Application, 2017 and 2025
Figure 67: South America OTT Market Value Share Analysis, By End-use Vertical, 2017 and 2025
Figure 68: South America OTT Market Value Share Analysis, By Country, 2017 and 2025
Figure 69: South America OTT Market Attractiveness Analysis, By Business Model
Figure 70: South America OTT Market Attractiveness Analysis, By Application
Figure 71: South America OTT Market Attractiveness Analysis, By End-use Vertical
Figure 72: South America OTT Market Attractiveness Analysis, By Country
Figure 73: Global OTT Market Share Analysis (2017)
Copyright © Transparency Market Research, Inc. All Rights reserved
Trust Online

Over the Top (OTT) Services Market