

Reports
Reports
The global petrochemicals market size was valued at USD 568.7 Billion in 2025 and is projected to reach USD 903.6 Billion by 2036, expanding at a CAGR of 4.3% from 2026 to 2036. The market is primarily driven by rising demand for plastics and polymer-based products, along with rapid industrialization and infrastructure development in emerging economies.
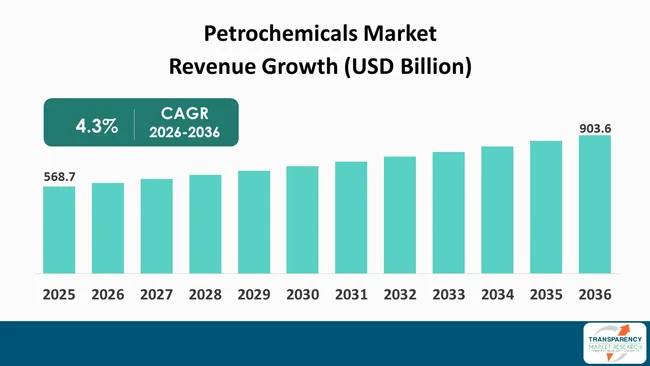
The global petrochemicals market is expanding due to rising demand for plastics, packaging materials, automotive components, construction materials, electronic products, pharmaceuticals, and consumer goods. The increasing pace of industrialization, urbanization, and infrastructural developments in developing countries, particularly across Asia Pacific and the Middle East, is increasing the use of petrochemical products. Petrochemical products such as ethylene, propylene, polyethylene, polypropylene, aromatics, and methanol act as significant raw materials for many end-use industries.
The manufacture of petrochemicals starts from the process of crude oil or natural gas feedstock and is then refined, cracked, distilled, and synthesized to produce basic chemicals that further form polymers, resins, solvents, and derivatives. Major players are investing in new refineries and petrochemical plants, feedstock optimization, capacity expansion, and specialty chemical production. Leading firms are implementing innovative processing technologies, recycling systems, circular feedstocks, and reducing their carbon footprint. All these capacity expansions, innovations, and sustainability practices are helping in the development of the market.
Petrochemicals are chemicals produced primarily from crude oil and natural gas feedstocks and are used as raw materials across a wide range of industries. Production of such chemicals involves the processing of hydrocarbons into a range of chemicals that include ethylene, propylene, benzene, toluene, xylene, and many more by means of methods such as steam cracking, catalytic reforming, separation, and chemical synthesis. These chemicals are used in the manufacture of polymers, resins, synthetic fibers, solvents, rubber, and other industrial materials. Petrochemicals find applications in packaging, automobile parts, building materials, textiles, electronic goods, healthcare products, agriculture, paints and coatings, among others. Versatility and durability are some of the reasons why petrochemicals are preferred in various industries. Industrialization and increased demand for plastics and chemical products are driving the petrochemicals market.
| Attribute | Detail |
|---|---|
| Petrochemicals Market Drivers |
|
Rising consumption of plastics and polymers across packaging, automotive, construction, electronics, medical, agriculture, and consumer goods applications is a major driver of the petrochemicals market. Materials such as polyethylene, polypropylene, PVC, and polystyrene offer advantages including lightweight properties, durability, chemical stability, flexibility, and relatively low cost. This has resulted in more consumption of polymer based products in place of traditional products such as metals, glass, and paper in various industries. Packaging continues to be an important application due to the growing demand for flexible packaging, containers, bottles, films, and protective packaging.
Demand for polymers is also rising in the automotive and transportation industries due to increased usage of lightweight polymers and engineering plastics in order to reduce weight and increase fuel efficiency of vehicles. In addition, the construction industry continues to use petrochemicals in pipes, insulators, flooring, roofing, coatings, adhesives, and other building materials. Rising healthcare expenditure is also supporting demand for polymer-based medical equipment and disposable devices.
Moreover, changes in consumer behavior and urbanization tendencies are causing an increase in demand for food packaging, consumer goods, personal care products, home appliances, and electronic goods. Many of these products rely on petrochemical-based resins, encouraging manufacturers to expand capacity and develop more durable and recyclable polymers. Increased demand for plastics from different application industries would increase the demand for feedstock and cause investments across the entire value chain of petrochemicals.
The petrochemicals market is benefiting from rapid industrialization, urbanization, and infrastructure development across emerging economies. Investments are being made in manufacturing capacity, residential and commercial construction, transportation infrastructure, utilities, and industrial projects in countries belonging to Asia-Pacific region, Middle East, Latin America, and Africa. Such developments require large amounts of plastic, synthetic material, coating, adhesives, insulation material, piping, cables, and other petrochemical-based products which in turn result in increased downstream demand for petrochemical products.
Manufacturing industries represent an important source of petrochemical demand because there are applications of petrochemical products in different industries. Increase in automobile manufacturing results in higher demand for polymers, synthetic rubber, coatings, and specialty chemicals, while increase in electronics manufacturing increases demand for plastics, solvents, resins, and insulation materials. Similarly, modernization of the agriculture sector is increasing demand for plastic films, irrigation pipes, fertilizers, crop-protection chemicals, and other petrochemical-related products. Higher disposable incomes have led to increased consumption of food packaging, consumer electronic goods, and household goods.
In order to capitalize on this trend, leading petrochemical manufacturers are increasing their investments in new plants, capacity expansions, and export facilities as well as integrated refineries and petrochemical complexes in areas that exhibit growth potential. The integration with refining operations allows the manufacturers to optimize feedstock supply and streamline their production process. In addition, several governments of emerging economies have started to encourage manufacturing and industry growth within their nations by investing in infrastructure and industrial policy.
| Attribute | Detail |
|---|---|
| Petrochemicals Market Opportunity |
|
The shift towards a more circular economy and reduced carbon footprint in manufacturing processes creates a significant opportunity for petrochemical producers. The ever-increasing regulatory pressure and customer expectations for more sustainable production are pushing manufacturers to use recycled plastics, bio-materials and waste-derived raw materials in their petrochemical supply chains. Manufacturers have an opportunity to produce chemically recycled polymers and circular-grade materials while maintaining the performance characteristics required across packaging, automotive, electronics, and consumer applications. This may require investments in the form of advanced recycling technologies, waste collection systems and facilities for chemical recycling. Additionally, collaboration with packaging companies, recyclers, and technology providers can support commercialization.
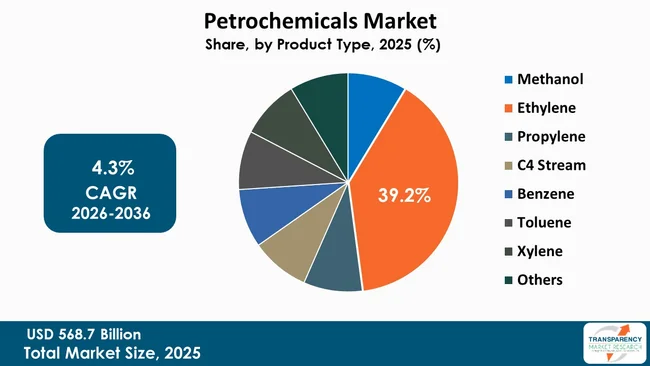
The ethylene segment dominated the global petrochemicals market in 2025, accounting for approximately 39.2% of total market revenue owing to its widespread application as a fundamental raw material for downstream products. It is mainly used to produce polyethylene, ethylene oxide, ethylene dichloride, styrene, and is employed to create packaging materials, building products, vehicles, textiles, and consumer goods. The increasing requirement of plastics and polymers such as polyethylene packaging is driving demand and supporting expansion of ethylene production capacity.
Ethylene is a colorless, highly flammable gaseous hydrocarbon. It is one of the main chemical compounds and is primarily derived from crude oil and natural gas. Ethylene is an important raw material that is required to produce polyethylene, ethylene oxide, ethylene dichloride, styrene, etc.
| Attribute | Detail |
|---|---|
| Leading Region |
|
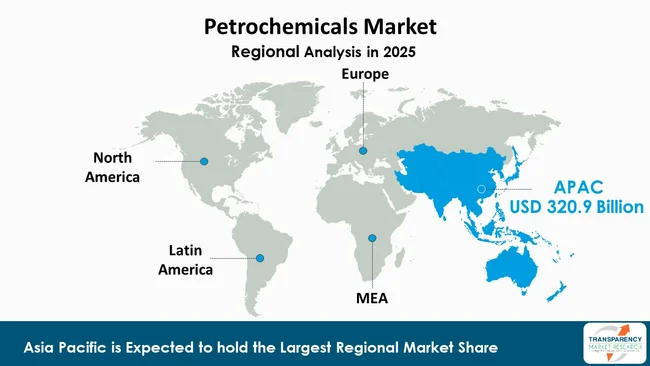
Asia Pacific dominated the global petrochemicals market in 2025, accounting for approximately 56.4% of total market revenue. The region’s leading position is supported by rapid industrialization, urbanization, manufacturing expansion, and strong downstream demand across China, India, Southeast Asia, and other regional markets. High demand for plastics, packaging materials, automobile components, electronics, construction material and consumer goods results in high consumption of petrochemicals. Refining and petrochemical capacity has expanded across the region in response to growing domestic demand and export opportunities.
The main companies participating in the market include Sinopec, Reliance Industries Limited, Indian Oil Corporation Limited, INEOS Group Ltd., TotalEnergies, BASF SE, Braskem, ExxonMobil Corporation, and SABIC. The companies manufacture ethylene, propylene, polyethylene (HDPE/LLDPE), polypropylene, aromatics, benzene, toluene, butadiene, styrene, glycols, methanol, PVC, polystyrene, engineering plastics, specialty chemicals, and other petrochemicals derivatives that are employed in various applications such as packaging, automotive, construction, electronics, health care, and consumer goods.
Besides the mentioned companies, some other important players operating in the market are LyondellBasell Industries Holdings B.V., Formosa Petrochemical Corporation, LG Chem, Rongsheng Petrochemical Co., Ltd., Shell PLC, GAIL (India) Limited.
Each of these players has been profiled in the Petrochemicals market research report based on parameters such as company overview, financial overview, business strategies, product portfolio, business segments, and recent developments.
| Attribute | Detail |
|---|---|
| Market Size Value in 2025 | USD 568.7 Billion |
| Market Forecast Value in 2036 | USD 903.6 Billion |
| Growth Rate (CAGR) | 4.3% |
| Forecast Period | 2026-2036 |
| Historical Data Available for | 2021-2025 |
| Quantitative Units | USD Billion for Value and Tons for Volume |
| Market Analysis | It includes cross-segment analysis at the global as well as regional level. The qualitative analysis includes drivers, restraints, Petrochemicals market opportunities, key trends, Porter’s Five Forces analysis, value chain analysis, and key trend analysis. |
| Competition Landscape |
|
| Format | Electronic (PDF) + Excel |
| Market Segmentation | Product Type
|
| Regions Covered |
|
| Countries Covered |
|
| Companies Profiled |
|
| Customization Scope | Available upon request |
| Pricing | Available upon request |
The petrochemicals market was valued at USD 568.7 Billion in 2025.
The petrochemicals industry is expected to expand at a CAGR of 4.3% from 2026 to 2036.
Key drivers include rising demand for plastics and polymer-based products, along with rapid industrialization and infrastructure development in emerging economies.
The Ethylene segment accounted for the largest share of the market, representing 39.2% in 2025.
Asia Pacific was the most lucrative region in 2025.
Sinopec, Dow Inc., LyondellBasell, INEOS Group Ltd., and SABIC are the major players in the petrochemicals market.
Table 1: Global Petrochemicals Market Volume (Tons) Forecast, by Product Type, 2026 to 2036
Table 2: Global Petrochemicals Market Value (USD Billion) Forecast, by Product Type, 2026 to 2036
Table 3: Global Petrochemicals Market Volume (Tons) Forecast, by Feedstock, 2026 to 2036
Table 4: Global Petrochemicals Market Value (USD Billion) Forecast, by Feedstock, 2026 to 2036
Table 5: Global Petrochemicals Market Volume (Tons) Forecast, by End-use, 2026 to 2036
Table 6: Global Petrochemicals Market Value (USD Billion) Forecast, by End-use, 2026 to 2036
Table 7: Global Petrochemicals Market Volume (Tons) Forecast, by Region, 2026 to 2036
Table 8: Global Petrochemicals Market Value (USD Billion) Forecast, by Region, 2026 to 2036
Table 9: North America Petrochemicals Market Volume (Tons) Forecast, by Product Type, 2026 to 2036
Table 10: North America Petrochemicals Market Value (USD Billion) Forecast, by Product Type, 2026 to 2036
Table 11: North America Petrochemicals Market Volume (Tons) Forecast, by Feedstock, 2026 to 2036
Table 12: North America Petrochemicals Market Value (USD Billion) Forecast, by Feedstock, 2026 to 2036
Table 13: North America Petrochemicals Market Volume (Tons) Forecast, by End-use, 2026 to 2036
Table 14: North America Petrochemicals Market Value (USD Billion) Forecast, by End-use, 2026 to 2036
Table 15: North America Petrochemicals Market Volume (Tons) Forecast, by Country, 2026 to 2036
Table 16: North America Petrochemicals Market Value (USD Billion) Forecast, by Country, 2026 to 2036
Table 17: U.S. Petrochemicals Market Volume (Tons) Forecast, by Product Type, 2026 to 2036
Table 18: U.S. Petrochemicals Market Value (USD Billion) Forecast, by Product Type, 2026 to 2036
Table 19: U.S. Petrochemicals Market Volume (Tons) Forecast, by Feedstock, 2026 to 2036
Table 20: U.S. Petrochemicals Market Value (USD Billion) Forecast, by Feedstock, 2026 to 2036
Table 21: U.S. Petrochemicals Market Volume (Tons) Forecast, by End-use, 2026 to 2036
Table 22: U.S. Petrochemicals Market Value (USD Billion) Forecast, by End-use, 2026 to 2036
Table 23: Canada Petrochemicals Market Volume (Tons) Forecast, by Product Type, 2026 to 2036
Table 24: Canada Petrochemicals Market Value (USD Billion) Forecast, by Product Type, 2026 to 2036
Table 25: Canada Petrochemicals Market Volume (Tons) Forecast, by Feedstock, 2026 to 2036
Table 26: Canada Petrochemicals Market Value (USD Billion) Forecast, by Feedstock, 2026 to 2036
Table 27: Canada Petrochemicals Market Volume (Tons) Forecast, by End-use, 2026 to 2036
Table 28: Canada Petrochemicals Market Value (USD Billion) Forecast, by End-use, 2026 to 2036
Table 29: Europe Petrochemicals Market Volume (Tons) Forecast, by Product Type, 2026 to 2036
Table 30: Europe Petrochemicals Market Value (USD Billion) Forecast, by Product Type, 2026 to 2036
Table 31: Europe Petrochemicals Market Volume (Tons) Forecast, by Feedstock, 2026 to 2036
Table 32: Europe Petrochemicals Market Value (USD Billion) Forecast, by Feedstock, 2026 to 2036
Table 33: Europe Petrochemicals Market Volume (Tons) Forecast, by End-use, 2026 to 2036
Table 34: Europe Petrochemicals Market Value (USD Billion) Forecast, by End-use, 2026 to 2036
Table 35: Europe Petrochemicals Market Volume (Tons) Forecast, by Country and Sub-region, 2026 to 2036
Table 36: Europe Petrochemicals Market Value (USD Billion) Forecast, by Country and Sub-region, 2026 to 2036
Table 37: Germany Petrochemicals Market Volume (Tons) Forecast, by Product Type, 2026 to 2036
Table 38: Germany Petrochemicals Market Value (USD Billion) Forecast, by Product Type, 2026 to 2036
Table 39: Germany Petrochemicals Market Volume (Tons) Forecast, by Feedstock, 2026 to 2036
Table 40: Germany Petrochemicals Market Value (USD Billion) Forecast, by Feedstock, 2026 to 2036
Table 41: Germany Petrochemicals Market Volume (Tons) Forecast, by End-use, 2026 to 2036
Table 42: Germany Petrochemicals Market Value (USD Billion) Forecast, by End-use, 2026 to 2036
Table 43: France Petrochemicals Market Volume (Tons) Forecast, by Product Type, 2026 to 2036
Table 44: France Petrochemicals Market Value (USD Billion) Forecast, by Product Type, 2026 to 2036
Table 45: France Petrochemicals Market Volume (Tons) Forecast, by Feedstock, 2026 to 2036
Table 46: France Petrochemicals Market Value (USD Billion) Forecast, by Feedstock, 2026 to 2036
Table 47: France Petrochemicals Market Volume (Tons) Forecast, by End-use, 2026 to 2036
Table 48: France Petrochemicals Market Value (USD Billion) Forecast, by End-use, 2026 to 2036
Table 49: U.K. Petrochemicals Market Volume (Tons) Forecast, by Product Type, 2026 to 2036
Table 50: U.K. Petrochemicals Market Value (USD Billion) Forecast, by Product Type, 2026 to 2036
Table 51: U.K. Petrochemicals Market Volume (Tons) Forecast, by Feedstock, 2026 to 2036
Table 52: U.K. Petrochemicals Market Value (USD Billion) Forecast, by Feedstock, 2026 to 2036
Table 53: U.K. Petrochemicals Market Volume (Tons) Forecast, by End-use, 2026 to 2036
Table 54: U.K. Petrochemicals Market Value (USD Billion) Forecast, by End-use, 2026 to 2036
Table 55: Italy Petrochemicals Market Volume (Tons) Forecast, by Product Type, 2026 to 2036
Table 56: Italy Petrochemicals Market Value (USD Billion) Forecast, by Product Type, 2026 to 2036
Table 57: Italy Petrochemicals Market Volume (Tons) Forecast, by Feedstock, 2026 to 2036
Table 58: Italy Petrochemicals Market Value (USD Billion) Forecast, by Feedstock, 2026 to 2036
Table 59: Italy Petrochemicals Market Volume (Tons) Forecast, by End-use, 2026 to 2036
Table 60: Italy Petrochemicals Market Value (USD Billion) Forecast, by End-use, 2026 to 2036
Table 61: Spain Petrochemicals Market Volume (Tons) Forecast, by Product Type, 2026 to 2036
Table 62: Spain Petrochemicals Market Value (USD Billion) Forecast, by Product Type, 2026 to 2036
Table 63: Spain Petrochemicals Market Volume (Tons) Forecast, by Feedstock, 2026 to 2036
Table 64: Spain Petrochemicals Market Value (USD Billion) Forecast, by Feedstock, 2026 to 2036
Table 65: Spain Petrochemicals Market Volume (Tons) Forecast, by End-use, 2026 to 2036
Table 66: Spain Petrochemicals Market Value (USD Billion) Forecast, by End-use, 2026 to 2036
Table 67: Russia & CIS Petrochemicals Market Volume (Tons) Forecast, by Product Type, 2026 to 2036
Table 68: Russia & CIS Petrochemicals Market Value (USD Billion) Forecast, by Product Type, 2026 to 2036
Table 69: Russia & CIS Petrochemicals Market Volume (Tons) Forecast, by Feedstock, 2026 to 2036
Table 70: Russia & CIS Petrochemicals Market Value (USD Billion) Forecast, by Feedstock, 2026 to 2036
Table 71: Russia & CIS Petrochemicals Market Volume (Tons) Forecast, by End-use, 2026 to 2036
Table 72: Russia & CIS Petrochemicals Market Value (USD Billion) Forecast, by End-use, 2026 to 2036
Table 73: Rest of Europe Petrochemicals Market Volume (Tons) Forecast, by Product Type, 2026 to 2036
Table 74: Rest of Europe Petrochemicals Market Value (USD Billion) Forecast, by Product Type, 2026 to 2036
Table 75: Rest of Europe Petrochemicals Market Volume (Tons) Forecast, by Feedstock, 2026 to 2036
Table 76: Rest of Europe Petrochemicals Market Value (USD Billion) Forecast, by Feedstock, 2026 to 2036
Table 77: Rest of Europe Petrochemicals Market Volume (Tons) Forecast, by End-use, 2026 to 2036
Table 78: Rest of Europe Petrochemicals Market Value (USD Billion) Forecast, by End-use, 2026 to 2036
Table 79: Asia Pacific Petrochemicals Market Volume (Tons) Forecast, by Product Type, 2026 to 2036
Table 80: Asia Pacific Petrochemicals Market Value (USD Billion) Forecast, by Product Type, 2026 to 2036
Table 81: Asia Pacific Petrochemicals Market Volume (Tons) Forecast, by Feedstock, 2026 to 2036
Table 82: Asia Pacific Petrochemicals Market Value (USD Billion) Forecast, by Feedstock, 2026 to 2036
Table 83: Asia Pacific Petrochemicals Market Volume (Tons) Forecast, by End-use, 2026 to 2036
Table 84: Asia Pacific Petrochemicals Market Value (USD Billion) Forecast, by End-use, 2026 to 2036
Table 85: Asia Pacific Petrochemicals Market Volume (Tons) Forecast, by Country and Sub-region, 2026 to 2036
Table 86: Asia Pacific Petrochemicals Market Value (USD Billion) Forecast, by Country and Sub-region, 2026 to 2036
Table 87: China Petrochemicals Market Volume (Tons) Forecast, by Product Type, 2026 to 2036
Table 88: China Petrochemicals Market Value (USD Billion) Forecast, by Product Type 2026 to 2036
Table 89: China Petrochemicals Market Volume (Tons) Forecast, by Feedstock, 2026 to 2036
Table 90: China Petrochemicals Market Value (USD Billion) Forecast, by Feedstock, 2026 to 2036
Table 91: China Petrochemicals Market Volume (Tons) Forecast, by End-use, 2026 to 2036
Table 92: China Petrochemicals Market Value (USD Billion) Forecast, by End-use, 2026 to 2036
Table 93: Japan Petrochemicals Market Volume (Tons) Forecast, by Product Type, 2026 to 2036
Table 94: Japan Petrochemicals Market Value (USD Billion) Forecast, by Product Type, 2026 to 2036
Table 95: Japan Petrochemicals Market Volume (Tons) Forecast, by Feedstock, 2026 to 2036
Table 96: Japan Petrochemicals Market Value (USD Billion) Forecast, by Feedstock, 2026 to 2036
Table 97: Japan Petrochemicals Market Volume (Tons) Forecast, by End-use, 2026 to 2036
Table 98: Japan Petrochemicals Market Value (USD Billion) Forecast, by End-use, 2026 to 2036
Table 99: India Petrochemicals Market Volume (Tons) Forecast, by Product Type, 2026 to 2036
Table 100: India Petrochemicals Market Value (USD Billion) Forecast, by Product Type, 2026 to 2036
Table 101: India Petrochemicals Market Volume (Tons) Forecast, by Feedstock, 2026 to 2036
Table 102: India Petrochemicals Market Value (USD Billion) Forecast, by Feedstock, 2026 to 2036
Table 103: India Petrochemicals Market Volume (Tons) Forecast, by End-use, 2026 to 2036
Table 104: India Petrochemicals Market Value (USD Billion) Forecast, by End-use, 2026 to 2036
Table 105: India Petrochemicals Market Volume (Tons) Forecast, by End-use, 2026 to 2036
Table 106: India Petrochemicals Market Value (USD Billion) Forecast, by End-use 2026 to 2036
Table 107: ASEAN Petrochemicals Market Volume (Tons) Forecast, by Product Type, 2026 to 2036
Table 108: ASEAN Petrochemicals Market Value (USD Billion) Forecast, by Product Type, 2026 to 2036
Table 109: ASEAN Petrochemicals Market Volume (Tons) Forecast, by Feedstock, 2026 to 2036
Table 110: ASEAN Petrochemicals Market Value (USD Billion) Forecast, by Feedstock, 2026 to 2036
Table 111: ASEAN Petrochemicals Market Volume (Tons) Forecast, by End-use, 2026 to 2036
Table 112: ASEAN Petrochemicals Market Value (USD Billion) Forecast, by End-use, 2026 to 2036
Table 113: Rest of Asia Pacific Petrochemicals Market Volume (Tons) Forecast, by Product Type, 2026 to 2036
Table 114: Rest of Asia Pacific Petrochemicals Market Value (USD Billion) Forecast, by Product Type, 2026 to 2036
Table 115: Rest of Asia Pacific Petrochemicals Market Volume (Tons) Forecast, by Feedstock, 2026 to 2036
Table 116: Rest of Asia Pacific Petrochemicals Market Value (USD Billion) Forecast, by Feedstock, 2026 to 2036
Table 117: Rest of Asia Pacific Petrochemicals Market Volume (Tons) Forecast, by End-use, 2026 to 2036
Table 118: Rest of Asia Pacific Petrochemicals Market Value (USD Billion) Forecast, by End-use, 2026 to 2036
Table 119: Latin America Petrochemicals Market Volume (Tons) Forecast, by Product Type, 2026 to 2036
Table 120: Latin America Petrochemicals Market Value (USD Billion) Forecast, by Product Type, 2026 to 2036
Table 121: Latin America Petrochemicals Market Volume (Tons) Forecast, by Feedstock, 2026 to 2036
Table 122: Latin America Petrochemicals Market Value (USD Billion) Forecast, by Feedstock, 2026 to 2036
Table 123: Latin America Petrochemicals Market Volume (Tons) Forecast, by End-use, 2026 to 2036
Table 124: Latin America Petrochemicals Market Value (USD Billion) Forecast, by End-use, 2026 to 2036
Table 125: Latin America Petrochemicals Market Volume (Tons) Forecast, by Country and Sub-region, 2026 to 2036
Table 126: Latin America Petrochemicals Market Value (USD Billion) Forecast, by Country and Sub-region, 2026 to 2036
Table 127: Brazil Petrochemicals Market Volume (Tons) Forecast, by Product Type, 2026 to 2036
Table 128: Brazil Petrochemicals Market Value (USD Billion) Forecast, by Product Type, 2026 to 2036
Table 129: Brazil Petrochemicals Market Volume (Tons) Forecast, by Feedstock, 2026 to 2036
Table 130: Brazil Petrochemicals Market Value (USD Billion) Forecast, by Feedstock, 2026 to 2036
Table 131: Brazil Petrochemicals Market Volume (Tons) Forecast, by End-use, 2026 to 2036
Table 132: Brazil Petrochemicals Market Value (USD Billion) Forecast, by End-use, 2026 to 2036
Table 133: Mexico Petrochemicals Market Volume (Tons) Forecast, by Product Type, 2026 to 2036
Table 134: Mexico Petrochemicals Market Value (USD Billion) Forecast, by Product Type, 2026 to 2036
Table 135: Mexico Petrochemicals Market Volume (Tons) Forecast, by Feedstock, 2026 to 2036
Table 136: Mexico Petrochemicals Market Value (USD Billion) Forecast, by Feedstock, 2026 to 2036
Table 137: Mexico Petrochemicals Market Volume (Tons) Forecast, by End-use, 2026 to 2036
Table 138: Mexico Petrochemicals Market Value (USD Billion) Forecast, by End-use, 2026 to 2036
Table 139: Rest of Latin America Petrochemicals Market Volume (Tons) Forecast, by Product Type, 2026 to 2036
Table 140: Rest of Latin America Petrochemicals Market Value (USD Billion) Forecast, by Product Type, 2026 to 2036
Table 141: Rest of Latin America Petrochemicals Market Volume (Tons) Forecast, by Feedstock, 2026 to 2036
Table 142: Rest of Latin America Petrochemicals Market Value (USD Billion) Forecast, by Feedstock, 2026 to 2036
Table 143: Rest of Latin America Petrochemicals Market Volume (Tons) Forecast, by End-use, 2026 to 2036
Table 144: Rest of Latin America Petrochemicals Market Value (USD Billion) Forecast, by End-use, 2026 to 2036
Table 145: Middle East & Africa Petrochemicals Market Volume (Tons) Forecast, by Product Type, 2026 to 2036
Table 146: Middle East & Africa Petrochemicals Market Value (USD Billion) Forecast, by Product Type, 2026 to 2036
Table 147: Middle East & Africa Petrochemicals Market Volume (Tons) Forecast, by Feedstock, 2026 to 2036
Table 148: Middle East & Africa Petrochemicals Market Value (USD Billion) Forecast, by Feedstock, 2026 to 2036
Table 149: Middle East & Africa Petrochemicals Market Volume (Tons) Forecast, by End-use, 2026 to 2036
Table 150: Middle East & Africa Petrochemicals Market Value (USD Billion) Forecast, by End-use, 2026 to 2036
Table 151: Middle East & Africa Petrochemicals Market Volume (Tons) Forecast, by Country and Sub-region, 2026 to 2036
Table 152: Middle East & Africa Petrochemicals Market Value (USD Billion) Forecast, by Country and Sub-region, 2026 to 2036
Table 153: GCC Petrochemicals Market Volume (Tons) Forecast, by Product Type, 2026 to 2036
Table 154: GCC Petrochemicals Market Value (USD Billion) Forecast, by Product Type, 2026 to 2036
Table 155: GCC Petrochemicals Market Volume (Tons) Forecast, by Feedstock, 2026 to 2036
Table 156: GCC Petrochemicals Market Value (USD Billion) Forecast, by Feedstock, 2026 to 2036
Table 157: GCC Petrochemicals Market Volume (Tons) Forecast, by End-use, 2026 to 2036
Table 158: GCC Petrochemicals Market Value (USD Billion) Forecast, by End-use, 2026 to 2036
Table 159: South Africa Petrochemicals Market Volume (Tons) Forecast, by Product Type, 2026 to 2036
Table 160: South Africa Petrochemicals Market Value (USD Billion) Forecast, by Product Type, 2026 to 2036
Table 161: South Africa Petrochemicals Market Volume (Tons) Forecast, by Feedstock, 2026 to 2036
Table 162: South Africa Petrochemicals Market Value (USD Billion) Forecast, by Feedstock, 2026 to 2036
Table 163: South Africa Petrochemicals Market Volume (Tons) Forecast, by End-use, 2026 to 2036
Table 164: South Africa Petrochemicals Market Value (USD Billion) Forecast, by End-use, 2026 to 2036
Table 165: Rest of Middle East & Africa Petrochemicals Market Volume (Tons) Forecast, by Product Type, 2026 to 2036
Table 166: Rest of Middle East & Africa Petrochemicals Market Value (USD Billion) Forecast, by Product Type, 2026 to 2036
Table 167: Rest of Middle East & Africa Petrochemicals Market Volume (Tons) Forecast, by Feedstock, 2026 to 2036
Table 168: Rest of Middle East & Africa Petrochemicals Market Value (USD Billion) Forecast, by Feedstock, 2026 to 2036
Table 169: Rest of Middle East & Africa Petrochemicals Market Volume (Tons) Forecast, by End-use, 2026 to 2036
Table 170: Rest of Middle East & Africa Petrochemicals Market Value (USD Billion) Forecast, by End-use, 2026 to 2036
Figure 1: Global Petrochemicals Market Volume Share Analysis, by Product Type, 2025, 2029, and 2036
Figure 2: Global Petrochemicals Market Attractiveness, by Product Type
Figure 3: Global Petrochemicals Market Volume Share Analysis, by Feedstock, 2025, 2029, and 2036
Figure 4: Global Petrochemicals Market Attractiveness, by Feedstock
Figure 5: Global Petrochemicals Market Volume Share Analysis, by End-use, 2025, 2029, and 2036
Figure 6: Global Petrochemicals Market Attractiveness, by End-use
Figure 7: Global Petrochemicals Market Volume Share Analysis, by Region, 2025, 2029, and 2036
Figure 8: Global Petrochemicals Market Attractiveness, by Region
Figure 9: North America Petrochemicals Market Volume Share Analysis, by Product Type, 2025, 2029, and 2036
Figure 10: North America Petrochemicals Market Attractiveness, by Product Type
Figure 11: North America Petrochemicals Market Attractiveness, by Product Type
Figure 12: North America Petrochemicals Market Volume Share Analysis, by Feedstock, 2025, 2029, and 2036
Figure 13: North America Petrochemicals Market Attractiveness, by Feedstock
Figure 14: North America Petrochemicals Market Volume Share Analysis, by End-use, 2025, 2029, and 2036
Figure 15: North America Petrochemicals Market Attractiveness, by End-use
Figure 16: North America Petrochemicals Market Attractiveness, by Country and Sub-region
Figure 17: Europe Petrochemicals Market Volume Share Analysis, by Product Type, 2025, 2029, and 2036
Figure 18: Europe Petrochemicals Market Attractiveness, by Product Type
Figure 19: Europe Petrochemicals Market Volume Share Analysis, by Feedstock, 2025, 2029, and 2036
Figure 20: Europe Petrochemicals Market Attractiveness, by Feedstock
Figure 21: Europe Petrochemicals Market Volume Share Analysis, by End-use, 2025, 2029, and 2036
Figure 22: Europe Petrochemicals Market Attractiveness, by End-use
Figure 23: Europe Petrochemicals Market Volume Share Analysis, by Country and Sub-region, 2025, 2029, and 2036
Figure 24: Europe Petrochemicals Market Attractiveness, by Country and Sub-region
Figure 25: Asia Pacific Petrochemicals Market Volume Share Analysis, by Product Type, 2025, 2029, and 2036
Figure 26: Asia Pacific Petrochemicals Market Attractiveness, by Product Type
Figure 27: Asia Pacific Petrochemicals Market Volume Share Analysis, by Feedstock, 2025, 2029, and 2036
Figure 28: Asia Pacific Petrochemicals Market Attractiveness, by Feedstock
Figure 29: Asia Pacific Petrochemicals Market Volume Share Analysis, by End-use, 2025, 2029, and 2036
Figure 30: Asia Pacific Petrochemicals Market Attractiveness, by End-use
Figure 31: Asia Pacific Petrochemicals Market Volume Share Analysis, by Country and Sub-region, 2025, 2029, and 2036
Figure 32: Asia Pacific Petrochemicals Market Attractiveness, by Country and Sub-region
Figure 33: Latin America Petrochemicals Market Volume Share Analysis, by Product Type, 2025, 2029, and 2036
Figure 34: Latin America Petrochemicals Market Attractiveness, by Product Type
Figure 35: Latin America Petrochemicals Market Volume Share Analysis, by Feedstock, 2025, 2029, and 2036
Figure 36: Latin America Petrochemicals Market Attractiveness, by Feedstock
Figure 37: Latin America Petrochemicals Market Volume Share Analysis, by End-use, 2025, 2029, and 2036
Figure 38: Latin America Petrochemicals Market Attractiveness, by End-use
Figure 39: Latin America Petrochemicals Market Volume Share Analysis, by Country and Sub-region, 2025, 2029, and 2036
Figure 40: Latin America Petrochemicals Market Attractiveness, by Country and Sub-region
Figure 41: Middle East & Africa Petrochemicals Market Volume Share Analysis, by Product Type, 2025, 2029, and 2036
Figure 42: Middle East & Africa Petrochemicals Market Attractiveness, by Product Type
Figure 43: Middle East & Africa Petrochemicals Market Volume Share Analysis, by Feedstock, 2025, 2029, and 2036
Figure 44: Middle East & Africa Petrochemicals Market Attractiveness, by Feedstock
Figure 45: Middle East & Africa Petrochemicals Market Volume Share Analysis, by End-use, 2025, 2029, and 2036
Figure 46: Middle East & Africa Petrochemicals Market Attractiveness, by End-use
Figure 47: Middle East & Africa Petrochemicals Market Volume Share Analysis, by Country and Sub-region, 2025, 2029, and 2036
Figure 48: Middle East & Africa Petrochemicals Market Attractiveness, by Country and Sub-region
Copyright © Transparency Market Research, Inc. All Rights reserved
Trust Online


Petrochemicals Market
