
Reports
Reports
Analysts’ Viewpoint
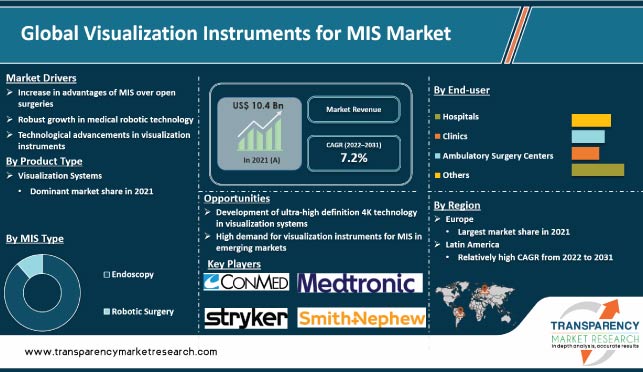
Advancements in visualization instruments are enabling surgeons to reach crucial organs, provide greater visualization, and create ergonomic working conditions. Development of ultra-high definition 4K technology in visualization systems in the past few years has enabled surgeons to view clear and crisp images of organs. Usage of robotics is expected to enable some procedures to be performed with precision and limited human intervention. These factors are expected to fuel market expansion in the next few years.
Post the peak of the COVID-19 pandemic, companies in the business are taking data-driven decisions before investing in new device technologies. They are investing significantly in research & development of improved visualization instruments for minimally invasive surgery (MIS).
Visualization instruments are systems used in operation theaters during surgical procedures. These instruments assist surgeons to carry out examination efficiently. This results in better patient outcomes. Surgical visualization systems reduce reflections and increase the usable contrast ratio. This helps in visualization of the body during surgeries.
Increase in advantages of MIS over open surgeries, rise in demand for minimally invasive surgeries, robust growth in medical robotic technology, and technological advancements in visualization instruments are the major market catalysts.
Less wound pain, faster functional recovery, and shorter hospital stay are the key advantages of minimally invasive surgery over open surgery. Surgery is the only known treatment option for gastric cancer. The benefits of MIS have encouraged octogenarians and older patients who face high operative morbidity and mortality to undergo surgery rather than strictly conservative treatment.
Adoption of MIS leads to significantly less blood loss, lower analgesic consumption, and shorter postoperative hospital stay compared to open surgery. It also facilitates faster time to first flatus & soft die. Hence, MIS for gastric cancer can be performed safely in octogenarians and older patients.
Rapid growth of medical robotic systems can be ascribed to a blend of technological improvements such as usage of more efficient motors, compact & light materials, power back-up, and sophisticated controls and safety mechanisms, along with more economic versions.
Technological advancements in visualization systems are fueling the industry. For instance, in March 2019, Stryker launched transformative visualization equipment designed to enhance the surgical experience for arthroscopy.
COVID-19 had a negative effect on the industry in 2020. The unprecedented pandemic has largely affected North America and Europe. The arthroscopic visualization instrument industry growth is concentrated in these regions. Demand for instruments and consumables & accessories decreased in 2020. The pandemic had a significant effect on sales of several manufacturers in 2020, as hospitals and surgery centers deferred non-urgent surgeries.
According to a study published in December 2020 in PubMed on the impact of COVID-19 on gastrointestinal endoscopy, more than 98.7% of the gastroenterologists in France had to cancel endoscopic procedures in March 2020. However, the number of orthopedic surgeries increased in 2021 compared to that in 2020, as procedure volumes gradually returned to normal levels. Thus, recovery in sales of visualization instruments for MIS is likely to overcome COVID-19 related market limitation to a certain extent in the near future.
In terms of product type, the visualization systems segment held the largest global visualization instruments for MIS market share in 2021. The trend is expected to continue during the forecast period due to technological advancements in MIS visualization systems to enhance imaging capabilities and increase in launch of visualization systems. The consumables & accessories segment is likely to grow at a rapid pace during the forecast period owing to repetitive purchase and rise in adoption of consumables and accessories of visualization systems.
Based on MIS type, the endoscopy segment held major share of the visualization instruments for MIS business in 2021. This can be ascribed to the rise in number of endoscopy procedures and increase in adoption of visualization instruments and MIS instruments in endoscopy procedures. According to Becker's Healthcare, 75 million endoscopies are performed in the U.S. every year; 51.5 million (68%) of these are gastrointestinal endoscopies.
In terms of end-user, the hospitals segment held the largest visualization instruments for MIS industry share in 2021. This can be ascribed to the increase in number of hospitals and rise in number of MIS procedures performed in these settings. According to the American Hospital Association (AHA), the number of hospitals in the U.S. rose from 5,564 in 2017 to 6,093 in 2022. Growth in the number of hospitals in the region has led to a surge in number of MIS procedures performed.
According to the visualization instruments for MIS market trends, Europe accounted for significant share in 2021. This can be ascribed to the rise in prevalence of lifestyle-related and chronic disorders, technological advancements in MIS visualization instruments, increase in healthcare expenditure, and higher acceptance rate of minimally invasive surgeries over traditional surgeries in the region. According to European Commission statistics, the government expenditure on healthcare in the EU stood at US$ 1,220.4 Bn, which constituted about 7.0% of the GDP in 2021.
Latin America is expected to record significant market progress during the forecast period. This can be ascribed to the increase in geriatric population, developing healthcare infrastructure, and rise in awareness about MIS surgeries in the region.
The report concludes with the company profiles section that includes key information about the major players. Companies are focusing on strategies such as new product launches, mergers, and partnerships & collaborations to compete in the marketplace. Arthrex GmbH, B. Braun Melsungen AG, CONMED Corporation, Medtronic plc, Millennium Surgical Corp, Richard Wolf GmbH, Lazurite Holdings LLC, Olympus Corporation, Smith & Nephew plc, and Stryker Corporation are the prominent market entities.
Leading players have been profiled in the visualization instruments for MIS market report based on parameters such as company overview, financial overview, strategies, portfolio, segments, and recent developments.
|
Attribute |
Detail |
|
Size Value in 2021 |
US$ 10.4 Bn |
|
Forecast Value in 2031 |
More than US$ 21.0 Bn |
|
Compound Annual Growth Rate (CAGR) |
7.2% |
|
Forecast Period |
2022–2031 |
|
Historical Data Available for |
2017–2021 |
|
Quantitative Units |
US$ Bn for Value |
|
Market Analysis |
It includes segment analysis as well as regional level analysis. Moreover, qualitative analysis includes drivers, restraints, opportunities, key trends, and parent industry overview. |
|
Competition Landscape |
|
|
Format |
Electronic (PDF) + Excel |
|
Segmentation |
|
|
Regions Covered |
|
|
Countries Covered |
|
|
Companies Profiled |
|
|
Customization Scope |
Available upon request |
|
Pricing |
Available upon request |
The industry was valued at US$ 10.4 Bn in 2021
It is projected to reach more than US$ 21.0 Bn by 2031
The market size is anticipated to grow at a CAGR of 7.2% from 2022 to 2031
Increase in advantages of MIS over open surgeries, rise in demand for minimally invasive surgeries, robust growth in medical robotic technology, and technological advancements
The visualization systems segment accounted for more than 70% share in 2021
Europe is expected to account for the largest share by 2031
Arthrex GmbH, B. Braun Melsungen AG, CONMED Corporation, Medtronic plc, Millennium Surgical Corp, Olympus Corporation, Richard Wolf GmbH, Lazurite Holdings LLC, Smith & Nephew plc, and Stryker Corporation
1. Preface
1.1. Market Definition and Scope
1.2. Market Segmentation
1.3. Key Research Objectives
1.4. Research Highlights
2. Assumptions and Research Methodology
3. Executive Summary: Global Visualization Instruments for MIS Market
4. Market Overview
4.1. Overview
4.2. Market Dynamics
4.2.1. Drivers
4.2.2. Restraints
4.2.3. Opportunities
4.3. Global Visualization Instruments for MIS Market Value Analysis and Forecast, 2017–2031
5. Key Insights
5.1. Technological Advancements
5.2. Key Industry Events
5.3. COVID-19 Pandemic Impact on Industry (value chain and short/mid/long term impact)
6. Global Visualization Instruments for MIS Market Analysis and Forecast, by Product Type
6.1. Introduction & Definition
6.2. Key Findings/Developments
6.3. Market Value Forecast, by Product Type, 2017–2031
6.3.1. Visualization Systems
6.3.1.1. 2D Systems
6.3.1.2. 3D Systems
6.3.2. Consumables & Accessories
6.4. Market Attractiveness Analysis, by Product Type
7. Global Visualization Instruments for MIS Market Analysis and Forecast, by MIS Type
7.1. Introduction & Definition
7.2. Key Findings/Developments
7.3. Market Value Forecast, by MIS Type, 2017–2031
7.3.1. Endoscopy
7.3.1.1. Arthroscopy
7.3.1.2. Laparoscopy
7.3.1.3. Obstetrics & Gynecology Endoscopy
7.3.1.4. Urologic Endoscopy
7.3.1.5. Bronchoscopy
7.3.1.6. Gastroscopy
7.3.1.7. Others
7.3.2. Robotic Surgery
7.4. Market Attractiveness Analysis, by MIS Type
8. Global Visualization Instruments for MIS Market Analysis and Forecast, by End-user
8.1. Introduction & Definition
8.2. Key Findings/Developments
8.3. Market Value Forecast, by End-user, 2017–2031
8.3.1. Hospitals
8.3.2. Clinics
8.3.3. Ambulatory Surgery Centers
8.3.4. Others
8.4. Market Attractiveness Analysis, by End-user
9. Global Visualization Instruments for MIS Market Analysis and Forecast, by Region
9.1. Key Findings
9.2. Market Value Forecast, by Region, 2017–2031
9.2.1. North America
9.2.2. Europe
9.2.3. Asia Pacific
9.2.4. Latin America
9.2.5. Middle East & Africa
9.3. Market Attractiveness Analysis, by Region
10. North America Visualization Instruments for MIS Market Analysis and Forecast
10.1. Introduction
10.1.1. Key Findings
10.2. Market Value Forecast, by Product Type, 2017–2031
10.2.1. Visualization Systems
10.2.1.1. 2D Systems
10.2.1.2. 3D Systems
10.2.2. Consumables & Accessories
10.3. Market Value Forecast, by MIS Type, 2017–2031
10.3.1. Endoscopy
10.3.1.1. Arthroscopy
10.3.1.2. Laparoscopy
10.3.1.3. Obstetrics & Gynecology Endoscopy
10.3.1.4. Urologic Endoscopy
10.3.1.5. Bronchoscopy
10.3.1.6. Gastroscopy
10.3.1.7. Others
10.3.2. Robotic Surgery
10.4. Market Value Forecast, by End-user, 2017–2031
10.4.1. Hospitals
10.4.2. Clinics
10.4.3. Ambulatory Surgery Centers
10.4.4. Others
10.5. Market Value Forecast, by Country, 2017–2031
10.5.1. U.S.
10.5.2. Canada
10.6. Market Attractiveness Analysis
10.6.1. By Product Type
10.6.2. By MIS Type
10.6.3. By End-user
10.6.4. By Country
11. Europe Visualization Instruments for MIS Market Analysis and Forecast
11.1. Introduction
11.1.1. Key Findings
11.2. Market Value Forecast, by Product Type, 2017–2031
11.2.1. Visualization Systems
11.2.1.1. 2D Systems
11.2.1.2. 3D Systems
11.2.2. Consumables & Accessories
11.3. Market Value Forecast, by MIS Type, 2017–2031
11.3.1. Endoscopy
11.3.1.1. Arthroscopy
11.3.1.2. Laparoscopy
11.3.1.3. Obstetrics & Gynecology Endoscopy
11.3.1.4. Urologic Endoscopy
11.3.1.5. Bronchoscopy
11.3.1.6. Gastroscopy
11.3.1.7. Others
11.3.2. Robotic Surgery
11.4. Market Value Forecast, by End-user, 2017–2031
11.4.1. Hospitals
11.4.2. Clinics
11.4.3. Ambulatory Surgery Centers
11.4.4. Others
11.5. Market Value Forecast, by Country/Sub-region, 2017–2031
11.5.1. Germany
11.5.2. U.K.
11.5.3. France
11.5.4. Italy
11.5.5. Spain
11.5.6. Rest of Europe
11.6. Market Attractiveness Analysis
11.6.1. By Product Type
11.6.2. By MIS Type
11.6.3. By End-user
11.6.4. By Country/Sub-region
12. Asia Pacific Visualization Instruments for MIS Market Analysis and Forecast
12.1. Introduction
12.1.1. Key Findings
12.2. Market Value Forecast, by Product Type, 2017–2031
12.2.1. Visualization Systems
12.2.1.1. 2D Systems
12.2.1.2. 3D Systems
12.2.2. Consumables & Accessories
12.3. Market Value Forecast, by MIS Type, 2017–2031
12.3.1. Endoscopy
12.3.1.1. Arthroscopy
12.3.1.2. Laparoscopy
12.3.1.3. Obstetrics & Gynecology Endoscopy
12.3.1.4. Urologic Endoscopy
12.3.1.5. Bronchoscopy
12.3.1.6. Gastroscopy
12.3.1.7. Others
12.3.2. Robotic Surgery
12.4. Market Value Forecast, by End-user, 2017–2031
12.4.1. Hospitals
12.4.2. Clinics
12.4.3. Ambulatory Surgery Centers
12.4.4. Others
12.5. Market Value Forecast, by Country/Sub-region, 2017–2031
12.5.1. China
12.5.2. Japan
12.5.3. India
12.5.4. Australia & New Zealand
12.5.5. Rest of Asia Pacific
12.6. Market Attractiveness Analysis
12.6.1. By Product Type
12.6.2. By MIS Type
12.6.3. By End-user
12.6.4. By Country/Sub-region
13. Latin America Visualization Instruments for MIS Market Analysis and Forecast
13.1. Introduction
13.1.1. Key Findings
13.2. Market Value Forecast, by Product Type, 2017–2031
13.2.1. Visualization Systems
13.2.1.1. 2D Systems
13.2.1.2. 3D Systems
13.2.2. Consumables & Accessories
13.3. Market Value Forecast, by MIS Type, 2017–2031
13.3.1. Endoscopy
13.3.1.1. Arthroscopy
13.3.1.2. Laparoscopy
13.3.1.3. Obstetrics & Gynecology Endoscopy
13.3.1.4. Urologic Endoscopy
13.3.1.5. Bronchoscopy
13.3.1.6. Gastroscopy
13.3.1.7. Others
13.3.2. Robotic Surgery
13.4. Market Value Forecast, by End-user, 2017–2031
13.4.1. Hospitals
13.4.2. Clinics
13.4.3. Ambulatory Surgery Centers
13.4.4. Others
13.5. Market Value Forecast, by Country/Sub-region, 2017–2031
13.5.1. Brazil
13.5.2. Mexico
13.5.3. Rest of Latin America
13.6. Market Attractiveness Analysis
13.6.1. By Product Type
13.6.2. By MIS Type
13.6.3. By End-user
13.6.4. By Country/Sub-region
14. Middle East & Africa Visualization Instruments for MIS Market Analysis and Forecast
14.1. Introduction
14.1.1. Key Findings
14.2. Market Value Forecast, by Product Type, 2017–2031
14.2.1. Visualization Systems
14.2.1.1. 2D Systems
14.2.1.2. 3D Systems
14.2.2. Consumables & Accessories
14.3. Market Value Forecast, by MIS Type, 2017–2031
14.3.1. Endoscopy
14.3.1.1. Arthroscopy
14.3.1.2. Laparoscopy
14.3.1.3. Obstetrics & Gynecology Endoscopy
14.3.1.4. Urologic Endoscopy
14.3.1.5. Bronchoscopy
14.3.1.6. Gastroscopy
14.3.1.7. Others
14.3.2. Robotic Surgery
14.4. Market Value Forecast, by End-user, 2017–2031
14.4.1. Hospitals
14.4.2. Clinics
14.4.3. Ambulatory Surgery Centers
14.4.4. Others
14.5. Market Value Forecast, by Country/Sub-region, 2017–2031
14.5.1. GCC Countries
14.5.2. South Africa
14.5.3. Rest of Middle East & Africa
14.6. Market Attractiveness Analysis
14.6.1. By Product Type
14.6.2. By MIS Type
14.6.3. By End-user
14.6.4. By Country/Sub-region
15. Competition Landscape
15.1. Market Player - Competition Matrix (by tier and size of companies)
15.2. Market Share Analysis, by Company, 2021
15.3. Company Profiles
15.3.1. Arthrex GmbH
15.3.1.1. Company Overview (HQ, Business Segments, Employee Strength)
15.3.1.2. Product Portfolio
15.3.1.3. Financial Overview
15.3.1.4. SWOT Analysis
15.3.1.5. Strategic Overview
15.3.2. B. Braun Melsungen AG
15.3.2.1. Company Overview (HQ, Business Segments, Employee Strength)
15.3.2.2. Product Portfolio
15.3.2.3. Financial Overview
15.3.2.4. SWOT Analysis
15.3.2.5. Strategic Overview
15.3.3. CONMED Corporation
15.3.3.1. Company Overview (HQ, Business Segments, Employee Strength)
15.3.3.2. Product Portfolio
15.3.3.3. Financial Overview
15.3.3.4. SWOT Analysis
15.3.3.5. Strategic Overview
15.3.4. Medtronic plc
15.3.4.1. Company Overview (HQ, Business Segments, Employee Strength)
15.3.4.2. Product Portfolio
15.3.4.3. Financial Overview
15.3.4.4. SWOT Analysis
15.3.4.5. Strategic Overview
15.3.5. Millennium Surgical Corp
15.3.5.1. Company Overview (HQ, Business Segments, Employee Strength)
15.3.5.2. Product Portfolio
15.3.5.3. SWOT Analysis
15.3.5.4. Strategic Overview
15.3.5.5. Strategic Overview
15.3.6. Richard Wolf GmbH
15.3.6.1. Company Overview (HQ, Business Segments, Employee Strength)
15.3.6.2. Product Portfolio
15.3.6.3. Financial Overview
15.3.6.4. SWOT Analysis
15.3.6.5. Strategic Overview
15.3.7. Lazurite Holdings LLC
15.3.7.1. Company Overview (HQ, Business Segments, Employee Strength)
15.3.7.2. Product Portfolio
15.3.7.3. Financial Overview
15.3.7.4. SWOT Analysis
15.3.7.5. Strategic Overview
15.3.8. Smith & Nephew plc
15.3.8.1. Company Overview (HQ, Business Segments, Employee Strength)
15.3.8.2. Product Portfolio
15.3.8.3. Financial Overview
15.3.8.4. SWOT Analysis
15.3.8.5. Strategic Overview
15.3.9. Stryker Corporation
15.3.9.1. Company Overview (HQ, Business Segments, Employee Strength)
15.3.9.2. Product Portfolio
15.3.9.3. Product Portfolio
15.3.9.4. SWOT Analysis
15.3.9.5. Strategic Overview
15.3.10. Olympus Corporation
15.3.10.1. Company Overview (HQ, Business Segments, Employee Strength)
15.3.10.2. Product Portfolio
15.3.10.3. Financial Overview
15.3.10.4. SWOT Analysis
15.3.10.5. Strategic Overview
List of Tables
Table 01: Global Visualization Instruments for MIS Market Value (US$ Mn) Forecast, by Product Type, 2017–2031
Table 02: Global Visualization Instruments for MIS Market Value (US$ Mn) Forecast, by Visualization Systems, 2017–2031
Table 03: Global Visualization Instruments for MIS Market Value (US$ Mn) Forecast, by MIS Type, 2017–2031
Table 04: Global Visualization Instruments for MIS Market Value (US$ Mn) Forecast, by Endoscopy, 2017–2031
Table 05: Global Visualization Instruments for MIS Market Value (US$ Mn) Forecast, by End-user, 2017–2031
Table 06: Global Visualization Instruments for MIS Market Value (US$ Mn) Forecast, by Region, 2017–2031
Table 07: North America Visualization Instruments for MIS Market Value (US$ Mn) Forecast, by Product Type, 2017–2031
Table 08: North America Visualization Instruments for MIS Market Value (US$ Mn) Forecast, by Visualization Systems, 2017–2031
Table 09: North America Visualization Instruments for MIS Market Value (US$ Mn) Forecast, by MIS Type, 2017–2031
Table 10: North America Visualization Instruments for MIS Market Value (US$ Mn) Forecast, by Endoscopy, 2017–2031
Table 11: North America Visualization Instruments for MIS Market Value (US$ Mn) Forecast, by End-user, 2017–2031
Table 12: North America Visualization Instruments for MIS Market Value (US$ Mn) Forecast, by Country, 2017–2031
Table 13: Europe Visualization Instruments for MIS Market Value (US$ Mn) Forecast, by Product Type, 2017–2031
Table 14: Europe Visualization Instruments for MIS Market Value (US$ Mn) Forecast, by Visualization Systems, 2017–2031
Table 15: Europe Visualization Instruments for MIS Market Value (US$ Mn) Forecast, by MIS Type, 2017–2031
Table 16: Europe Visualization Instruments for MIS Market Value (US$ Mn) Forecast, by Endoscopy, 2017–2031
Table 17: Europe Visualization Instruments for MIS Market Value (US$ Mn) Forecast, by End-user, 2017–2031
Table 18: Europe Visualization Instruments for MIS Market Value (US$ Mn) Forecast, by Country/Sub-region, 2017–2031
Table 19: Asia Pacific Visualization Instruments for MIS Market Value (US$ Mn) Forecast, by Product Type, 2017–2031
Table 20: Asia Pacific Visualization Instruments for MIS Market Value (US$ Mn) Forecast, by Visualization Systems, 2017–2031
Table 21: Asia Pacific Visualization Instruments for MIS Market Value (US$ Mn) Forecast, by MIS Type, 2017–2031
Table 22: Asia Pacific Visualization Instruments for MIS Market Value (US$ Mn) Forecast, by Endoscopy, 2017–2031
Table 23: Asia Pacific Visualization Instruments for MIS Market Value (US$ Mn) Forecast, by End-user, 2017–2031
Table 24: Asia Pacific Visualization Instruments for MIS Market Value (US$ Mn) Forecast, by Country/Sub-region, 2017–2031
Table 25: Latin America Visualization Instruments for MIS Market Value (US$ Mn) Forecast, by Product Type, 2017–2031
Table 26: Latin America Visualization Instruments for MIS Market Value (US$ Mn) Forecast, by Visualization Systems, 2017–2031
Table 27: Latin America Visualization Instruments for MIS Market Value (US$ Mn) Forecast, by MIS Type, 2017–2031
Table 28: Latin America Visualization Instruments for MIS Market Value (US$ Mn) Forecast, by Endoscopy, 2017–2031
Table 29: Latin America Visualization Instruments for MIS Market Value (US$ Mn) Forecast, by End-user, 2017–2031
Table 30: Latin America Visualization Instruments for MIS Market Value (US$ Mn) Forecast, by Country/Sub-region, 2017–2031
Table 31: Middle East & Africa Visualization Instruments for MIS Market Value (US$ Mn) Forecast, by Product Type, 2017–2031
Table 32: Middle East & Africa Visualization Instruments for MIS Market Value (US$ Mn) Forecast, by Visualization Systems, 2017–2031
Table 33: Middle East & Africa Visualization Instruments for MIS Market Value (US$ Mn) Forecast, by MIS Type, 2017–2031
Table 34: Middle East & Africa Visualization Instruments for MIS Market Value (US$ Mn) Forecast, by Endoscopy, 2017–2031
Table 35: Middle East & Africa Visualization Instruments for MIS Market Value (US$ Mn) Forecast, by End-user, 2017–2031
Table 36: Middle East & Africa Visualization Instruments for MIS Market Value (US$ Mn) Forecast, by Country/Sub-region, 2017–2031
List of Figures
Figure 01: Global Visualization Instruments for MIS Market Value (US$ Mn) Forecast, 2017–2031
Figure 02: Global Visualization Instruments for MIS Market Analysis and Forecast, by Product Type, 2021 and 2031
Figure 03: Global Visualization Instruments for MIS Market Attractiveness Analysis, by Product Type, 2022–2031
Figure 04: Global Visualization Instruments for MIS Market Analysis and Forecast, by MIS Type 2021 and 2031
Figure 05: Global Visualization Instruments for MIS Market Attractiveness Analysis, by MIS Type, 2022–2031
Figure 06: Global Visualization Instruments for MIS Market Analysis and Forecast, by End-user, 2021 and 2031
Figure 07: Global Visualization Instruments for MIS Market Attractiveness Analysis, by End-user, 2022–2031
Figure 08: Global Visualization Instruments for MIS Market Analysis and Forecast, by Region, 2021 and 2031
Figure 09: Global Visualization Instruments for MIS Market Attractiveness Analysis, by Region, 2022–2031
Figure 10: North America Visualization Instruments for MIS Market Value (US$ Mn) Forecast, 2017–2031
Figure 11: North America Visualization Instruments for MIS Market Analysis and Forecast, by Product Type, 2021 and 2031
Figure 12: North America Visualization Instruments for MIS Market Attractiveness Analysis, by Product Type, 2022–2031
Figure 13: North America Visualization Instruments for MIS Market Analysis and Forecast, by MIS Type, 2021 and 2031
Figure 14: North America Visualization Instruments for MIS Market Attractiveness Analysis, by MIS Type, 2022–2031
Figure 15: North America Visualization Instruments for MIS Market Analysis and Forecast, by End-user, 2021 and 2031
Figure 16: North America Visualization Instruments for MIS Market Attractiveness Analysis, by End-user, 2022–2031
Figure 17: North America Visualization Instruments for MIS Market Analysis and Forecast, by Country, 2021 and 2031
Figure 18: North America Visualization Instruments for MIS Market Attractiveness Analysis, by Country, 2022–2031
Figure 19: Europe Visualization Instruments for MIS Market Value (US$ Mn) Forecast, 2017–2031
Figure 20: Europe Visualization Instruments for MIS Market Analysis and Forecast, by Product Type, 2021 and 2031
Figure 21: Europe Visualization Instruments for MIS Market Attractiveness Analysis, by Product Type, 2022–2031
Figure 22: Europe Visualization Instruments for MIS Market Analysis and Forecast, by MIS Type, 2021 and 2031
Figure 23: Europe Visualization Instruments for MIS Market Attractiveness Analysis, by MIS Type, 2022–2031
Figure 24: Europe Visualization Instruments for MIS Market Analysis and Forecast, by End-user, 2021 and 2031
Figure 25: Europe Visualization Instruments for MIS Market Attractiveness Analysis, by End-user, 2022–2031
Figure 26: Europe Visualization Instruments for MIS Market Analysis and Forecast, by Country/Sub-region, 2021 and 2031
Figure 27: Europe Visualization Instruments for MIS Market Attractiveness Analysis, by Country/Sub-region, 2022–2031
Figure 28: Asia Pacific Visualization Instruments for MIS Market Value (US$ Mn) Forecast, 2017–2031
Figure 29: Asia Pacific Visualization Instruments for MIS Market Analysis and Forecast, by Product Type, 2021 and 2031
Figure 30: Asia Pacific Visualization Instruments for MIS Market Attractiveness Analysis, by Product Type, 2022–2031
Figure 31: Asia Pacific Visualization Instruments for MIS Market Analysis and Forecast, by MIS Type 2021 and 2031
Figure 32: Asia Pacific Visualization Instruments for MIS Market Attractiveness Analysis, by MIS Type, 2022–2031
Figure 33: Asia Pacific Visualization Instruments for MIS Market Analysis and Forecast, by End-user, 2021 and 2031
Figure 34: Asia Pacific Visualization Instruments for MIS Market Attractiveness Analysis, by End-user, 2022–2031
Figure 35: Asia Pacific Visualization Instruments for MIS Market Analysis and Forecast, by Country/Sub-region, 2021 and 2031
Figure 36: Asia Pacific Visualization Instruments for MIS Market Attractiveness Analysis, by Country/Sub-region, 2022–2031
Figure 37: Latin America Visualization Instruments for MIS Market Value (US$ Mn) Forecast, 2017–2031
Figure 38: Latin America Visualization Instruments for MIS Market Analysis and Forecast, by Product Type, 2021 and 2031
Figure 39: Latin America Visualization Instruments for MIS Market Attractiveness Analysis, by Product Type, 2022–2031
Figure 40: Latin America Visualization Instruments for MIS Market Analysis and Forecast, by MIS Type, 2021 and 2031
Figure 41: Latin America Visualization Instruments for MIS Market Attractiveness Analysis, by MIS Type, 2022–2031
Figure 42: Latin America Visualization Instruments for MIS Market Analysis and Forecast, by End-user, 2021 and 2031
Figure 43: Latin America Visualization Instruments for MIS Market Attractiveness Analysis, by End-user, 2022–2031
Figure 44: Latin America Visualization Instruments for MIS Market Analysis and Forecast, by Country/Sub-region, 2021 and 2031
Figure 45: Latin America Visualization Instruments for MIS Market Attractiveness Analysis, by Country/Sub-region, 2022–2031
Figure 46: Middle East & Africa Visualization Instruments for MIS Market Value (US$ Mn) Forecast, 2017–2031
Figure 47: Middle East & Africa Visualization Instruments for MIS Market Analysis and Forecast, by Product Type, 2021 and 2031
Figure 48: Middle East & Africa Visualization Instruments for MIS Market Attractiveness Analysis, by Product Type, 2022–2031
Figure 49: Middle East & Africa Visualization Instruments for MIS Market Analysis and Forecast, by MIS Type, 2021 and 2031
Figure 50: Middle East & Africa Visualization Instruments for MIS Market Attractiveness Analysis, by MIS Type, 2022–2031
Figure 51: Middle East & Africa Visualization Instruments for MIS Market Analysis and Forecast, by End-user, 2021 and 2031
Figure 52: Middle East & Africa Visualization Instruments for MIS Market Attractiveness Analysis, by End-user, 2022–2031
Figure 53: Middle East & Africa Visualization Instruments for MIS Market Analysis and Forecast, by Country/Sub-region, 2021 and 2031
Figure 54: Middle East & Africa Visualization Instruments for MIS Market Attractiveness Analysis, by Country/Sub-region, 2022–2031
Figure 55: Global Visualization Instruments for MIS Market Share Analysis, by Company, 2021
Copyright © Transparency Market Research, Inc. All Rights reserved
Trust Online

Visualization Instruments for MIS Market