
Reports
Reports
The cancellation and postponement of events have been a recurring phenomenon in the virtualized RAN (vRAN) market due to the coronavirus (COVID-19) outbreak. For instance, the FCC (Federal Communications Commission) Summit, which was originally scheduled for March 26, 2020, was focused on 5G and the vRAN technology, and has been stalled due to the COVID-19 pandemic. Analysts at the Transparency Market Research (TMR) opine that companies in the virtualized RAN (vRAN) market and the FCC should make collaborative efforts to conduct online summits to discuss important aspects of 5G and the vRAN technology.
vRAN vendors are exploring incremental opportunities in the U.S. by addressing issues related to the cost-effective deployment of secure and interoperable 5G network components. As such, the FCC is increasing efforts to ensure the safety and health of its staff and the public to contain the spread of coronavirus.
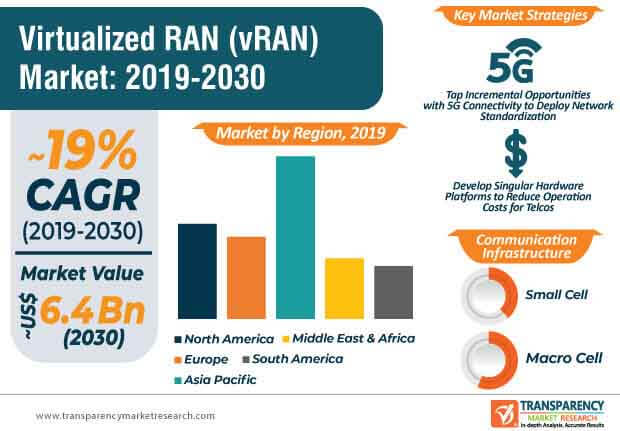
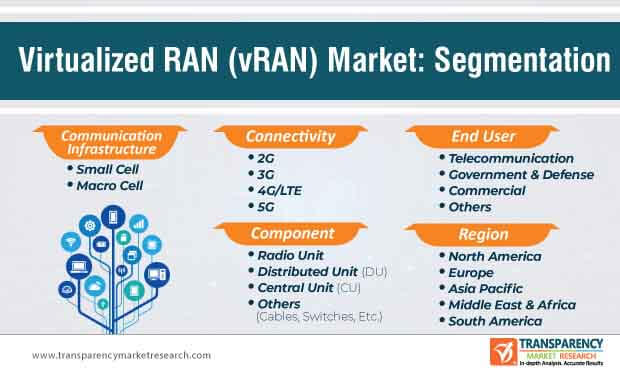
Software architectures are penetrating in almost all markets, be it telecommunication, government, or defense sectors. However, significant challenges such as processing and timing requirements are very crucial for the deployment of vRAN. Processing and timing requirements are the deciding factors for RAN capacity and coverage. Thus, the advantages of vRAN such as the deployment of the single uniform hardware platform across the core network, potentially offsets the disadvantages of vRAN. Singular hardware platforms help to simplify the management of the overall network whilst reducing operations and maintenance costs.
In order to help end users save on network maintenance costs, companies in the virtualized RAN (vRAN) market are innovating in platforms that separate the network functions from the processing hardware. This helps multiple vendors to simultaneously run their RAN network functions through a single hardware.
5G networks are accelerating investments in the virtualized RAN (vRAN) market. As such, edge computing is a hot technology buzzword among communication service providers (CSPs) and enterprises in order to develop and execute strategies that involve huge volumes of data. This is why Intel-a U.S. multinational corporation and technology company, is increasing efforts to look beyond the conventional open systems interconnection (OSI) model to innovate in virtualized RAN. In order to achieve this, companies in the virtualized RAN (vRAN) market are delivering multi-vendor virtualization so that protocols and software can be standardized across the industry.
Companies are looking into reference architectures that help them to innovate in software-based radio base stations. 5G networks are becoming popular for wireless data transmission such as LTE (Long Term Evolution) and also aids in workload acceleration. Leading companies are entering into partnerships to support diverse enterprises and cater various network end-use cases.
The virtualized RAN (vRAN) market is estimated to surpass the US$ 6.4 Bn mark by the end of 2030. This is evident since 4G and 5G networks are deploying innovations in cutting-edge virtualized RAN (vRAN) platforms. Global data networks innovator Sterlite Technologies Limited (STL) has announced to acquire stake in ASOCS-a provider of virtualized RAN solutions, which will help to address the rollout of 5G networks in telcos and other enterprises. Commercial off-the-shelf IT hardware and open standards complaint radios are paving the way for further investments in the virtualized RAN (vRAN) market.
The 5G network aids in the execution of mission-critical tasks and help deliver liability in localized private networks. Artificial intelligence (AI) and analytics are growing prominent in virtualized RAN platforms that derive benefits for mobile use cases.
5G is being publicized as the next-gen mobile technology that helps CSPs to accommodate heavy traffic loads. This explains why the virtualized RAN (vRAN) market is projected to register an explosive CAGR of ~19% during the assessment period. 5G is being looked as the engine that enables CSPs to achieve cost reduction in terms of managing dynamic networks and services. Key success drivers such as enhanced mobile broadband (eMBB) and massive machine type communications (mMTC) are creating value-grab opportunities for companies in the virtualized RAN (vRAN) market.
Analysts of TMR are anticipating quick response times and fast network speeds with the deployment of 5G in virtualized RAN platforms. vRAN is acquiring popularity for its contribution toward high spectral efficiency that supports multiple input and output capacities in devices. It also holds promising potentials in supporting multiple use cases that demand diverse performance requirements.
The cloud-native 5G RAN software is being upgraded to offer efficient network scalability. For instance, in February 2020, Altiostar-a provider of 4G and 5G virtualized RAN software solutions, announced the launch of first-of-its-kind container-based open 5G vRAN software, which is fast to deploy in end-use cases and deploys scalability for mobile network operators (MNOs). As such, mobile companies are collaborating with vendors in the virtualized RAN (vRAN) market to deploy virtualized mobile networks using cloud-based RAN platforms. Likewise, mobile companies are focusing on launching 5G networks to leverage cloud infrastructures.
Containerized applications using virtualized RAN software have helped to develop 5G services that are more responsive toward consumer needs. Virtualized RAN solution providers are collaborating with world leaders in the IT industry to innovate in the cloud-native containerized radio access technology. A cloud-native microservice-based architecture improves economics and scalability of 5G RANs for MNOs.
Analysts’ Viewpoint
The FCC has called for postponement of the 5G and vRAN-focused summit to ensure public and staff safety amidst the COVID-19 era. Companies in the virtualized RAN (vRAN) market are setting their collaboration wheels in motion by acquiring significant stakes in companies providing vRAN solutions to telcos and other enterprises. However, unprecedented challenges in the telecom industry such as overcoming capital and operating expenditure pressures pertaining to the revenue shift in over-the-top (OTT) providers acts as a hurdle for companies. Hence, companies should deploy 5G networks to help CSPs efficiently manage their network and address the revenue shift in the OTT sector.
Virtualized RAN (vRAN) Market is expected to rise to US$ 6.4 Bn by 2030
Virtualized RAN (vRAN) Market to expand at a CAGR of 19.0% during the forecast period 2030
Increasing adoption of digitized technology and IoT connected devices, and increasing data traffic is expected to drive the growth of the Virtualized RAN (vRAN) Market
North America is estimated to show prominent growth in the Virtualized RAN (vRAN) Market
Key players profiled in the report include Cisco Systems, Inc., Fujitsu Limited, Huawei Technologies co. Ltd, NEC Corporation, Samsung Electronics Co., Ltd., Verizon Communications, Ericsson Inc., Nokia Corporation, Red Hat, Inc., Hewlett Packard Enterprise Development LP, Intel Corporation, Juniper Networks Inc., Microchip Technology Inc., MTI Mobile, Qorvo, Inc., Mavenir Systems, Qualcomm Technologies, Inc., Quortus Limited, Radisys Corporation, and ZTE Corporation
1. Preface
1.1. Market Introduction
1.2. Market Segmentation
1.3. Key Research Objectives
2. Assumptions and Research Methodology
2.1. Research Methodology
2.1.1. List of Primary and Secondary Sources
2.2. Key Assumptions for Data Modelling
3. Executive Summary - Global vRAN + CRAN Market
4. Market Overview
4.1. Market Definition
4.2. Macroeconomic Factors
4.2.1. World GDP Indicator – For Top Economies
4.2.2. Global ICT Spending (US$ Mn)
4.3. Technology/ Product Roadmap
4.4. Market Factor Analysis
4.4.1. Forecast Factors
4.4.2. Ecosystem/ Value Chain Analysis
4.4.3. Market Dynamics (Growth Influencers)
4.4.3.1. Drivers
4.4.3.2. Restraints
4.4.3.3. Opportunities
4.4.3.4. Impact Analysis of Drivers and Restraints
4.5. Comparative Analysis of D-RAN and C-RAN
4.6. Analysis of Network Architecture required for transformation of 4G Virtualized Radio Access Network to 5G
4.7. Analysis of vRAN + CRAN Architecture
4.7.1. By Functional Split
4.7.1.1. Backhaul
4.7.1.2. Midhaul
4.7.1.3. Fronthaul
4.7.2. By Deployment
4.7.2.1. Co-located CU and DU
4.7.2.2. Independent RRU, CU and DU Locations
4.7.2.3. RRU and DU Integration
4.7.2.4. RRU, DU and CU Integration
4.8. COVID-19 Impact Analysis
4.8.1. End-user Sentiment Analysis: Comparative Analysis on Spending
4.8.1.1. Increase in Spending
4.8.1.2. Decrease in Spending
4.8.2. Impact of COVID-19 on Virtualized Radio Access Network Market
4.8.2.1. By Industry
4.8.2.1.1. Telecommunication
4.8.2.1.2. Government & Defense
4.8.2.1.3. Commercial
4.8.3. Short Term and Long Term Impact on Virtualized Radio Access Network Market
4.8.4. Recovery Period (3 Months/6 Months/12 Months)
4.9. Market Opportunity Assessment – by Region (North America/ Europe/ Asia Pacific/ Middle East & Africa/ South America)
4.9.1. By Component
4.9.2. By Communication Infrastructure
4.9.3. By Connectivity
4.9.4. By End-Users
4.10. Competitive Scenario and Trends
4.10.1. vRAN + CRAN Market Concentration Rate
4.10.1.1. List of Emerging, Prominent and Leading Players
4.10.2. Mergers & Acquisitions, Expansions
4.10.3. Product Mapping of vRAN + CRAN, by Leading Players
4.11. Market Outlook
5. Global vRAN + CRAN Market Analysis and Forecast
5.1. Market Revenue Analysis (US$ Mn), 2015-2030
5.1.1. Historic Growth Trends, 2015-2019
5.1.2. Forecast Trends, 2020-2030
5.2. Market Volume Analysis (Million Units), by Component, 2015-2030
5.2.1. Historic Growth Trends, 2015-2019
5.2.2. Forecast Trends, 2020-2030
5.3. Pricing Model Analysis/ Price Trend Analysis, Component
6. Global vRAN + CRAN Market Analysis, by Component
6.1. Overview and Definitions
6.2. Key Segment Analysis
6.3. vRAN + CRAN Market Size (US$ Mn & Thousand Units) Forecast, by Component, 2018 - 2030
6.3.1. Radio Unit
6.3.2. Distributed Unit (DU)
6.3.3. Central Unit (CU)
6.3.4. Others (Cables, Switches, Etc.)
7. Global vRAN + CRAN Market Analysis, by Communication Infrastructure
7.1. Overview and Definitions
7.2. Key Segment Analysis
7.3. vRAN + CRAN Market Size (US$ Mn & Thousand Unit) Forecast, by Communication Infrastructure, 2018 - 2030
7.3.1. Small Cell
7.3.2. Macro Cell
8. Global vRAN + CRAN Market Analysis, by Connectivity
8.1. Overview and Definitions
8.2. Key Segment Analysis
8.3. vRAN + CRAN Market Size (US$ Mn & Thousand Unit) Forecast, by Connectivity , 2018 - 2030
8.3.1. 2G
8.3.2. 3G
8.3.3. 4G/LTE
8.3.4. 5G
9. Global vRAN + CRAN Market Analysis, by End-Users
9.1. Overview and Definitions
9.2. Key Segment Analysis
9.3. vRAN + CRAN Market Size (US$ Mn ) Forecast, by End-Users , 2018 - 2030
9.3.1. Telecommunication
9.3.2. Government & Defense
9.3.3. Commercial
9.3.4. Others
10. Global vRAN + CRAN Market Analysis and Forecast, By Region
10.1. Key Findings
10.2. vRAN + CRAN Market Size (US$ Mn) Forecast, by Region, 2018 - 2030
10.2.1. North America
10.2.2. Europe
10.2.3. Asia Pacific
10.2.4. Middle East & Africa
10.2.5. South America
11. North America vRAN + CRAN Market Analysis
11.1. Regional Outlook
11.2. vRAN + CRAN Market Size (US$ Mn & Thousand Unit) Analysis and Forecast (2018 - 2030)
11.2.1. By Component
11.2.2. By Communication Infrastructure
11.2.3. By Connectivity
11.2.4. By End-Users
11.3. vRAN + CRAN Market Size (US$ Mn) Forecast, by Country, 2018 - 2030
11.3.1. U.S.
11.3.2. Canada
11.3.3. Mexico
12. Europe vRAN + CRAN Market Analysis and Forecast
12.1. Regional Outlook
12.2. vRAN + CRAN Market Size (US$ Mn & Thousand Unit) Analysis and Forecast (2018 - 2030)
12.2.1. By Component
12.2.2. By Communication Infrastructure
12.2.3. By Connectivity
12.2.4. By End-Users
12.3. vRAN + CRAN Market Size (US$ Mn) Forecast, by Country & Sub-region, 2018 - 2030
12.3.1. Germany
12.3.2. U.K.
12.3.3. France
12.3.4. Spain
12.3.5. Italy
12.3.6. Rest of Europe
13. APAC vRAN + CRAN Market Analysis and Forecast
13.1. Regional Outlook
13.2. vRAN + CRAN Market Size (US$ Mn & Thousand Unit) Analysis and Forecast (2018 - 2030)
13.2.1. By Component
13.2.2. By Communication Infrastructure
13.2.3. By Connectivity
13.2.4. By End-Users
13.3. vRAN + CRAN Market Size (US$ Mn) Forecast, by Country & Sub-region, 2018 - 2030
13.3.1. China
13.3.2. India
13.3.3. Japan
13.3.4. ASEAN
13.3.5. Rest of Asia Pacific
14. Middle East & Africa (MEA) vRAN + CRAN Market Analysis and Forecast
14.1. Regional Outlook
14.2. vRAN + CRAN Market Size (US$ Mn & Thousand Unit) Analysis and Forecast (2018 - 2030)
14.2.1. By Component
14.2.2. By Communication Infrastructure
14.2.3. By Connectivity
14.2.4. By End-Users
14.3. vRAN + CRAN Market Size (US$ Mn) Forecast, by Country & Sub-region, 2018 - 2030
14.3.1. Saudi Arabia
14.3.2. Kuwait
14.3.3. The United Arab Emirates
14.3.4. South Africa
14.3.5. Rest of Middle East & Africa (MEA)
15. South America vRAN + CRAN Market Analysis and Forecast
15.1. Regional Outlook
15.2. vRAN + CRAN Market Size (US$ Mn & Thousand Unit) Analysis and Forecast (2018 - 2030)
15.2.1. By Component
15.2.2. By Communication Infrastructure
15.2.3. By Connectivity
15.2.4. By End-Users
15.3. vRAN + CRAN Market Size (US$ Mn) Forecast, by Country & Sub-region, 2018 - 2030
15.3.1. Brazil
15.3.2. Argentina
15.3.3. Rest of South America
16. Competition Landscape
16.1. Market Competition Matrix, by Leading Players
16.2. Market Revenue Share Analysis (%), by Leading Players (2019)
17. Company Profiles
17.1. Cisco Systems, Inc.
17.1.1. Business Overview
17.1.2. Product Portfolio
17.1.3. Geographical Footprint
17.1.4. Revenue and Strategy
17.2. Ericsson AB
17.2.1. Business Overview
17.2.2. Product Portfolio
17.2.3. Geographical Footprint
17.2.4. Revenue and Strategy
17.3. Fujitsu
17.3.1. Business Overview
17.3.2. Product Portfolio
17.3.3. Geographical Footprint
17.3.4. Revenue and Strategy
17.4. Hewlett Packard Enterprise Development LP.
17.4.1. Business Overview
17.4.2. Product Portfolio
17.4.3. Geographical Footprint
17.4.4. Revenue and Strategy
17.5. Huawei Technologies Co., Ltd.
17.5.1. Business Overview
17.5.2. Product Portfolio
17.5.3. Geographical Footprint
17.5.4. Revenue and Strategy
17.6. Intel Corporation.
17.6.1. Business Overview
17.6.2. Product Portfolio
17.6.3. Geographical Footprint
17.6.4. Revenue and Strategy
17.7. Juniper Networks, Inc.
17.7.1. Business Overview
17.7.2. Product Portfolio
17.7.3. Geographical Footprint
17.7.4. Revenue and Strategy
17.8. Mavenir Systems inc.
17.8.1. Business Overview
17.8.2. Product Portfolio
17.8.3. Geographical Footprint
17.8.4. Revenue and Strategy
17.9. Microsemi Corporation
17.9.1. Business Overview
17.9.2. Product Portfolio
17.9.3. Geographical Footprint
17.9.4. Revenue and Strategy
17.10. MTI Mobile
17.10.1. Business Overview
17.10.2. Product Portfolio
17.10.3. Geographical Footprint
17.10.4. Revenue and Strategy
17.11. NEC Corporation
17.11.1. Business Overview
17.11.2. Product Portfolio
17.11.3. Geographical Footprint
17.11.4. Revenue and Strategy
17.12. Nokia Corporation
17.12.1. Business Overview
17.12.2. Product Portfolio
17.12.3. Geographical Footprint
17.12.4. Revenue and Strategy
17.13. Qorvo
17.13.1. Business Overview
17.13.2. Product Portfolio
17.13.3. Geographical Footprint
17.13.4. Revenue and Strategy
17.14. Qualcomm
17.14.1. Business Overview
17.14.2. Product Portfolio
17.14.3. Geographical Footprint
17.14.4. Revenue and Strategy
17.15. Quortus Limited.
17.15.1. Business Overview
17.15.2. Product Portfolio
17.15.3. Geographical Footprint
17.15.4. Revenue and Strategy
17.16. Radisys Corporation
17.16.1. Business Overview
17.16.2. Product Portfolio
17.16.3. Geographical Footprint
17.16.4. Revenue and Strategy
17.17. Red Hat, Inc.
17.17.1. Business Overview
17.17.2. Product Portfolio
17.17.3. Geographical Footprint
17.17.4. Revenue and Strategy
17.18. Samsung Electronics Co Ltd
17.18.1. Business Overview
17.18.2. Product Portfolio
17.18.3. Geographical Footprint
17.18.4. Revenue and Strategy
17.19. Verizon Communications Inc
17.19.1. Business Overview
17.19.2. Product Portfolio
17.19.3. Geographical Footprint
17.19.4. Revenue and Strategy
17.20. ZTE Corporation
17.20.1. Business Overview
17.20.2. Product Portfolio
17.20.3. Geographical Footprint
17.20.4. Revenue and Strategy
18. Key Takeaways
List of Tables
Table No.1 Global Virtual RAN (vRAN) Market
Table No.2 Global Virtual RAN (vRAN) Market Revenue (US$ Mn) and Forecast, by Component, 2018-2030
Table No.3 Global Virtual RAN (vRAN) Market Volume (Thousand Units) and Forecast, by Component, 2018-2030
Table No.4 Global Virtual RAN (vRAN) Market Revenue (US$ Mn) and Forecast, Communication Infrastructure, 2018-2030
Table No.5 Global Virtual RAN (vRAN) Market Volume (Thousand Units) and Forecast, by Communication Infrastructure, 2018-2030
Table No.6 Global Virtual RAN (vRAN) Market Revenue (US$ Mn) and Forecast, Connectivity, 2018-2030
Table No.7 Global Virtual RAN (vRAN) Market Revenue (US$ Mn) and Forecast by End-user, 2018-2030
Table No.8 Global Virtual RAN (vRAN) Market Revenue (US$ Mn) and Forecast, by Region, 2018-2030
Table No.9 North America Virtual RAN (vRAN) Market Revenue (US$ Mn) and Forecast, by Component, 2018-2030
Table No.10 North America Virtual RAN (vRAN) Market Volume (Thousand Units) and Forecast, by Component, 2018-2030
Table No.11 North America Virtual RAN (vRAN) Market Revenue (US$ Mn) and Forecast, Communication Infrastructure, 2018-2030
Table No.12 North America Virtual RAN (vRAN) Market Volume (Thousand Units) and Forecast, Communication Infrastructure, 2018-2030
Table No.13 North America Virtual RAN (vRAN) Market Revenue (US$ Mn) and Forecast, Connectivity, 2018-2030
Table No.14 North America Virtual RAN (vRAN) Market Revenue (US$ Mn) and Forecast by End-user, 2018-2030
Table No.15 North America Virtual RAN (vRAN) Market Revenue (US$ Mn) and Forecast, by Country, 2018-2030
Table No.16 Europe Virtual RAN (vRAN) Market Revenue (US$ Mn) and Forecast, by Component, 2018-2030
Table No.17 Europe Virtual RAN (vRAN) Market Volume (Thousand Units) and Forecast, by Component, 2018-2030
Table No.18 Europe Virtual RAN (vRAN) Market Revenue (US$ Mn) and Forecast, Communication Infrastructure, 2018-2030
Table No.19 Europe Virtual RAN (vRAN) Market Volume (Thousand Units) and Forecast, Communication Infrastructure, 2018-2030
Table No.20 Europe Virtual RAN (vRAN) Market Revenue (US$ Mn) and Forecast, Connectivity, 2018-2030
Table No.21 Europe Virtual RAN (vRAN) Market Revenue (US$ Mn) and Forecast by End-user, 2018-2030
Table No.22 Europe Virtual RAN (vRAN) Market Revenue (US$ Mn) and Forecast, by Country, 2018-2030
Table No.23 Asia Pacific Virtual RAN (vRAN) Market Revenue (US$ Mn) and Forecast, by Component, 2018-2030
Table No.24 Asia Pacific Virtual RAN (vRAN) Market Volume (Thousand Units) and Forecast, by Component, 2018-2030
Table No.25 Asia Pacific Virtual RAN (vRAN) Market Revenue (US$ Mn) and Forecast, Communication Infrastructure, 2018-2030
Table No.26 Asia Pacific Virtual RAN (vRAN) Market Volume (Thousand Units) and Forecast, Communication Infrastructure, 2018-2030
Table No.27 Asia Pacific Virtual RAN (vRAN) Market Revenue (US$ Mn) and Forecast, Connectivity, 2018-2030
Table No.28 Asia Pacific Virtual RAN (vRAN) Market Revenue (US$ Mn) and Forecast by End-user, 2018-2030
Table No.29 Asia Pacific Virtual RAN (vRAN) Market Revenue (US$ Mn) and Forecast, by Country, 2018-2030
Table No.30 Middle East & Africa Virtual RAN (vRAN) Market Revenue (US$ Mn) and Forecast, by Component, 2018-2030
Table No.31 Middle East & Africa Virtual RAN (vRAN) Market Volume (Thousand Units) and Forecast, by Component, 2018-2030
Table No.32 Middle East & Africa Virtual RAN (vRAN) Market Revenue (US$ Mn) and Forecast, Communication Infrastructure, 2018-2030
Table No.33 Middle East & Africa Virtual RAN (vRAN) Market Volume (Thousand Units) and Forecast, Communication Infrastructure, 2018-2030
Table No.34 Middle East & Africa Virtual RAN (vRAN) Market Revenue (US$ Mn) and Forecast, Connectivity, 2018-2030
Table No.35 Middle East & Africa Virtual RAN (vRAN) Market Revenue (US$ Mn) and Forecast by End-user, 2018-2030
Table No.36 Middle East and Africa (MEA) Virtual RAN (vRAN) Market Revenue (US$ Mn) and Forecast, by Country, 2018-2030
Table No.37 South America Virtual RAN (vRAN) Market Revenue (US$ Mn) and Forecast, by Component, 2018-2030
Table No.38 South America Virtual RAN (vRAN) Market Volume (Thousand Units) and Forecast, by Component, 2018-2030
Table No.39 South America Virtual RAN (vRAN) Market Revenue (US$ Mn) and Forecast, Communication Infrastructure, 2018-2030
Table No.40 South America Virtual RAN (vRAN) Market Volume (Thousand Units) and Forecast, Communication Infrastructure, 2018-2030
Table No.41 South America Virtual RAN (vRAN) Market Revenue (US$ Mn) and Forecast, Connectivity, 2018-2030
Table No.42 South America Virtual RAN (vRAN) Market Revenue (US$ Mn) and Forecast by End-user, 2018-2030
Table No.43 South America Virtual RAN (vRAN) Market Revenue (US$ Mn) and Forecast, by Country, 2018-2030
List of Figures
Figure No.1 Global Virtual RAN (vRAN) Market Size (US$ Mn) Forecast, 2018 – 2030
Figure No.2 Global Virtual RAN (vRAN) Market Revenue (US$ Mn) Opportunity Assessment, by Region, 2020E
Figure No. 3 Global Virtual RAN (vRAN) Market Revenue (US$ Mn) Opportunity Assessment, by Region, 2030F
Figure No. 4 REGIONAL OUTLINE
Figure No.5 GDP (US$ Bn), Top Countries (2014 – 2019)
Figure No.6 Top Economies GDP Landscape, 2019
Figure No.8 Global ICT Spending (US$ Bn), Regional Contribution, 2019
Figure No.7 Global ICT Spending (%), by Region, 2019
Figure No. 9 Global ICT Spending (US$ Bn), Spending Type Contribution, 2019
Figure No. 10 Global ICT Spending (%), by Type, 2019
Figure No.11 Attractiveness Assessment, by Component
Figure No.12 Opportunity Assessment, by Component
Figure No.13 Attractiveness Assessment, by Communication Infrastructure
Figure No.14 Opportunity Assessment, by Communication Infrastructure
Figure No.15 Attractiveness Assessment, by Connectivity
Figure No.16 Opportunity Assessment, by Connectivity
Figure No.17 Attractiveness Assessment, by End-user
Figure No.18 Opportunity Assessment, by End-user
Figure No.19 Attractiveness Assessment, by Region
Figure No. 20 Opportunity Assessment, by Region
Figure No.22 Global Virtual RAN (vRAN) Market, By Communication Infrastructure, CAGR (%) (2020 – 2030)
Figure No.24 Global Virtual RAN (vRAN) Market, By End-user, CAGR (%) (2020 – 2030)
Figure No.21 Global Virtual RAN (vRAN) Market, By Component, CAGR (%) (2020 – 2030)
Figure No.23 Global Virtual RAN (vRAN) Market, By Connectivity, CAGR (%) (2020 – 2030)
Figure No.25 Global Virtual RAN (vRAN) Market Historic Growth Trends (US$ Mn), 2015 – 2019
Figure No.26 Global Virtual RAN (vRAN) Market Forecast Growth Trends (US$ Mn), 2020 – 2030
Figure No.27 Global Virtual RAN (vRAN) Market Share Analysis, by Component, 2020
Figure No.28 Global Virtual RAN (vRAN) Market Share Analysis, by Component, 2030
Figure No.29 Global Virtual RAN (vRAN) Market Share Analysis, Communication Infrastructure, 2020
Figure No.30 Global Virtual RAN (vRAN) Market Share Analysis, Communication Infrastructure, 2030
Figure No.31 Global Virtual RAN (vRAN) Market Share Analysis, Connectivity, 2020
Figure No.32 Global Virtual RAN (vRAN) Market Share Analysis, Connectivity, 2030
Figure No.33 Global Virtual RAN (vRAN) Market Share Analysis, End-user, 2020
Figure No.34 Global Virtual RAN (vRAN) Market Share Analysis, End-user, 2030
Figure No. 35 Global Virtual RAN (vRAN) Market Share Analysis, by Region, 2020
Figure No. 36 Global Virtual RAN (vRAN) Market Share Analysis, by Region, 20306
Figure No. 37 North America Virtual RAN (vRAN) Market Share Analysis, by Component, 2020
Figure No. 38 North America Virtual RAN (vRAN) Market Share Analysis, by Component, 2030
Figure No. 39 North America Virtual RAN (vRAN) Market Share Analysis, Communication Infrastructure, 2020
Figure No. 40 North America Virtual RAN (vRAN) Market Share Analysis, Communication Infrastructure, 2030
Figure No. 41 North America Virtual RAN (vRAN) Market Share Analysis, Connectivity, 2020
Figure No. 42 North America Virtual RAN (vRAN) Market Share Analysis, Connectivity, 2030
Figure No. 43 North America Virtual RAN (vRAN) Market Share Analysis, End-user, 2020
Figure No. 44 North America Virtual RAN (vRAN) Market Share Analysis, End-user, 2030
Figure No. 45 North America Virtual RAN (vRAN) Market Share Analysis, by Country, 2020
Figure No. 46 North America Virtual RAN (vRAN) Market Share Analysis, by Country, 2030
Figure No. 47 Europe Virtual RAN (vRAN) Market Share Analysis, by Component, 2020
Figure No. 48 Europe Virtual RAN (vRAN) Market Share Analysis, by Component, 2030
Figure No. 49 Europe Virtual RAN (vRAN) Market Share Analysis, Communication Infrastructure, 2020
Figure No. 50 Europe Virtual RAN (vRAN) Market Share Analysis, Communication Infrastructure, 2030
Figure No. 51 Europe Virtual RAN (vRAN) Market Share Analysis, Connectivity, 2020
Figure No. 52 Europe Virtual RAN (vRAN) Market Share Analysis, Connectivity, 2030
Figure No. 53 Europe Virtual RAN (vRAN) Market Share Analysis, End-user, 2020
Figure No. 54 Europe Virtual RAN (vRAN) Market Share Analysis, End-user, 2030
Figure No. 55 Europe Virtual RAN (vRAN) Market Share Analysis, by Country, 2020
Figure No. 56 Europe Virtual RAN (vRAN) Market Share Analysis, by Country, 2030
Figure No. 57 Asia Pacific Virtual RAN (vRAN) Market Share Analysis, by Component, 2020
Figure No. 58 Asia Pacific Virtual RAN (vRAN) Market Share Analysis, by Component, 2030
Figure No. 59 Asia Pacific Virtual RAN (vRAN) Market Share Analysis, Communication Infrastructure, 2020
Figure No. 60 Asia Pacific Virtual RAN (vRAN) Market Share Analysis, Communication Infrastructure, 2030
Figure No. 61 Asia Pacific Virtual RAN (vRAN) Market Share Analysis, Connectivity, 2020
Figure No. 62 Asia Pacific Virtual RAN (vRAN) Market Share Analysis, Connectivity, 2030
Figure No. 63 Asia Pacific Virtual RAN (vRAN) Market Share Analysis, End-user, 2020
Figure No. 64 Asia Pacific Virtual RAN (vRAN) Market Share Analysis, End-user, 2030
Figure No. 65 Asia Pacific Virtual RAN (vRAN) Market Share Analysis, by Country, 2020
Figure No. 66 Asia Pacific Virtual RAN (vRAN) Market Share Analysis, by Country, 2030
Figure No. 67 Middle East & Africa Virtual RAN (vRAN) Market Share Analysis, by Component, 2020
Figure No. 68 Middle East & Africa Virtual RAN (vRAN) Market Share Analysis, by Component, 2030
Figure No. 69 Middle East & Africa Virtual RAN (vRAN) Market Share Analysis, Communication Infrastructure, 2020
Figure No. 70 Middle East & Africa Virtual RAN (vRAN) Market Share Analysis, Communication Infrastructure, 2030
Figure No. 71 Middle East & Africa Virtual RAN (vRAN) Market Share Analysis, Connectivity, 2020
Figure No. 72 Middle East & Africa Virtual RAN (vRAN) Market Share Analysis, Connectivity, 2030
Figure No. 73 Middle East & Africa Virtual RAN (vRAN) Market Share Analysis, End-user, 2020
Figure No. 74 Middle East & Africa Virtual RAN (vRAN) Market Share Analysis, End-user, 2030
Figure No. 75 Middle East and Africa (MEA) Virtual RAN (vRAN) Market Share Analysis, by Country, 2020
Figure No. 76 Middle East and Africa (MEA) Virtual RAN (vRAN) Market Share Analysis, by Country, 2030
Figure No. 77 South America Virtual RAN (vRAN) Market Share Analysis, by Component, 2020
Figure No. 78 South America Virtual RAN (vRAN) Market Share Analysis, by Component, 2030
Figure No. 79 South America Virtual RAN (vRAN) Market Share Analysis, Communication Infrastructure, 2020
Figure No. 80 South America Virtual RAN (vRAN) Market Share Analysis, Communication Infrastructure, 2030
Figure No. 81 South America Virtual RAN (vRAN) Market Share Analysis, Connectivity, 2020
Figure No. 82 South America Virtual RAN (vRAN) Market Share Analysis, Connectivity, 2030
Figure No. 83 South America Virtual RAN (vRAN) Market Share Analysis, End-user, 2020
Figure No. 84 South America Virtual RAN (vRAN) Market Share Analysis, End-user, 2030
Figure No. 85 South America Virtual RAN (vRAN) Market Share Analysis, by Country, 2020
Figure No. 86 South America Virtual RAN (vRAN) Market Share Analysis, by Country, 2030
Copyright © Transparency Market Research, Inc. All Rights reserved
Trust Online

Virtualized RAN (vRAN) Market