
Reports
Reports
Technological advancements continue to play an essential role in the healthcare industry. At present, urologists are increasingly relying on newer technologies to offer safe and effective treatments. Advancements in technology have paved the way for minimally invasive procedures and robots in the healthcare sector. Moreover, imaging in the medical field has improved at a considerable pace primarily driven by innovations and progress in technology. Moreover, focus on research and development is expected to generate significant interest in nanotechnology and tissue engineering marking the start of a new era in the field of urology. Urology imaging equipment and diagnostics continue to evolve at an impressive rate and the uptake of the same is also witnessing substantial growth.
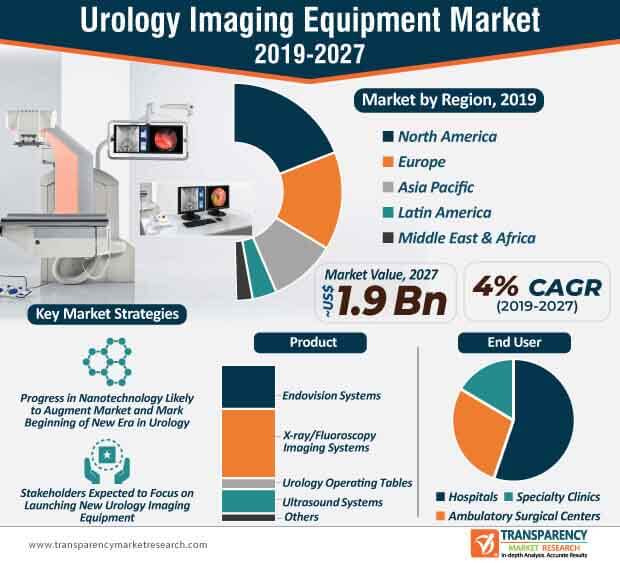
Over the past few years, narrow-band imaging in endoscopy to improve mucosal detail has gained a significant amount of popularity due to a range of factors. In comparison with the existing white-light cystoscopy, the improved ability of narrow-band imaging in the detection of cancerous tissues is a major factor that is projected to increase the prospects of the urology imaging equipment market during the forecast period. Furthermore, the growing adoption of magnetic resonance imaging (MRI) due to progress in nanotechnology will also augment the urology imaging equipment market, which is expected to attain a market value of ~US$ 1.9 Bn by the end of 2027. The launch of state-of-the-art urology imaging equipment, particularly in developed regions including North America and Europe is expected to increase the adoption of urology imaging equipment in the coming years.
With significant rise in the number of chronic kidney diseases, tissue regeneration is expected to gain a notable amount of traction in the coming years. Healthcare experts and researchers are focusing on improving the potential of stem-cell therapies in the urological field by negotiating various challenges, including epigenetic changes and immune reactions. Participants in the current urology imaging equipment market are also expected to explore the potential of nanotechnology in targeted therapies. Studies have revealed that nanoparticles have the ability to improve the chemotherapeutic action of apoptosis in prostate cancer cells. In addition, the uptake of nanoparticles in gene therapy is on the rise, as they are safer and efficient than the other vector alternatives. Apart from targeted therapies, nanotechnology is anticipated to play a major role in the development of next-generation urological imaging equipment. Moreover, nanotechnology has also played a key role in improving MRI scanning– a factor that is expected to boost the growth of the urology imaging equipment market in the upcoming years.
At present, with nanotechnology hovering around the urology imaging equipment market, training of modern-day urologists is imperative. Progress in computing capacity and interactivity will boost the prospects of the urology imaging equipment market during the forecast period.
Over the next few years, urological technology is expected to advance at a steady pace due to which, the growth of the urology imaging equipment market is expected. Participants in the current market landscape are projected to focus on improving the efficiency of urology imaging equipment.
Companies involved in the current urology imaging equipment market are expected to leverage the benefits of new technologies to develop cutting-edge urology imaging systems. The flurry of new urology imaging systems in the upcoming years will continue to drive the market growth. For instance, in 2018, Siemens Healthineers launched the Acuson Sequoia, an advanced ultrasound system to overcome the existing challenges in ultrasound imaging. Additionally, Guerbet launched the L-F Hydra Vision TM Digital Urological Imaging Equipment, which aims to enhance the efficiency of urological imaging and organize workflows. Companies are likely to align their product development strategies in accordance with evolving requirements of modern-day diagnostic imaging. During the forecast period, fluoroscopy imaging systems, endovision systems, and ultrasound systems are likely to gain considerable popularity.
Analysts’ Viewpoint
The global urology imaging equipment market is expected to grow at a CAGR of 4% during the forecast period. Some of the leading factors that will contribute to market growth include advancements in medical imaging technologies, progress in computing capacity, advent of nanotechnology in urology, and growing demand for minimally invasive procedures. The adoption of multimodality imaging technologies will continue to grow in the coming years, due to which the demand for urology imaging equipment is projected to rise. Companies in the urology imaging equipment market should focus on launching new imaging systems with improved efficiency and capabilities to gain an edge over their competitors.
Urology imaging equipment market To Reach Valuation Of ~US$ 1.9 Bn By 2027
Urology imaging equipment market is projected to expand at a CAGR of 4% from 2019 to 2027
Urology imaging equipment market is driven by increase in demand for early diagnosis
The x-ray/fluoroscopy imaging systems segment accounted for a major share of the global urology imaging equipment market
Key players in the global urology imaging equipment market include Stryker, Olympus Corporation, Guerbet, GE Healthcare (General Electric Company), KARL STORZ
1. Preface
1.1. Market Definition and Scope
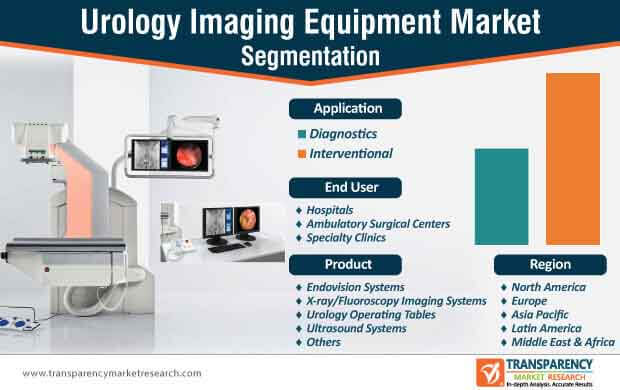
1.2. Market Segmentation
1.3. Key Research Objectives
1.4. Research Highlights
2. Assumptions and Research Methodology
3. Executive Summary : Global Urology Imaging Equipment Market
4. Market Overview
4.1. Introduction
4.1.1. Product/Definition
4.1.2. Industry Evolution / Developments
4.2. Overview
4.3. Market Dynamics
4.3.1. Drivers
4.3.2. Restraints
4.3.3. Opportunities
4.4. Global Urology Imaging Equipment Market Analysis and Forecast, 2017–2027
5. Market Outlook
5.1. Disease Epidemiology
5.2. Technological Advancements
5.3. Regulatory Scenario by Region/Globally
6. Global Urology Imaging Equipment Market Analysis and Forecast, by Product
6.1. Introduction & Definition
6.2. Key Findings / Developments
6.3. Global Urology Imaging Equipment Market Value Forecast, by Product, 2017–2027
6.3.1. Endovision Systems
6.3.2. X-ray/Fluoroscopy Imaging Systems
6.3.3. Urology Operating Tables
6.3.4. Ultrasound Systems
6.3.5. Others
6.4. Global Urology Imaging Equipment Market Attractiveness, by Product
7. Global Urology Imaging Equipment Market Analysis and Forecast, by Application
7.1. Introduction & Definition
7.2. Key Findings / Developments
7.3. Global Urology Imaging Equipment Market Value Forecast, by Application, 2017–2027
7.3.1. Diagnostics
7.3.2. Interventional
7.4. Global Urology Imaging Equipment Market Attractiveness, by Application
8. Global Urology Imaging Equipment Market Analysis and Forecast, by End-user
8.1. Introduction & Definition
8.2. Key Findings / Developments
8.3. Global Urology Imaging Equipment Market Value Forecast, by End-user, 2017–2027
8.3.1. Hospitals
8.3.2. Ambulatory Surgical Centers
8.3.3. Specialty Clinics
8.4. Global Urology Imaging Equipment Market Attractiveness, by End-user
9. Global Urology Imaging Equipment Market Analysis and Forecast, by Region
9.1. Key Findings
9.2. Global Urology Imaging Equipment Market Value Forecast, by Region
9.2.1. North America
9.2.2. Europe
9.2.3. Asia Pacific
9.2.4. Latin America
9.2.5. Middle East & Africa
9.3. Global Urology Imaging Equipment Market Attractiveness, by Region
10. North America Urology Imaging Equipment Market Analysis and Forecast
10.1. Introduction
10.1.1. Key Findings
10.2. North America Urology Imaging Equipment Market Value Forecast, by Product, 2017–2027
10.2.1. Endovision Systems
10.2.2. X-ray/Fluoroscopy Imaging Systems
10.2.3. Urology Operating Tables
10.2.4. Ultrasound Systems
10.2.5. Others
10.3. North America Urology Imaging Equipment Market Value Forecast, by Application, 2017–2027
10.3.1. Diagnostics
10.3.2. Interventional
10.4. North America Urology Imaging Equipment Market Value Forecast, by End-user, 2017–2027
10.4.1. Hospitals
10.4.2. Ambulatory Surgical Centers
10.4.3. Specialty Clinics
10.5. North America Urology Imaging Equipment Market Value Forecast, by Country, 2017–2027
10.5.1. U.S.
10.5.2. Canada
10.6. North America Urology Imaging Equipment Market Attractiveness Analysis
10.6.1. By Product
10.6.2. By Application
10.6.3. By End-user
10.6.4. By Country
11. Europe Urology Imaging Equipment Market Analysis and Forecast
11.1. Introduction
11.1.1. Key Findings
11.2. Europe Urology Imaging Equipment Market Value Forecast, by Product, 2017–2027
11.2.1. Endovision Systems
11.2.2. X-ray/Fluoroscopy Imaging Systems
11.2.3. Urology Operating Tables
11.2.4. Ultrasound Systems
11.2.5. Others
11.3. Europe Urology Imaging Equipment Market Value Forecast, by Application, 2017–2027
11.3.1. Diagnostics
11.3.2. Interventional
11.4. Europe Urology Imaging Equipment Market Value Forecast, by End-user, 2017–2027
11.4.1. Hospitals
11.4.2. Ambulatory Surgical Centers
11.4.3. Specialty Clinics
11.5. Europe Urology Imaging Equipment Market Value Forecast, by Country/Sub-region, 2017–2027
11.5.1. Germany
11.5.2. U.K.
11.5.3. France
11.5.4. Spain
11.5.5. Italy
11.5.6. Rest of Europe
11.6. Europe Urology Imaging Equipment Market Attractiveness Analysis
11.6.1. By Product
11.6.2. By Application
11.6.3. By End-user
11.6.4. By Country/Sub-region
12. Asia Pacific Urology Imaging Equipment Market Analysis and Forecast
12.1. Introduction
12.1.1. Key Findings
12.2. Asia Pacific Urology Imaging Equipment Market Value Forecast, by Product, 2017–2027
12.2.1. Endovision Systems
12.2.2. X-ray/Fluoroscopy Imaging Systems
12.2.3. Urology Operating Tables
12.2.4. Ultrasound Systems
12.2.5. Others
12.3. Asia Pacific Urology Imaging Equipment Market Value Forecast, by Application, 2017–2027
12.3.1. Diagnostics
12.3.2. Interventional
12.4. Asia Pacific Urology Imaging Equipment Market Value Forecast, by End-user, 2017–2027
12.4.1. Hospitals
12.4.2. Ambulatory Surgical Centers
12.4.3. Specialty Clinics
12.5. Asia Pacific Urology Imaging Equipment Market Value Forecast, by Country/Sub-region, 2017–2027
12.5.1. China
12.5.2. Japan
12.5.3. India
12.5.4. Australia & New Zealand
12.5.5. Rest of Asia Pacific
12.6. Asia Pacific Urology Imaging Equipment Market Attractiveness Analysis
12.6.1. By Product
12.6.2. By Application
12.6.3. By End-user
12.6.4. By Country/Sub-region
13. Latin America Urology Imaging Equipment Market Analysis and Forecast
13.1. Introduction
13.1.1. Key Findings
13.2. Latin America Urology Imaging Equipment Market Value Forecast, by Product, 2017–2027
13.2.1. Endovision Systems
13.2.2. X-ray/Fluoroscopy Imaging Systems
13.2.3. Urology Operating Tables
13.2.4. Ultrasound Systems
13.2.5. Others
13.3. Latin America Urology Imaging Equipment Market Value Forecast, by Application, 2017–2027
13.3.1. Diagnostics
13.3.2. Interventional
13.4. Latin America Urology Imaging Equipment Market Value Forecast, by End-user, 2017–2027
13.4.1. Hospitals
13.4.2. Ambulatory Surgical Centers
13.4.3. Specialty Clinics
13.5. Latin America Urology Imaging Equipment Market Value Forecast, by Country/Sub-region, 2017–2027
13.5.1. Brazil
13.5.2. Mexico
13.5.3. Rest of Latin America
13.6. Latin America Urology Imaging Equipment Market Attractiveness Analysis
13.6.1. By Product
13.6.2. By Application
13.6.3. By End-user
13.6.4. By Country/Sub-region
14. Middle East & Africa Urology Imaging Equipment Market Analysis and Forecast
14.1. Introduction
14.1.1. Key Findings
14.2. Middle East & Africa Urology Imaging Equipment Market Value Forecast, by Product, 2017–2027
14.2.1. Endovision Systems
14.2.2. X-ray/Fluoroscopy Imaging Systems
14.2.3. Urology Operating Tables
14.2.4. Ultrasound Systems
14.2.5. Others
14.3. Middle East & Africa Urology Imaging Equipment Market Value Forecast, by Application, 2017–2027
14.3.1. Diagnostics
14.3.2. Interventional
14.4. Middle East & Africa Urology Imaging Equipment Market Value Forecast, by End-user, 2017–2027
14.4.1. Hospitals
14.4.2. Ambulatory Surgical Centers
14.4.3. Specialty Clinics
14.5. Middle East & Africa Urology Imaging Equipment Market Value Forecast, by Country/Sub-region, 2017–2027
14.5.1. GCC Countries
14.5.2. South Africa
14.5.3. Rest of Middle East & Africa
14.6. Middle East & Africa Urology Imaging Equipment Market Attractiveness Analysis
14.6.1. By Product
14.6.2. By Application
14.6.3. By End-user
14.6.4. By Country/Sub-region
15. Competition Landscape
15.1. Market Player – Competition Matrix (By Tier and Size of companies)
15.2. Company Profiles
15.2.1. Stryker
15.2.1.1. Company Overview
15.2.1.2. Company Financials
15.2.1.3. Growth Strategies
15.2.1.4. SWOT Analysis
15.2.2. Olympus Corporation
15.2.2.1. Company Overview
15.2.2.2. Company Financials
15.2.2.3. Growth Strategies
15.2.2.4. SWOT Analysis
15.2.3. Guerbet
15.2.3.1. Company Overview
15.2.3.2. Company Financials
15.2.3.3. Growth Strategies
15.2.3.4. SWOT Analysis
15.2.4. GE Healthcare (General Electric Company)
15.2.4.1. Company Overview
15.2.4.2. Company Financials
15.2.4.3. Growth Strategies
15.2.4.4. SWOT Analysis
15.2.5. KARL STORZ
15.2.5.1. Company Overview
15.2.5.2. Growth Strategies
15.2.5.3. SWOT Analysis
15.2.6. Siemens Healthineers
15.2.6.1. Company Overview
15.2.6.2. Company Financials
15.2.6.3. Growth Strategies
15.2.6.4. SWOT Analysis
15.2.7. Richard Wolf GmbH
15.2.7.1. Company Overview
15.2.7.2. Growth Strategies
15.2.7.3. SWOT Analysis
15.2.8. CANON MEDICAL SYSTEMS CORPORATION
15.2.8.1. Company Overview
15.2.8.2. Company Financials
15.2.8.3. Growth Strategies
15.2.8.4. SWOT Analysis
15.2.9. Koninklijke Philips N.V.
15.2.9.1. Company Overview
15.2.9.2. Company Financials
15.2.9.3. Growth Strategies
15.2.9.4. SWOT Analysis
15.2.10. Boston Scientific Corporation
15.2.10.1. Company Overview
15.2.10.2. Company Financials
15.2.10.3. Growth Strategies
15.2.10.4. SWOT Analysis
List of Tables
Table 01: Global Urology Imaging Equipment Market Value (US$ Mn) Forecast, by Product, 2017–2027
Table 02: Global Urology Imaging Equipment Market Value (US$ Mn) Forecast, by Application, 2017–2027
Table 03: Global Urology Imaging Equipment Market Value (US$ Mn) Forecast, by End-user, 2017–2027
Table 04: Global Urology Imaging Equipment Market Value (US$ Mn) Forecast, by Region, 2017–2027
Table 05: North America Urology Imaging Equipment Market Value (US$ Mn) Forecast, by Product, 2017–2027
Table 06: North America Urology Imaging Equipment Market Value (US$ Mn) Forecast, by Application, 2017–2027
Table 07: North America Urology Imaging Equipment Market Value (US$ Mn) Forecast, by End-user, 2017–2027
Table 08: North America Urology Imaging Equipment Market Value (US$ Mn) Forecast, by Country, 2017–2027
Table 09: Europe Urology Imaging Equipment Market Value (US$ Mn) Forecast, by Product, 2017–2027
Table 10: Europe Urology Imaging Equipment Market Value (US$ Mn) Forecast, by Application, 2017–2027
Table 11: Europe Urology Imaging Equipment Market Value (US$ Mn) Forecast, by End-user, 2017–2027
Table 12: Europe Urology Imaging Equipment Market Value (US$ Mn) Forecast, by Country/Sub-region, 2017–2027
Table 13: Asia Pacific Urology Imaging Equipment Market Value (US$ Mn) Forecast, by Product, 2017–2027
Table 14: Asia Pacific Urology Imaging Equipment Market Value (US$ Mn) Forecast, by Application, 2017–2027
Table 15: Asia Pacific Urology Imaging Equipment Market Value (US$ Mn) Forecast, by End-user, 2017–2027
Table 16: Asia Pacific Urology Imaging Equipment Market Value (US$ Mn) Forecast, by Country/Sub-region, 2017–2027
Table 17: Latin America Urology Imaging Equipment Market Value (US$ Mn) Forecast, by Product, 2017–2027
Table 18: Latin America Urology Imaging Equipment Market Value (US$ Mn) Forecast, by Application, 2017–2027
Table 19: Latin America Urology Imaging Equipment Market Value (US$ Mn) Forecast, by End-user, 2017–2027
Table 20: Latin America Urology Imaging Equipment Market Value (US$ Mn) Forecast, by Country/Sub-region, 2017–2027
Table 21: Middle East & Africa Urology Imaging Equipment Market Value (US$ Mn) Forecast, by Product, 2017–2027
Table 22: Middle East & Africa Urology Imaging Equipment Market Value (US$ Mn) Forecast, by Application, 2017–2027
Table 23: Middle East & Africa Urology Imaging Equipment Market Value (US$ Mn) Forecast, by End-user, 2017–2027
Table 24: Middle East & Africa Urology Imaging Equipment Market Value (US$ Mn) Forecast, by Country/Sub-region, 2017–2027
List of Figures
Figure 01: Global Urology Imaging Equipment Market Value (US$ Mn) and Distribution (%), by Region, 2018 and 2027
Figure 02: Global Urology Imaging Equipment Market Value (US$ Mn), by Product, 2018
Figure 03: Global Urology Imaging Equipment Market Value Share Analysis, by Application, 2018
Figure 04: Market Overview
Figure 05: Global Urology Imaging Equipment Market Value Share, by Product, 2018
Figure 06: Global Urology Imaging Equipment Market Value Share, by Application, 2018
Figure 07: Global Urology Imaging Equipment Market Value Share, by End-user, 2018
Figure 09: Global Urology Imaging Equipment Market Value (US$ Mn) and Y-o-Y Growth (%) Forecast, 2017–2027
Figure 10: Global Urology Imaging Equipment Market Value Share Analysis, by Product, 2018 and 2027
Figure 11: Global Urology Imaging Equipment Market Value (US$ Mn) and Y-o-Y Growth, by Endovision Systems, 2017–2027
Figure 12: Global Urology Imaging Equipment Market Value (US$ Mn) and Y-o-Y Growth, by X-ray/Fluoroscopy Imaging Systems, 2017–2027
Figure 13: Global Urology Imaging Equipment Market Value (US$ Mn) and Y-o-Y Growth, by Urology Operating Tables, 2017–2027
Figure 14: Global Urology Imaging Equipment Market Value (US$ Mn) and Y-o-Y Growth, by Ultrasound Systems, 2017–2027
Figure 15: Global Urology Imaging Equipment Market Value (US$ Mn) and Y-o-Y Growth, by Others, 2017–2027
Figure 16: Global Urology Imaging Equipment Market Attractiveness Analysis, by Product, 2019–2027
Figure 17: Global Urology Imaging Equipment Market Value Share Analysis, by Application, 2018 and 2027
Figure 18: Global Urology Imaging Equipment Market Value (US$ Mn) and Y-o-Y Growth, by Diagnostics, 2017–2027
Figure 19: Global Urology Imaging Equipment Market Value (US$ Mn) and Y-o-Y Growth, by Interventional, 2017–2027
Figure 20: Global Urology Imaging Equipment Market Attractiveness Analysis, by Application, 2019–2027
Figure 21: Global Urology Imaging Equipment Market Value Share Analysis, by End-user, 2018 and 2027
Figure 22: Global Urology Imaging Equipment Market Value (US$ Mn) and Y-o-Y Growth, by Hospitals, 2017–2027
Figure 23: Global Urology Imaging Equipment Market Value (US$ Mn) and Y-o-Y Growth, by Ambulatory Surgical Centers, 2017–2027
Figure 24: Global Urology Imaging Equipment Market Value (US$ Mn) and Y-o-Y Growth, by Specialty Clinics, 2017–2027
Figure 25: Global Urology Imaging Equipment Market Attractiveness Analysis, by End-user, 2019–2027
Figure 26: Global Urology Imaging Equipment Market Value Share Analysis, by Region, 2018 and 2027
Figure 27: Global Urology Imaging Equipment Market Attractiveness Analysis, by Region, 2019–2027
Figure 28: North America Urology Imaging Equipment Market Value (US$ Mn) Forecast and Y-o-Y Growth (%) Projection, 2017–2027
Figure 29: North America Urology Imaging Equipment Market Value Share Analysis, by Product, 2018 and 2027
Figure 30: North America Urology Imaging Equipment Market Attractiveness Analysis, by Product, 2019–2027
Figure 31: North America Urology Imaging Equipment Market Value Share Analysis, by Application, 2018 and 2027
Figure 32: North America Urology Imaging Equipment Market Attractiveness Analysis, by Application, 2019–2027
Figure 33: North America Urology Imaging Equipment Market Value Share Analysis, by End-user, 2018 and 2027
Figure 34: North America Urology Imaging Equipment Market Attractiveness Analysis, by End-user, 2019 -2027
Figure 35: North America Urology Imaging Equipment Market Value Share Analysis, by Country, 2018 and 2027
Figure 36: North America Urology Imaging Equipment Market Attractiveness Analysis, by Country, 2019–2027
Figure 37: Europe Urology Imaging Equipment Market Value (US$ Mn) Forecast and Y-o-Y Growth (%) Projection, 2017–2027
Figure 38: Europe Urology Imaging Equipment Market Value Share Analysis, by Product, 2018 and 2027
Figure 39: Europe Urology Imaging Equipment Market Attractiveness Analysis, by Product, 2019–2027
Figure 40: Europe Urology Imaging Equipment Market Value Share Analysis, by Application, 2018 and 2027
Figure 41: Europe Urology Imaging Equipment Market Attractiveness Analysis, by Application, 2019–2027
Figure 42: Europe Urology Imaging Equipment Market Value Share Analysis, by End-user, 2018 and 2027
Figure 43: Europe Urology Imaging Equipment Market Attractiveness Analysis, by End-user, 2019 -2027
Figure 44: Europe Urology Imaging Equipment Market Value Share Analysis, by Country/Sub-region, 2018 and 2027
Figure 45: Europe Urology Imaging Equipment Market Attractiveness Analysis, by Country/Sub-region, 2019–2027
Figure 46: Asia Pacific Urology Imaging Equipment Market Value (US$ Mn) Forecast and Y-o-Y Growth (%) Projection, 2017–2027
Figure 47: Asia Pacific Urology Imaging Equipment Market Value Share Analysis, by Product, 2018 and 2027
Figure 48: Asia Pacific Urology Imaging Equipment Market Attractiveness Analysis, by Product, 2019–2027
Figure 49: Asia Pacific Urology Imaging Equipment Market Value Share Analysis, by Application, 2018 and 2027
Figure 50: Asia Pacific Urology Imaging Equipment Market Attractiveness Analysis, by Application, 2019–2027
Figure 51: Asia Pacific Urology Imaging Equipment Market Value Share Analysis, by End-user, 2018 and 2027
Figure 52: Asia Pacific Urology Imaging Equipment Market Attractiveness Analysis, by End-user, 2019–2027
Figure 53: Asia Pacific Urology Imaging Equipment Market Value Share Analysis, by Country/Sub-region, 2018 and 2027
Figure 54: Asia Pacific Urology Imaging Equipment Market Attractiveness Analysis, by Country/Sub-region, 2019–2027
Figure 55: Latin America Urology Imaging Equipment Market Value (US$ Mn) Forecast and Y-o-Y Growth (%) Projection, 2017–2027
Figure 56: Latin America Urology Imaging Equipment Market Value Share Analysis, by Product, 2018 and 2027
Figure 57: Latin America Urology Imaging Equipment Market Attractiveness Analysis, by Product, 2019–2027
Figure 58: Latin America Urology Imaging Equipment Market Value Share Analysis, by Application, 2018 and 2027
Figure 59: Latin America Urology Imaging Equipment Market Attractiveness Analysis, by Application, 2019–2027
Figure 60: Latin America Urology Imaging Equipment Market Value Share Analysis, by End-user, 2018 and 2027
Figure 61: Latin America Urology Imaging Equipment Market Attractiveness Analysis, by End-user, 2019 -2027
Figure 62: Latin America Urology Imaging Equipment Market Value Share Analysis, by Country/Sub-region, 2018 and 2027
Figure 63: Latin America Urology Imaging Equipment Market Attractiveness Analysis, by Country/Sub-region, 2019–2027
Figure 64: Middle East & Africa Urology Imaging Equipment Market Value (US$ Mn) Forecast and Y-o-Y Growth (%) Projection, 2017–2027
Figure 65: Middle East & Africa Urology Imaging Equipment Market Value Share Analysis, by Product, 2018 and 2027
Figure 66: Middle East & Africa Urology Imaging Equipment Market Attractiveness Analysis, by Product, 2019–2027
Figure 67: Middle East & Africa Urology Imaging Equipment Market Value Share Analysis, by Application, 2018 and 2027
Figure 68: Middle East & Africa Urology Imaging Equipment Market Attractiveness Analysis, by Application, 2019–2027
Figure 69: Middle East & Africa Urology Imaging Equipment Market Value Share Analysis, by End-user, 2018 and 2027
Figure 70: Middle East & Africa Urology Imaging Equipment Market Attractiveness Analysis, by End-user, 2019 -2027
Figure 71: Middle East & Africa Urology Imaging Equipment Market Value Share Analysis, by Country/Sub-region, 2018 and 2027
Figure 72: Middle East & Africa Urology Imaging Equipment Market Attractiveness Analysis, by Country/Sub-region, 2019–2027
Figure 73: Stryker Revenue (US$ Mn) and Y-o-Y Growth (%), 2015–2018
Figure 74: Stryker Breakdown of Net Sales (%), by Region/Country, 2018
Figure 75: Stryker Breakdown of Net Sales (%), by Business Segment (MedSurg), 2018
Figure 76: Stryker R&D Expenses (US$ Mn) and Y-o-Y Growth (%), 2015–2018
Figure 77: Olympus Corporation Revenue (US$ Mn) and Y-o-Y Growth (%) (Medical Business), 2016–2018
Figure 78: Olympus Corporation Breakdown of Net Sales (%), Medical Segment, by Region/Country, 2018
Figure 79: Olympus Corporation Breakdown of Net Sales (%), by Business Segment, 2018
Figure 80: Olympus Corporation R&D Expenses (US$ Mn) and Y-o-Y Growth (%), 2015–2018
Figure 81: Guerbet Revenue (US$ Mn) and Y-o-Y Growth (%), 2015–2018
Figure 82: Guerbet Breakdown of Net Sales (%), by Region/Country, 2018
Figure 83: Guerbet Breakdown of Net Sales (%), by Product Range, 2018
Figure 84: Guerbet R&D Expenses (US$ Mn) and Y-o-Y Growth (%), 2015–2018
Figure 85: GE Healthcare - Revenue (US$ Mn) and Y-o-Y Growth (%), 2016–2018
Figure 86: GE Healthcare - Breakdown of Net Sales (%), by Region/Country, 2018
Figure 87: GE Healthcare - Breakdown of Net Sales (%), by Segment, 2018
Figure 88: GE Healthcare - R&D Expenses (US$ Mn) and Y-o-Y Growth (%), 2016–2018
Figure 89: Siemens Healthineers - Revenue (US$ Mn) and Y-o-Y Growth (%), 2015–2018
Figure 90: Siemens Healthineers - Breakdown of Net Sales (%), by Region/Country, 2018
Figure 91: Siemens Healthineers - Revenue Breakdown of Net Sales (%), by Medical Device Business Unit, 2018
Figure 92: Siemens Healthineers - R&D Expenses (US$ Mn) and Y-o-Y Growth (%) by Medical Devices, 2017–2018
Figure 93: Medical System Revenue (US$ Mn) and Y-o-Y Growth (%), 2017–2018
Figure 94: Canon Medical Systems Corporation Breakdown of Net Sales (%), by Region/Country, 2018
Figure 95: Canon Medical Systems Corporation Breakdown of Net Sales (%), by Medical Device Business Unit, 2018
Figure 96: Medical Device Business - Operating cost and expenses (US$ Mn) and Y-o-Y Growth (%), 2016–2018
Figure 97: Koninklijke Philips N.V. Revenue (US$ Mn) and Y-o-Y Growth (%), 2015–2018
Figure 98: Koninklijke Philips N.V. Breakdown of Net Sales (%), by Region/Country, 2018
Figure 99: Koninklijke Philips N.V. Breakdown of Net Sales (%), by Business Segment, 2018
Figure 100: Koninklijke Philips N.V. R&D Expenses (US$ Mn) and Y-o-Y Growth (%), 2015–2018
Figure 101: Boston Scientific Corporation Revenue (US$ Mn) and Y-o-Y Growth (%), 2015–2018
Figure 102: Boston Scientific Corporation Breakdown of Net Sales (%), by Region/Country, 2018
Figure 103: Boston Scientific Corporation Breakdown of Net Sales (%), by Business Segment, 2018
Figure 104: Boston Scientific Corporation R&D Expenses (US$ Mn) and Y-o-Y Growth (%), 2015–2018
Copyright © Transparency Market Research, Inc. All Rights reserved
Trust Online

Urology Imaging Equipment Market