
Reports
Reports
A transfusion technology device is an electromechanical device that ensures the safety of a patient during blood transfusion and donation. Transfusion technology devices can be classified as apheresis system, blood component separators, cell expansion system, and auto transfusion devices. Apheresis is a procedure performed either for donation of a blood component or for treatment of a disease by removal of the diseased or disease-causing blood component. Whole blood is extracted from the donor or patient’s body, processed through the apheresis machine, and the desired blood components are separated based on their molecular weight, size, and affinity for particular substance, while the remaining blood is transfused back to the donor or patient. Multicomponent collection system, also known as blood component separator, is a device that processes and separates blood components. Automated cell expansion systems are used for the development of cells for cell therapy. Cell expansion is an important step in the manufacture of cell types. The automated cell expansion system is a closed cell bag bioreactor, which is used to culture the cell under controlled environmental condition with perfusion. The auto transfusion device is an electromechanical device that transfers the patient’s own blood during and after surgery. Rise in the incidence of chronic disorders among the geriatric population is likely to drive the need for safer transfusion devices and transfusion technology, which in turn is projected to propel the global transfusion technology market in the near future.
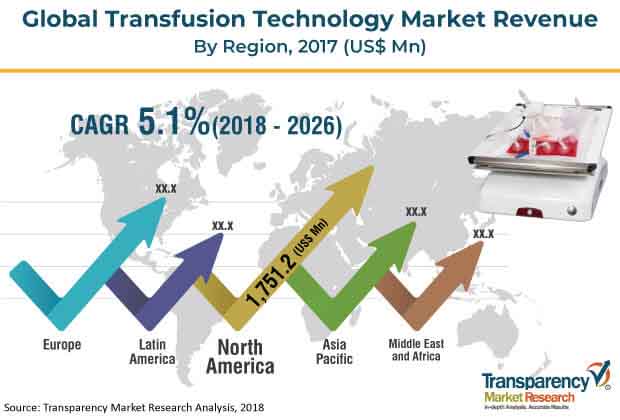
The global transfusion technology market is characterized by an increase in the incidence of chronic diseases across the world. The market is expanding at a rapid pace, due to implementation of government guidelines about safety of transfusion. The global transfusion technology market is projected to expand at a rapid pace from 2018 to 2026.
Increase in the geriatric population, which is prone to chronic diseases, large patient pool in developing countries requiring better health care facilities, and investments by public and private players in R&D on transfusion technology to ensure elimination of transfusion-associated infections and reduce the risk of transfusion reactions are key factors that are likely to drive the global transfusion technology market during the forecast period. However, lengthy procedure of obtaining regulatory approval, significant investments required in the innovation of transfusion technology, and increase in minimally invasive procedure that leads to low blood loss are likely to restrain the global market during the forecast period. Transfusion technology devices are gaining popularity among health care professionals, as these have proved to be effective in reducing transfusion reaction. Rising investments for innovation in transfusion technology and partnerships for co-development and commercialization of these devices are expected to fuel the global transfusion technology market in the near future.
In terms of product, the global transfusion technology market has been classified into instruments and disposables & consumables. The instruments segment has been further bifurcated into apheresis system & multicomponent collection systems, cell processing systems & cell expansion systems, auto transfusion devices, and others. The others segment includes tube sealing system, sterile tubing welder, mixer technology, and point of care hemoglobin meters. The cell processing systems & cell expansion systems segment is projected to dominate the market during the forecast period due to advancements in the treatment of cancer, such as cell therapy. The auto transfusion devices segment is projected to expand at a significant pace during the forecast period. Expansion of the segment can be attributed to the increase in adoption of auto transfusion devices, as the risk associated with transfusion of allogeneic blood is reduced in these devices. Moreover, presence of key companies engaged in R&D and manufacture of innovative and technologically advanced transfusion devices boosts the global market. Furthermore, initiatives by public and private organizations that are aimed at spreading awareness about advantages of blood donation among people have led to a rise in the number of donors. The relatively stable growth rate of the instrument segment can be ascribed to the ‘as it is a capital investment’ in developing countries and stringent regulations regarding manufacture and approval. The disposable & consumables segment is anticipated to expand at an above-average growth rate during the forecast period, due to the high use of these transfusion technology devices by end-users. This is due to the implementation of stringent guidelines by government organizations to reduce the prevalence of transfusion-associated infection. Apheresis devices are predominantly utilized in hospitals and public & private blood banks for blood donation. End-users are increasingly preferring apheresis devices and multicomponent collection systems due to a rise in the demand for therapeutic apheresis.
Based on end-user, the global transfusion technology market has been classified into hospitals, blood bank, biotechnology & pharmaceutical companies, and others. The blood banks segment is expected to dominate the global transfusion technology market during the forecast period. In terms of region, the global transfusion technology market has been segmented into North America, Europe, Asia Pacific, Latin America, and Middle East & Africa. North America accounted for a major share of the global market in 2017. Europe was another significant market for transfusion technology devices in 2017. Developed health care infrastructure, high rate of adoption of technologies, and relatively high paying capacity of patients in North America and Europe, as compared to those in developing countries, offer growth opportunities to new market entrants. This led the regions to hold a high share in the global market. Considerable expansion of the medical industry in India and China and investments made by global companies in Asia Pacific for establishment of sales subsidiaries, in order to provide support and services to existing customers and attract new customers, are expected to propel the transfusion technology market in Asia Pacific in the next few years.
Major players operating in the global transfusion technology market are Haemonetics Corporation, Inc., Medtronic plc, Asahi Kasei Medical Co., Ltd., B. Braun Melsungen AG, Cerus Corporation, Fresenius Kabi AG (Fresenius SE & Co. KGaA), GE Healthcare, Miltenyi Biotec, TERUMO BCT, and LivaNova PLC.
1. Preface
1.1. Market Definition and Scope
1.2. Market Segmentation
1.3. Key Research Objectives
1.4. Research Highlights
2. Assumptions and Research Methodology
3. Executive Summary : Global Transfusion Technology
4. Market Overview
4.1. Introduction
4.1.1. Product Definition
4.1.2. Industry Evolution / Developments
4.2. Overview
4.3. Market Dynamics
4.3.1. Drivers
4.3.2. Restraints
4.3.3. Opportunities
4.4. Global Transfusion Technology Market Analysis and Forecast, 2016–2026
4.4.1. Market Revenue Projections (US$ Mn)
4.5. Porter’s Five Force Analysis
5. Market Outlook
5.1. Technological Advancement in Apheresis System & Multi-Component Separator Systems
5.2. Key Trends of Transfusion Technology
6. Global Transfusion Technology Analysis and Forecast, by Product
6.1. Introduction & Definition
6.2. Key Findings / Developments
6.3. Global Transfusion Technology Market Value Forecast, by Product, 2016–2026
6.3.1. Instruments
6.3.1.1. Apheresis System & Multicomponent Collection Systems
6.3.1.2. Cell Processing Systems & Cell Expansion Systems
6.3.1.3. Auto Transfusion Devices
6.3.1.4. Others
6.3.2. Disposables & Consumables
6.4. Global Transfusion Technology Market Attractiveness, by Product
7. Global Transfusion Technology Market Analysis and Forecast, by End-user
7.1. Introduction & Definition
7.2. Key Findings / Developments
7.3. Global Transfusion Technology Market Value Forecast, by End-user, 2016–2026
7.3.1. Hospitals
7.3.2. Blood Banks
7.3.3. Biotechnology & Pharmaceutical Companies
7.3.4. Others
7.4. Global Transfusion Technology Market Attractiveness, by End-user
8. Global Transfusion Technology Analysis and Forecast, by Region
8.1. Key Findings
8.2. Global Transfusion Technology Market Value Forecast, by Region
8.2.1. North America
8.2.2. Europe
8.2.3. Asia Pacific
8.2.4. Latin America
8.2.5. Middle East & Africa
8.3. Global Transfusion Technology Market Attractiveness, by Region
9. North America Transfusion Technology Analysis and Forecast
9.1. Introduction
9.1.1. Key Findings
9.2. North America Transfusion Technology Market Value Forecast, by Product, 2016–2026
9.2.1. Instruments
9.2.1.1. Apheresis System & Multicomponent Collection Systems
9.2.1.2. Cell Processing Systems & Cell Expansion Systems
9.2.1.3. Auto Transfusion Devices
9.2.1.4. Others
9.2.2. Disposables & Consumables
9.3. North America Transfusion Technology Market Value Forecast, by End-user, 2016–2026
9.3.1. Hospitals
9.3.2. Blood Banks
9.3.3. Biotechnology & Pharmaceutical Companies
9.3.4. Others
9.4. North America Transfusion Technology Market Value Forecast, by Country, 2016–2026
9.4.1. U.S.
9.4.2. Canada
9.5. North America Transfusion Technology Market Attractiveness Analysis
9.5.1. By Product
9.5.2. By End-user
9.5.3. By Country
10. Europe Transfusion Technology Analysis and Forecast
10.1. Introduction
10.1.1. Key Findings
10.2. Europe Transfusion Technology Market Value Forecast, by Product, 2016–2026
10.2.1. Instruments
10.2.1.1. Apheresis System & Multicomponent Collection Systems
10.2.1.2. Cell Processing Systems & Cell Expansion Systems
10.2.1.3. Auto Transfusion Devices
10.2.1.4. Others
10.2.2. Disposables & Consumables
10.3. Europe Transfusion Technology Market Value Forecast, by End-user, 2016–2026
10.3.1. Hospitals
10.3.2. Blood Banks
10.3.3. Biotechnology & Pharmaceutical Companies
10.3.4. Others
10.4. Europe Transfusion Technology Market Value Forecast, by Country/Sub-region, 2016–2026
10.4.1. Germany
10.4.2. U.K.
10.4.3. France
10.4.4. Spain
10.4.5. Italy
10.4.6. Rest of Europe
10.5. Europe Transfusion Technology Market Attractiveness Analysis
10.5.1. By Product
10.5.2. By End-user
10.5.3. By Country/Sub-region
11. Asia Pacific Transfusion Technology Analysis and Forecast
11.1. Introduction
11.1.1. Key Findings
11.2. Asia Pacific Transfusion Technology Market Value Forecast, by Product, 2016–2026
11.2.1. Instruments
11.2.1.1. Apheresis System & Multicomponent Collection Systems
11.2.1.2. Cell Processing Systems & Cell Expansion Systems
11.2.1.3. Auto Transfusion Devices
11.2.1.4. Others
11.2.2. Disposables & Consumables
11.3. Asia Pacific Transfusion Technology Market Value Forecast, by End-user, 2016–2026
11.3.1. Hospitals
11.3.2. Blood Banks
11.3.3. Biotechnology & Pharmaceutical Companies
11.3.4. Others
11.4. Asia Pacific Transfusion Technology Market Value Forecast, by Country/Sub-region, 2016–2026
11.4.1. China
11.4.2. Japan
11.4.3. India
11.4.4. Australia & New Zealand
11.4.5. Rest of Asia Pacific
11.5. Asia Pacific Transfusion Technology Market Attractiveness Analysis
11.5.1. By Product
11.5.2. By End-user
11.5.3. By Country/Sub-region
12. Latin America Transfusion Technology Analysis and Forecast
12.1. Introduction
12.1.1. Key Findings
12.2. Latin America Transfusion Technology Market Value Forecast, by Product, 2016–2026
12.2.1. Instruments
12.2.1.1. Apheresis System & Multicomponent Collection Systems
12.2.1.2. Cell Processing Systems & Cell Expansion Systems
12.2.1.3. Auto Transfusion Devices
12.2.1.4. Others
12.2.2. Disposables & Consumables
12.3. Latin America Transfusion Technology Market Value Forecast, by End-user, 2016–2026
12.3.1. Hospitals
12.3.2. Blood Banks
12.3.3. Biotechnology & Pharmaceutical Companies
12.3.4. Others
12.4. Latin America Transfusion Technology Market Value Forecast, by Country/Sub-region, 2016–2026
12.4.1. Brazil
12.4.2. Mexico
12.4.3. Rest of Latin America
12.5. Latin America Transfusion Technology Market Attractiveness Analysis
12.5.1. By Product
12.5.2. By End-user
12.5.3. By Country/Sub-region
13. Middle East & Africa Transfusion Technology Analysis and Forecast
13.1. Introduction
13.1.1. Key Findings
13.2. Middle East & Africa Transfusion Technology Market Value Forecast, by Product, 2016–2026
13.2.1. Instruments
13.2.1.1. Apheresis System & Multicomponent Collection Systems
13.2.1.2. Cell Processing Systems & Cell Expansion Systems
13.2.1.3. Auto Transfusion Devices
13.2.1.4. Others
13.2.2. Disposables & Consumables
13.3. Middle East & Africa Transfusion Technology Market Value Forecast, by End-user, 2016–2026
13.3.1. Hospitals
13.3.2. Blood Banks
13.3.3. Biotechnology & Pharmaceutical Companies
13.3.4. Others
13.4. Middle East & Africa Transfusion Technology Market Value Forecast, by Country/Sub-region, 2016–2026
13.4.1. GCC Countries
13.4.2. South Africa
13.4.3. Rest of Middle East & Africa
13.5. Middle East & Africa Transfusion Technology Market Attractiveness Analysis
13.5.1. By Product
13.5.2. By End-user
13.5.3. By Country/Sub-region
14. Competition Landscape
14.1. Market Player – Competition Matrix (By Tier and Size of companies)
14.2. Company Profiles
14.2.1. General Electric Healthcare
14.2.1.1. Company Overview (HQ, Business Segments, Employee Strength)
14.2.1.2. Product Portfolio
14.2.1.3. SWOT Analysis
14.2.1.4. Strategic Overview
14.2.1.5. Financial Overview
14.2.2. Haemonetics Corporation
14.2.2.1. Company Overview (HQ, Business Segments, Employee Strength)
14.2.1.2. Product Portfolio
14.2.2.3. SWOT Analysis
14.2.2.4. Strategic Overview
14.2.2.5. Financial Overview
14.2.3. TERUMO BCT
14.2.3.1. Company Overview (HQ, Business Segments, Employee Strength)
14.2.3.2. Product Portfolio
14.2.3.3. SWOT Analysis
14.2.3.4. Strategic Overview
14.2.3.5. Financial Overview
14.2.4. B. Braun Melsungen AG
14.2.4.1. Company Overview (HQ, Business Segments, Employee Strength)
14.2.4.2. Product Portfolio
14.2.4.3. SWOT Analysis
14.2.4.4. Strategic Overview
14.2.4.5. Financial Overview
14.2.5. Fresenius Kabi AG
14.2.5.1. Company Overview (HQ, Business Segments, Employee Strength)
14.2.5.2. Product Portfolio
14.2.5.3. SWOT Analysis
14.2.5.4. Strategic Overview
14.2.5.5. Financial Overview
14.2.6. Medtronic
14.2.6.1. Company Overview (HQ, Business Segments, Employee Strength)
14.2.6.2. Product Portfolio
14.2.6.3. SWOT Analysis
14.2.6.4. Strategic Overview
14.2.6.5. Financial Overview
14.2.7. LivaNova PLC
14.2.7.1. Company Overview (HQ, Business Segments, Employee Strength)
14.2.7.2. Product Portfolio
14.2.7.3. SWOT Analysis
14.2.7.4. Strategic Overview
14.2.7.5. Financial Overview
14.2.8. Kawasumi Laboratories Inc.
14.2.8.1. Company Overview (HQ, Business Segments, Employee Strength)
14.2.8.2. Product Portfolio
14.2.8.3. SWOT Analysis
14.2.8.4. Strategic Overview
14.2.8.5. Financial Overview
14.2.9. Lmb Technologie GmbH
14.2.9.1. Company Overview (HQ, Business Segments, Employee Strength)
14.2.9.2. Product Portfolio
14.2.9.3. SWOT Analysis
14.2.9.4. Strategic Overview
14.2.9.5. Financial Overview
14.2.10. Miltenyi Biotec
14.2.10.1. Company Overview (HQ, Business Segments, Employee Strength)
14.2.10.2. Product Portfolio
14.2.10.3. SWOT Analysis
14.2.10.4. Strategic Overview
14.2.10.5. Financial Overview
14.2.11. Asahi Kasei Medical Co., Ltd.
14.2.11.1. Company Overview (HQ, Business Segments, Employee Strength)
14.2.11.2. Product Portfolio
14.2.11.3. SWOT Analysis
14.2.11.4. Strategic Overview
14.2.11.5. Financial Overview
14.2.12. Cerus Corporation
14.2.12.1. Company Overview (HQ, Business Segments, Employee Strength)
14.2.12.2. Product Portfolio
14.2.12.3. SWOT Analysis
14.2.12.4. Strategic Overview
14.2.12.5. Financial Overview
List of Tables
Table 1: Global Transfusion Technology Market Value (US$ Mn) Forecast, by Product, 2016–2026
Table 2: Global Transfusion Technology Market Value (US$ Mn) Forecast, by Product (Instruments), 2016–2026
Table 3: Global Transfusion Technology Market Value (US$ Mn) Forecast, by End-user, 2015–2026
Table 4: Global Transfusion Technology Market Value (US$ Mn) Forecast, by Region, 2017–2026
Table 5: North America Transfusion Technology Market Value (US$ Mn) Forecast, by Country, 2016–2026
Table 6: North America Transfusion Technology Market Value (US$ Mn) Forecast, by Product, 2016–2026
Table 7: North America Transfusion Technology Market Value (US$ Mn) Forecast, by Product (Instruments), 2016–2026
Table 8: North America Transfusion Technology Market Value (US$ Mn) Forecast, by End-user, 2016–2026
Table 9: Europe Transfusion Technology Market Value (US$ Mn) Forecast, by Country/Sub-region, 2016–2026
Table 10: Europe Transfusion Technology Market Value (US$ Mn) Forecast, by Product, 2016–2026
Table 11: Europe Transfusion Technology Market Value (US$ Mn) Forecast, by Product (Instruments), 2016–2026
Table 12: Europe Transfusion Technology Market Value (US$ Mn) Forecast, by End-user, 2016–2026
Table 13: Asia Pacific Transfusion Technology Market Value (US$ Mn) Forecast, by Country/Sub-region, 2016?2026
Table 14: Asia Pacific Transfusion Technology Market Value (US$ Mn) Forecast, by Product, 2016?2026
Table 15: Asia Pacific Transfusion Technology Market Value (US$ Mn) Forecast, by Product (Instruments), 2016–2026
Table 16: Asia Pacific Transfusion Technology Market Value (US$ Mn) Forecast, by End-user, 2016?2026
Table 17: Latin America Transfusion Technology Market Value (US$ Mn) Forecast, by Country/Sub-region, 2016?2026
Table 18: Latin America Transfusion Technology Market Value (US$ Mn) Forecast, by Product, 2016?2026
Table 19: Latin America Transfusion Technology Market Value (US$ Mn) Forecast, by Product (Instruments), 2016–2026
Table 20: Latin America Transfusion Technology Market Value (US$ Mn) Forecast, by End-user, 2016?2026
Table 21: Middle East & Africa Transfusion Technology Market Value (US$ Mn) Forecast, by Country/Sub-region, 2016–2026
Table 22: Middle East & Africa Transfusion Technology Market Value (US$ Mn) Forecast, by Product, 2016–2026
Table 23: Middle East & Africa Transfusion Technology Market Value (US$ Mn) Forecast, by Product (Instruments), 2016–2026
Table 24: Middle East & Africa Transfusion Technology Market Value (US$ Mn) Forecast, by End-user, 2016–2026
List of Figures
Figure 1: Global Transfusion Technology Market Value (US$ Mn) and Distribution, by Geography, 2017 and 2026
Figure 2: Global Transfusion Technology Market Value (US$ Mn) Analysis, by Product, 2017
Figure 3: Global Transfusion Technology Market Value (US$ Mn) Analysis, by Instruments, 2017
Figure 4: Global Transfusion Technology Market Value (US$ Mn) Analysis, by End-user, 2017
Figure 5: Global Transfusion Technology Market Value (US$ Mn) Analysis, by Key Segment and Market Share (%), 2017
Figure 6: Global Transfusion Technology, Market Opportunity Map, by Product
Figure 7: Global Transfusion Technology, Market Opportunity Map, by Instrument
Figure 8: Global Transfusion Technology, Market Opportunity Map, by End-user
Figure 9: Key Industry Evolution/Developments
Figure 10: Global Transfusion Technology Market Value (US$ Mn) Forecast and Y-o-Y Growth (%) Projection, 2016-2026
Figure 11: Porter’s Five Force Analysis
Figure 12: Value Chain Analysis
Figure 13: Global Transfusion Technology Market Value Share, by Product (2017)
Figure 14: Global Transfusion Technology Market Value Share, by Region (2017)
Figure 15: Global Transfusion Technology Market Value Share, by End-user (2017)
Figure 16: Global Transfusion Technology Market Value Share Analysis, by Product, 2017 and 2026
Figure 17: Global Transfusion Technology Market Value (US$ Mn) and Y-o-Y Growth (%), by Instruments, 2016–2026
Figure 18: Global Transfusion Technology Market Value (US$ Mn) and Y-o-Y Growth (%), by Disposables & Consumables, 2016–2026
Figure 19: Global Transfusion Technology Market Value (US$ Mn) and Y-o-Y Growth (%), by Apheresis System & Multicomponent Collection Systems, 2016–2026
Figure 20: Global Transfusion Technology Market Value (US$ Mn) and Y-o-Y Growth (%), by Cell Processing Systems & Cell Expansion Systems, 2016–2026
Figure 21: Global Transfusion Technology Market Value (US$ Mn) and Y-o-Y Growth (%), by Auto Transfusion Devices, 2016–2026
Figure 22: Global Transfusion Technology Market Value (US$ Mn) and Y-o-Y Growth (%), by Others, 2016–2026
Figure 23: Global Transfusion Technology Market Attractiveness Analysis, by Product, 2018-2026
Figure 24: Global Transfusion Technology Market Value Share, by End-user, 2017 and 2026
Figure 25: Global Transfusion Technology Market Value (US$ Mn) and Y-o-Y Growth (%), by Hospitals 2016–2026
Figure 26: Global Transfusion Technology Market Value (US$ Mn) and Y-o-Y Growth (%), by Blood Banks, 2016–2026
Figure 27: Global Transfusion Technology Market Value (US$ Mn) and Y-o-Y Growth (%), by Biotechnology & Pharmaceutical Companies, 2016–2026
Figure 28: Global Transfusion Technology Market Value (US$ Mn) and Y-o-Y Growth (%), by Others, 2016–2026
Figure 29: Global Transfusion Technology Market Attractiveness, by End-user, 2017
Figure 30: Global Transfusion Technology Market Scenario
Figure 31: Global Transfusion Technology Market Value Share Analysis, by Region, 2018 and 2026
Figure 32: Transfusion Technology Market Attractiveness Analysis, by Region
Figure 33: North America Transfusion Technology Market Value (US$ Mn) Forecast and Y-o-Y Growth (%) Projection, 2016–2026
Figure 34: North America Transfusion Technology Market Value Share, by Country, 2017 and 2026
Figure 35: North America Transfusion Technology Market Attractiveness, by Country, 2018–2026
Figure 36: North America Transfusion Technology Market Value Share, by Product, 2017 and 2026
Figure 37: North America Transfusion Technology Market Attractiveness, by Product, 2018–2026
Figure 38: North America Transfusion Technology Market Value Share, by End-user, 2017 and 2026
Figure 39: North America Transfusion Technology Market Attractiveness, by End-user, 2018–2026
Figure 40: Europe Transfusion Technology Market Value (US$ Mn) Forecast and Y-o-Y Growth (%) Projection, 2016–2026
Figure 41: Europe Transfusion Technology Market Value Share, by Country/Sub-region, 2017 and 2026
Figure 42: Europe Transfusion Technology Market Attractiveness, by Country/Sub-region, 2018–2026
Figure 43: Europe Transfusion Technology Market Value Share, by Product, 2017 and 2026
Figure 44: Europe Transfusion Technology Market Attractiveness, by Product, 2018–2026
Figure 45: Europe Transfusion Technology Market Value Share, by End-user, 2017 and 2026
Figure 46: Europe Transfusion Technology Market Attractiveness, by End-user, 2018–2026
Figure 47: Asia Pacific Transfusion Technology Market Value (US$ Mn) Forecast and Y-o-Y Growth (%) Projection, 2016?2026
Figure 48: Asia Pacific Transfusion Technology Market Value Share, by Country/Sub-region, 2017 and 2026
Figure 49: Asia Pacific Transfusion Technology Market Attractiveness, by Country/Sub-region, 2018?2026
Figure 50: Asia Pacific Transfusion Technology Market Value Share, by Product, 2017 and 2026
Figure 51: Asia Pacific Transfusion Technology Market Attractiveness, by Product, 2018?2026
Figure 52: Asia Pacific Transfusion Technology Market Value Share, by End-user, 2017 and 2026
Figure 53: Asia Pacific Transfusion Technology Market Attractiveness, by End-user, 2018?2026
Figure 54: Latin America Transfusion Technology Market Value (US$ Mn) Forecast and Y-o-Y Growth (%) Projection, 2016?2026
Figure 55: Latin America Transfusion Technology Market Value Share, by Country/Sub-region, 2017 and 2026
Figure 56: Latin America Transfusion Technology Market Attractiveness, by Country/Sub-region, 2018?2026
Figure 57: Latin America Transfusion Technology Market Value Share, by Product, 2017 and 2026
Figure 58: Latin America Transfusion Technology Market Attractiveness, by Product, 2018?2026
Figure 59: Latin America Transfusion Technology Market Value Share, by End-user, 2017 and 2026
Figure 60: Latin America Transfusion Technology Market Attractiveness, by End-user, 2018?2026
Figure 61: Middle East & Africa Transfusion Technology Market Value (US$ Mn) Forecast and Y-o-Y Growth (%) Projection, 2016–2026
Figure 62: Middle East & Africa Transfusion Technology Market Value Share, by Country/Sub-region, 2017 and 2026
Figure 63: Middle East & Africa Transfusion Technology Market Attractiveness, by Country/Sub-region, 2018–2026
Figure 64: Middle East & Africa Transfusion Technology Market Value Share, by Product, 2017 and 2026
Figure 65: Middle East & Africa Transfusion Technology Market Attractiveness, by Product, 2018–2026
Figure 66: Middle East & Africa Transfusion Technology Market Value Share, by End-user, 2017 and 2026
Figure 67: Middle East & Africa Transfusion Technology Market Attractiveness, by End-user, 2018–2026
Figure 68: Haemonetics Corporation Revenue (US$ Mn) and Y-o-Y Growth (%), 2013–2017
Figure 69: Haemonetics Corporation Research and Development Expenses, 2013-2017
Figure 70: Haemonetics Corporation Breakdown of Net Sales (% Share), by Business Segment (2017)
Figure 71: Haemonetics Corporation Breakdown of Net Sales (% Share), by Region (2017)
Figure 72: Medtronic plc. Revenue (US$ Mn) and Y-o-Y Growth (%), 2013–2017
Figure 73: Medtronic plc. Operating Profit (US$ Mn) and Y-o-Y Growth (%), 2015–2017
Figure 74: Medtronic plc. Gross Profit (US$ Mn) and Y-o-Y Growth (%), 2015–2017
Figure 75: Medtronic plc. Breakdown of Net Sales (%), by Region, 2017
Figure 76: Medtronic plc. Breakdown of Customers (%), by Segment, 2017
Figure 77: Asahi Kasei Medical Co., Ltd. Revenue (US$ Mn) and Y-o-Y Growth (%), 2013–2017
Figure 78: Asahi Kasei Medical Co., Ltd. Research and Development Expenses, 2013-2017
Figure 79: Asahi Kasei Medical Co., Ltd. Breakdown of Net Sales (% Share), by Business Segment (2017)
Figure 80: Asahi Kasei Medical Co., Ltd. Breakdown of Net Sales (% Share), by Region (2017)
Figure 81: Asahi Kasei Medical Co., Ltd. Healthcare Segment Revenue (US$ Mn) and Y-o-Y Growth (%), 2013–2017
Figure 82: B. Braun Melsungen AG Revenue (US$ Mn) & Y-o-Y Growth (%), 2014–2017
Figure 83: B. Braun Melsungen AG R&D Expenses (US$ Mn) and Y-o-Y Growth (%), 2014–2017
Figure 84: B. Braun Melsungen AG Breakdown of Net Sales, by Business Segment, 2017
Figure 85: B. Braun Melsungen AG Breakdown of Net Sales, by Region, 2017
Figure 86: Fresenius Kabi AG (Fresenius SE & Co. KGaA) Revenue (US$ Mn) and Y-o-Y Growth (%), 2013–2017
Figure 87: Fresenius Kabi AG (Fresenius SE & Co. KGaA) Research and Development Expenses, 2013-2017
Figure 88: Fresenius Kabi AG (Fresenius SE & Co. KGaA) Breakdown of Net Sales (% Share), by Business Segment (2017)
Figure 89: Fresenius Kabi AG (Fresenius SE & Co. KGaA) Breakdown of Net Sales (% Share), by Region (2017)
Figure 90: TERUMO CORPORATION Revenue (US$ Mn) and Y-o-Y Growth (%), 2013–2017
Figure 91: TERUMO CORPORATION Research and Development Expenses, 2013-2017
Figure 92: TERUMO CORPORATION Breakdown of Net Sales (% Share), by Business Segment (2017)
Figure 93: TERUMO CORPORATION Breakdown of Net Sales (% Share), by Region (2017)
Copyright © Transparency Market Research, Inc. All Rights reserved
Trust Online

Transfusion Technology Market Insights, 2018-2026