
Reports
Reports
The implementation of 5G wireless is anticipated to deliver new services in high-speed optical networks such as augmented reality and industrial IoT. As such, optical transceivers are projected to dominate the transceiver market with the highest revenue, estimated at a record ~US$ 36.8 billion by the end of 2027. Hence, manufacturers in the transceiver market are tapping into opportunities in machine learning, and the development of advanced drones and self-driving vehicles. The growing demand for 5G is catalyzing the demand for high-speed optical connectivity in cloud data centers.
On the other hand, manufacturers are innovating in new optical transceiver chiplets to integrate lasers with electro-photonic silicon chips. For instance, in September 2019, ADVA - a telecommunications company, announced the developing of novel optical transceiver chiplets to cater to the increasing demand for bandwidth in data center interconnect networks.
Companies in the transceiver market are adopting quantum dot technology to create compact-size devices. They are increasing focus on developing miniaturized optical transceivers that are cost-effective and support transmitter-receiver optical sub-assemblies for inter-data center applications.
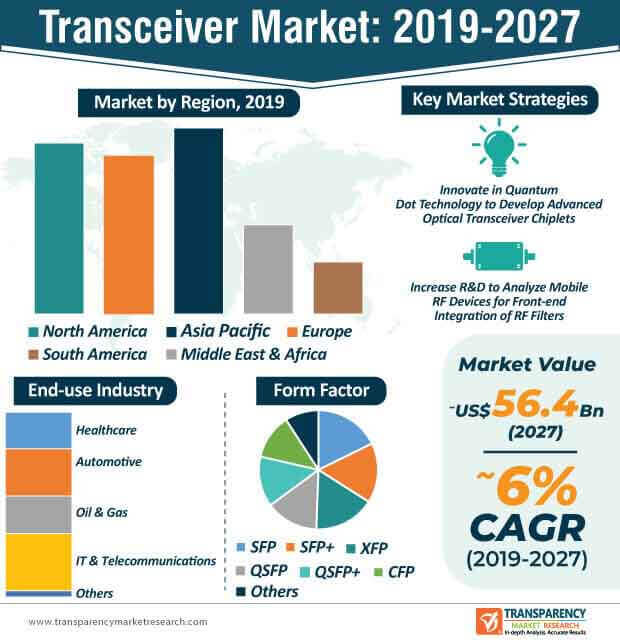
The transceiver market is estimated to witness growth in electronic warfare and other applications. There is growing demand for transceivers that offer flexibility in electronic warfare (EW) systems. Companies in the transceiver market are introducing new wideband microwave transceivers that offer immediate-frequency bandwidth in RF (radio frequency) modules. Innovations in wideband microwave transceivers are benefitting stakeholders in the defense landscape by helping them deploy spectrum monitoring and beamforming in EW systems.
Companies are increasing research efforts to maximize system flexibility by developing transceivers that integrate with multiple interfaces. They are increasing R&D to analyze mobile RF front-end architectures of smartphones to support global LTE (long term evolution) standards in the IT and telecommunications landscape. As such, IT and telecommunications accounts for the highest sale of transceivers, and is estimated to reach a value of ~US$ 12.7 billion by 2022, in the transceiver market.
Manufacturers are onboarding the best researchers to develop transceivers that offer quality communications and cost-efficient scalability. They are increasing production capacities to develop advanced transceivers that transform 5G wireless equipment, such as smartphones and tablets, and are being increasingly used in IoT applications. Companies are introducing new frequency bands in transceivers that support 5G applications.
There is growing demand for tunable devices in the rapidly expanding networking technology landscape. Manufacturers are innovating cutting-edge technology that provides on-site wavelength adjustment in tunable transceivers. Static transceivers require multiple backups to reduce downtime in the DWDM (dense wavelength division multiplexing) space. Hence, tunable transceivers are an efficient alternative to their static counterparts, since the former offer more flexibility in optical networking.
The burgeoning growth of networking technology is triggering the sales of tunable transceivers in the global transceiver market. However, tunable transceivers cost more than static transceivers. Tunable transceiver technology also presents a challenge for operators attempting to interface tunable transceivers with legacy equipment. To win over these limitations, companies are introducing transceiver management modules, AKA tuning boxes, to host tunable transceivers in various DWDM environments. The efficacy of tuning boxes is leveraged with the help of tuning software to reinforce on-the-go tuning through proprietary mobile tuning applications.
The automotive industry accounts for the second-highest revenue amongst all end-use industries in the transceiver market that require technologically-advanced transceivers. Companies in the landscape are developing new Ethernet PHY (physical layer) transceivers that are standard-complaint and interoperable in automotive technology. These efforts are being made to offer sleep and wake-up-forwarding functionality in vehicles.
Ethernet PHY transceivers are helping automotive manufacturers reach their end goal of high efficiency in future electric vehicle architectures. Besides car brands such as BMW, JLR, and VW, automotive manufacturers are augmenting the application of Ethernet in infotainment, telematics, and ADAS (advanced driver-assistance systems) for other automobile companies. The trend of connected cars is further catalyzing market growth.
Analysts’ Viewpoint
Analysts of the transceiver market opine that, optical transceivers are gaining far-reaching applications in networking and IT applications. SFP+ transceivers are predicted to account for the highest revenue amongst all form factors in the market landscape. Hence, manufacturers are innovating in new interfaces of tunable transceiver technology that complement well with tunable SFP+ transceivers.
However, challenges of base station receiver design pose a hurdle to manufacturers. Hence, they should develop novel integrated transceivers that offer desired sensitivity under specific conditions in base station receiver designs. Manufacturers should capitalize on the trend of 5G wireless to develop built-in gain phase calibration that minimizes radiation and boosts signal strength in devices.
Global Transceiver Market: Overview
Rapid Expansion of Data Centers: A Key Transceiver Market Driver
Rising Demand of Optical Transceivers: Latest Trend in Transceiver Market
Testing of Transceivers: Major Challenge for Global Transceiver Market
Global Transceiver Market: Competition Landscape
Global Transceiver Market: Key Developments
In the report on the global transceiver market, we have discussed individual strategies, followed by company profiles of providers of transceivers. The ‘Competition Landscape’ section of the global transceiver market has been included in the report to provide readers with a dashboard view and market share analysis of key players operating in the global transceiver market.
1. Preface
1.1. Market Definition and Scope
1.2. Market Segmentation
1.3. Key Research Objectives
1.4. Research Highlights
2. Assumptions and Research Methodology
3. Executive Summary: Global Transceiver Market
4. Market Overview
4.1. Introduction
4.2. Market Dynamics
4.2.1. Drivers
4.2.2. Restraints
4.2.3. Opportunities
4.3. Key Trends Analysis
4.4. Global Transceiver Market Analysis and Forecast, 2017–2027
4.4.1. Market Revenue Projection (US$ Mn)
4.4.2. Market Volume Projection (Million Units)
4.5. Porter’s Five Forces Analysis - Global Transceiver Market
4.6. Value Chain Analysis - Global Transceiver Market
4.7. Market Outlook
5. Global Transceiver Market Analysis and Forecast, by Type
5.1. Overview & Definitions
5.2. Global Transceiver Market Size (US$ Mn and Units) Forecast, by Type, 2017–2027
5.2.1. RF Transceivers
5.2.2. Optical Transceivers
5.2.3. Ethernet Transceivers
5.2.4. CAN Transceivers
5.2.5. Others
5.3. Type Comparison Matrix
5.4. Global Transceiver Market Attractiveness, by Type
6. Global Transceiver Market Analysis and Forecast, by Form Factor
6.1. Overview & Definition
6.2. Global Transceiver Market Revenue (US$ Mn) Forecast, by Form Factor, 2017–2027
6.2.1. SFP
6.2.2. SFP+
6.2.3. XFP
6.2.4. QSFP
6.2.5. QSFP+
6.2.6. CFP
6.2.7. Others
6.3. Form Factor Comparison Matrix
6.4. Global Transceiver Market Attractiveness, by Form Factor
7. Global Transceiver Market Analysis and Forecast, by End-use Industry
7.1. Overview & Definitions
7.2. Global Transceiver Market Revenue (US$ Mn) Forecast, by End-use Industry, 2017–2027
7.2.1. Healthcare
7.2.2. Automotive
7.2.3. Retail
7.2.4. IT & Telecommunication
7.2.5. Others
7.3. End-use Industry Comparison Matrix
7.4. Global Transceiver Market Attractiveness, by End-use Industry
8. Global Transceiver Market Analysis and Forecast, by Region
8.1. Key Findings
8.2. Regulations and Policies
8.3. Global Transceiver Market Revenue (US$ Mn) Forecast, by Region, 2017–2027
8.3.1. North America
8.3.2. Europe
8.3.3. Asia Pacific
8.3.4. Middle East & Africa
8.3.5. South America
8.4. Global Transceiver Market Attractiveness, by Region
9. North America Transceiver Market Analysis and Forecast
9.1. Key Findings
9.2. Key Trends
9.3. North America Transceiver Market Size (US$ Mn and Units) Forecast, by Type, 2017–2027
9.3.1. RF Transceivers
9.3.2. Optical Transceivers
9.3.3. Ethernet Transceivers
9.3.4. CAN Transceivers
9.3.5. Others
9.4. North America Transceiver Market Revenue (US$ Mn) Forecast, by Form Factor, 2017–2027
9.4.1. SFP
9.4.2. SFP+
9.4.3. XFP
9.4.4. QSFP
9.4.5. QSFP+
9.4.6. CFP
9.4.7. Others
9.5. North America Transceiver Market Revenue (US$ Mn) Forecast, by End-use Industry, 2017–2027
9.5.1. Healthcare
9.5.2. Automotive
9.5.3. Retail
9.5.4. IT & Telecommunication
9.5.5. Others
9.6. North America Transceiver Market Revenue (US$ Mn) Forecast, by Country/Sub-region, 2017–2027
9.6.1. U.S.
9.6.2. Canada
9.6.3. Rest of North America
9.7. North America Transceiver Market Attractiveness Analysis
9.7.1. By Type
9.7.2. By Form Factor
9.7.3. By End-use Industry
9.7.4. By Country/Sub-region
10. Europe Transceiver Market Analysis and Forecast
10.1. Key Findings
10.2. Key Trends
10.3. Europe Transceiver Market Size (US$ Mn and Units) Forecast, by Type, 2017–2027
10.3.1. RF Transceivers
10.3.2. Optical Transceivers
10.3.3. Ethernet Transceivers
10.3.4. CAN Transceivers
10.3.5. Others
10.4. Europe Transceiver Market Revenue (US$ Mn) Forecast, by Form Factor, 2017–2027
10.4.1. SFP
10.4.2. SFP+
10.4.3. XFP
10.4.4. QSFP
10.4.5. QSFP+
10.4.6. CFP
10.4.7. Others
10.5. Europe Transceiver Market Revenue (US$ Mn) Forecast, by End-use Industry, 2017–2027
10.5.1. Healthcare
10.5.2. Automotive
10.5.3. Retail
10.5.4. IT & Telecommunication
10.5.5. Others
10.6. Europe Transceiver Market Revenue (US$ Mn) Forecast, by Country/Sub-region, 2017–2027
10.6.1. Germany
10.6.2. U.K.
10.6.3. France
10.6.4. Rest of Europe
10.7. Europe Transceiver Market Attractiveness Analysis
10.7.1. By Type
10.7.2. By End-use Industry
10.7.3. By Form Factor
10.7.4. By Country/Sub-region
11. Asia Pacific Transceiver Market Analysis and Forecast
11.1. Key Findings
11.2. Key Trends
11.3. Asia Pacific Transceiver Market Size (US$ Mn and Units) Forecast, by Type, 2017–2027
11.3.1. RF Transceivers
11.3.2. Optical Transceivers
11.3.3. Ethernet Transceivers
11.3.4. CAN Transceivers
11.3.5. Others
11.4. Asia Pacific Transceiver Market Revenue (US$ Mn) Forecast, by Form Factor, 2017–2027
11.4.1. SFP
11.4.2. SFP+
11.4.3. XFP
11.4.4. QSFP
11.4.5. QSFP+
11.4.6. CFP
11.4.7. Others
11.5. Asia Pacific Transceiver Market Revenue (US$ Mn) Forecast, by End-use Industry, 2017–2027
11.5.1. Healthcare
11.5.2. Automotive
11.5.3. Retail
11.5.4. IT & Telecommunication
11.5.5. Others
11.6. Asia Pacific Transceiver Market Revenue (US$ Mn) Forecast, by Country/Sub-region, 2017–2027
11.6.1. China
11.6.2. India
11.6.3. Japan
11.6.4. Rest of Asia Pacific
11.7. Asia Pacific Transceiver Market Attractiveness Analysis
11.7.1. By Type
11.7.2. By Form Factor
11.7.3. By End-use Industry
11.7.4. By Country/Sub-region
12. Middle East & Africa Transceiver Market Analysis and Forecast
12.1. Key Findings
12.2. Key Trends
12.3. Middle East & Africa Transceiver Market Size (US$ Mn and Units) Forecast, by Type, 2017–2027
12.3.1. RF Transceivers
12.3.2. Optical Transceivers
12.3.3. Ethernet Transceivers
12.3.4. CAN Transceivers
12.3.5. Others
12.4. Middle East & Africa Transceiver Market Revenue (US$ Mn) Forecast, by Form Factor, 2017–2027
12.4.1. SFP
12.4.2. SFP+
12.4.3. XFP
12.4.4. QSFP
12.4.5. QSFP+
12.4.6. CFP
12.4.7. Others
12.5. Middle East & Africa Transceiver Market Revenue (US$ Mn) Forecast, by End-use Industry, 2017–2027
12.5.1. Healthcare
12.5.2. Automotive
12.5.3. Retail
12.5.4. IT & Telecommunication
12.5.5. Others
12.6. Middle East & Africa Transceiver Market Revenue (US$ Mn) Forecast, by Country/Sub-region, 2017–2027
12.6.1. GCC
12.6.2. South Africa
12.6.3. Rest of Middle East & Africa
12.7. Middle East & Africa Transceiver Market Attractiveness Analysis
12.7.1. By Type
12.7.2. By Form Factor
12.7.3. By End-use Industry
12.7.4. By Country/Sub-region
13. South America Transceiver Market Analysis and Forecast
13.1. Key Findings
13.2. Key Trends
13.3. South America Transceiver Market Size (US$ Mn and Units) Forecast, by Type, 2017–2027
13.3.1. RF Transceivers
13.3.2. Optical Transceivers
13.3.3. Ethernet Transceivers
13.3.4. CAN Transceivers
13.3.5. Others
13.4. South America Transceiver Market Revenue (US$ Mn) Forecast, by Form Factor, 2017–2027
13.4.1. SFP
13.4.2. SFP+
13.4.3. XFP
13.4.4. QSFP
13.4.5. QSFP+
13.4.6. CFP
13.4.7. Others
13.5. South America Transceiver Market Revenue (US$ Mn) Forecast, by End-use Industry, 2017–2027
13.5.1. Healthcare
13.5.2. Automotive
13.5.3. Retail
13.5.4. IT & Telecommunication
13.5.5. Others
13.6. South America Transceiver Market Revenue (US$ Mn) Forecast, by Country/Sub-region, 2017–2027
13.6.1. Brazil
13.6.2. Rest of South America
13.7. South America Transceiver Market Attractiveness Analysis
13.7.1. By Type
13.7.2. By Form Factor
13.7.3. By End-use Industry
13.7.4. By Country/Sub-region
14. Competition Landscape
14.1. Market Players – Competition Matrix
14.2. Global Transceiver Market Share Analysis, by Company (2018)
14.3. Company Profiles (Details – Overview, Financials, SWOT Analysis, Recent Developments, Strategy)
14.3.1. Texas Instruments Incorporated
14.3.1.1. Overview
14.3.1.2. Financials
14.3.1.3. SWOT Analysis
14.3.1.4. Recent Developments
14.3.1.5. Strategy
14.3.2. Finisar Corporation
14.3.2.1. Overview
14.3.2.2. Financials
14.3.2.3. SWOT Analysis
14.3.2.4. Recent Developments
14.3.2.5. Strategy
14.3.3. Microchip Technology Inc.
14.3.3.1. Overview
14.3.3.2. Financials
14.3.3.3. SWOT Analysis
14.3.3.4. Recent Developments
14.3.3.5. Strategy
14.3.4. ROHM SEMICONDUCTOR
14.3.4.1. Overview
14.3.4.2. Financials
14.3.4.3. SWOT Analysis
14.3.4.4. Recent Developments
14.3.4.5. Strategy
14.3.5. Analog Devices, Inc.
14.3.5.1. Overview
14.3.5.2. Financials
14.3.5.3. SWOT Analysis
14.3.5.4. Recent Developments
14.3.5.5. Strategy
14.3.6. ATOP Corporation
14.3.6.1. Overview
14.3.6.2. Financials
14.3.6.3. SWOT Analysis
14.3.6.4. Recent Developments
14.3.6.5. Strategy
14.3.7. NXP Semiconductors
14.3.7.1. Overview
14.3.7.2. Financials
14.3.7.3. SWOT Analysis
14.3.7.4. Recent Developments
14.3.7.5. Strategy
14.3.8. ON Semiconductor Corporation
14.3.8.1. Overview
14.3.8.2. Financials
14.3.8.3. SWOT Analysis
14.3.8.4. Recent Developments
14.3.8.5. Strategy
14.3.9. MAXIM INTEGRATED PRODUCTS, INC.
14.3.9.1. Overview
14.3.9.2. Financials
14.3.9.3. SWOT Analysis
14.3.9.4. Recent Developments
14.3.9.5. Strategy
14.3.10. Broadcom Inc.
14.3.10.1. Overview
14.3.10.2. Financials
14.3.10.3. SWOT Analysis
14.3.10.4. Recent Developments
14.3.10.5. Strategy
14.3.11. Infineon Technologies AG
14.3.11.1. Overview
14.3.11.2. Financials
14.3.11.3. SWOT Analysis
14.3.11.4. Recent Developments
14.3.11.5. Strategy
14.3.12. Lumentum Operations LLC
14.3.12.1. Overview
14.3.12.2. Financials
14.3.12.3. SWOT Analysis
14.3.12.4. Recent Developments
14.3.12.5. Strategy
14.3.13. InnoLight Technology (Suzhou) Ltd.
14.3.13.1. Overview
14.3.13.2. Financials
14.3.13.3. SWOT Analysis
14.3.13.4. Recent Developments
14.3.13.5. Strategy
15. Key Takeaways
List of Tables
Table 01: Global Transceiver Market Revenue (US$ Mn) Forecast, by Type, 2017–2027
Table 02: Global Transceiver Market Revenue (Million Units) Forecast, by Type, 2017–2027
Table 03: Global Transceiver Market Revenue (US$ Mn) Forecast, by Form Factor, 2017–2027
Table 04: Global Transceiver Market Revenue (US$ Mn) Forecast, by End-use Industry, 2017–2027
Table 05: Global Transceiver Market Revenue (US$ Mn) Forecast, by Region, 2017–2027
Table 06: Global Transceiver Market Revenue (Million Units) Forecast, by Region, 2017–2027
Table 07: North America Transceiver Market Revenue (US$ Mn) Forecast, by Type, 2017–2027
Table 08: North America Transceiver Market Revenue (Million Units) Forecast, by Type, 2017–2027
Table 09: North America Transceiver Market Revenue (US$ Mn) Forecast, by Form Factor, 2017–2027
Table 10: North America Transceiver Market Revenue (US$ Mn) Forecast, by End-use Industry, 2017–2027
Table 11: North America Transceiver Market Revenue (US$ Mn) Forecast, by Country/Sub-region, 2017–2027
Table 12: North America Transceiver Market Size (Million Units) Forecast, by Country/Sub-region, 2017–2027
Table 13: Europe Transceiver Market Revenue (US$ Mn) Forecast, by Type, 2017–2027
Table 14: Europe Transceiver Market Revenue (Million Units) Forecast, by Type, 2017–2027
Table 15: Europe Transceiver Market Revenue (US$ Mn) Forecast, by Form Factor, 2017–2027
Table 16: Europe Transceiver Market Revenue (US$ Mn) Forecast, by End-use Industry, 2017–2027
Table 17: Europe Transceiver Market Revenue (US$ Mn) Forecast, by Country/Sub-region, 2017–2027
Table 18: Europe Transceiver Market Size (Million Units) Forecast, by Country/Sub-region, 2017–2027
Table 19: Asia Pacific Transceiver Market Revenue (US$ Mn) Forecast, by Type, 2017–2027
Table 20: Asia Pacific Transceiver Market Revenue (Million Units) Forecast, by Type, 2017–2027
Table 21: Asia Pacific Transceiver Market Revenue (US$ Mn) Forecast, by Form Factor, 2017–2027
Table 22: Asia Pacific Transceiver Market Revenue (US$ Mn) Forecast, by End-use Industry, 2017–2027
Table 23: Asia Pacific Transceiver Market Revenue (US$ Mn) Forecast, by Country/Sub-region, 2017–2027
Table 24: Asia Pacific Transceiver Market Size (Million Units) Forecast, by Country/Sub-region, 2017–2027
Table 25: Middle East & Africa Transceiver Market Revenue (US$ Mn) Forecast, by Type, 2017–2027
Table 26: Middle East & Africa Transceiver Market Revenue (Million Units) Forecast, by Type, 2017–2027
Table 27: Middle East & Africa Transceiver Market Revenue (US$ Mn) Forecast, by Form Factor, 2017–2027
Table 28: Middle East & Africa Transceiver Market Revenue (US$ Mn) Forecast, by End-use Industry, 2017–2027
Table 29: Middle East & Africa Transceiver Market Revenue (US$ Mn) Forecast, by Country/Sub-region, 2017–2027
Table 30: Middle East & Africa Transceiver Market Size (Million Units) Forecast, by Country/Sub-region, 2017–2027
Table 31: South America Transceiver Market Revenue (US$ Mn) Forecast, by Type, 2017–2027
Table 32: South America Transceiver Market Revenue (Million Units) Forecast, by Type, 2017–2027
Table 33: South America Transceiver Market Revenue (US$ Mn) Forecast, by Form Factor, 2017–2027
Table 34: South America Transceiver Market Revenue (US$ Mn) Forecast, by End-use Industry, 2017–2027
Table 35: South America Transceiver Market Revenue (US$ Mn) Forecast, by Country/Sub-region, 2017–2027
Table 36: South America Transceiver Market Size (Million Units) Forecast, by Country/Sub-region, 2017–2027
List of Figures
Figure 01: Global Transceiver Market Revenue (US$ Mn) Y-o-Y Forecast, 2019–2027
Figure 02: Global Transceiver Market Volume (Million Units) Y-o-Y Forecast, 2019–2027
Figure 03: Global Transceiver Market, by Optical Transceiver
Figure 04: Global Transceiver Market, by Ethernet Transceiver
Figure 05: Global Transceiver Market, by RF Transceiver
Figure 06: Global Transceiver Market, by CAN Transceiver
Figure 07: Global Transceiver Market, by Others
Figure 08: Global Transceiver Market Comparison Matrix, by Type
Figure 09: Global Transceiver Market Attractiveness Analysis, by Type
Figure 10: Global Transceiver Market, by SFP (Small Form-factor Pluggable)
Figure 11: Global Transceiver Market, by SFP+ (Small Form-factor Pluggable Plus)
Figure 12: Global Transceiver Market, by XFP (10 Gigabit Small Form-factor Pluggable)
Figure 13: Global Transceiver Market, by QSFP (Quad Small Form-factor Pluggable)
Figure 14: Global Transceiver Market, by QSFP+ (Quad Small Form-factor Pluggable Plus)
Figure 15: Global Transceiver Market, by CFP (C Form-factor Pluggable)
Figure 16: Global Transceiver Market, by Others
Figure 17: Global Transceiver Market Comparison Matrix, by Form Factor
Figure 18: Global Transceiver Market Attractiveness Analysis, by Form Factor
Figure 19: Global Transceiver Market, by Healthcare
Figure 20: Global Transceiver Market, by Automotive
Figure 21: Global Transceiver Market, by Oil & Gas
Figure 22: Global Transceiver Market, by IT & Telecommunication
Figure 23: Global Transceiver Market, by Others
Figure 24: Global Transceiver Market Comparison Matrix, by End-use Industry
Figure 25: Global Transceiver Market Attractiveness Analysis, by End-use Industry
Figure 26: Global Transceiver Market Value Share Analysis, by Region (2019E)
Figure 27: Global Transceiver Market Value Share Analysis, by Region (2027F)
Figure 28: Global Transceiver Market Attractiveness Analysis, by Region
Figure 29: North America Transceiver Market Revenue (US$ Mn) Forecast, 2017–2027
Figure 30: North America Transceiver Market Size Y-o-Y Growth Projection, 2017–2027
Figure 31: North America Transceiver Market Value Share Analysis, by Type, 2019 and 2027
Figure 32: North America Transceiver Market Value Share Analysis, by Form Factor, 2019 and 2027
Figure 33: North America Transceiver Market Value Share Analysis, by End-use Industry, 2019 and 2027
Figure 34: North America Transceiver Market Value Share Analysis, by Country/Sub-region, 2019 and 2027
Figure 35: North America Transceiver Market Attractiveness Analysis, by Type
Figure 36: North America Transceiver Market Attractiveness Analysis, by Form Factor
Figure 37: North America Transceiver Market Attractiveness Analysis, by End-use Industry
Figure 38: North America Transceiver Market Attractiveness Analysis, by Country/Sub-region
Figure 39: Europe Transceiver Market Revenue (US$ Mn) Forecast, 2017–2027
Figure 40: Europe Transceiver Market Size Y-o-Y Growth Projection, 2017–2027
Figure 41: Europe Transceiver Market Value Share Analysis, by Type, 2019 and 2027
Figure 42: Europe Transceiver Market Value Share Analysis, by Form Factor, 2019 and 2027
Figure 43: Europe Transceiver Market Value Share Analysis, by End-use Industry, 2019 and 2027
Figure 44: Europe Transceiver Market Value Share Analysis, by Country/Sub-region, 2019 and 2027
Figure 45: Europe Transceiver Market Attractiveness Analysis, by Type
Figure 46: Europe Transceiver Market Attractiveness Analysis, by Form Factor
Figure 47: Europe Transceiver Market Attractiveness Analysis, by End-use Industry
Figure 48: Europe Transceiver Market Attractiveness Analysis, by Country/Sub-region
Figure 49: Asia Pacific Transceiver Market Revenue (US$ Mn) Forecast, 2017–2027
Figure 50: Asia Pacific Transceiver Market Size Y-o-Y Growth Projection, 2017–2027
Figure 51: Asia Pacific Transceiver Market Value Share Analysis, by Type, 2019 and 2027
Figure 52: Asia Pacific Transceiver Market Value Share Analysis, by Form Factor, 2019 and 2027
Figure 53: Asia Pacific Transceiver Market Value Share Analysis, by End-use Industry, 2019 and 2027
Figure 54: Asia Pacific Transceiver Market Value Share Analysis, by Country/Sub-region, 2019 and 2027
Figure 55: Asia Pacific Transceiver Market Attractiveness Analysis, by Type
Figure 56: Asia Pacific Transceiver Market Attractiveness Analysis, by Form Factor
Figure 57: Asia Pacific Transceiver Market Attractiveness Analysis, by End-use Industry
Figure 58: Asia Pacific Transceiver Market Attractiveness Analysis, by Country/Sub-region
Figure 59: Middle East & Africa Transceiver Market Revenue (US$ Mn) Forecast, 2017–2027
Figure 60: Middle East & Africa Transceiver Market Size Y-o-Y Growth Projection, 2017–2027
Figure 61: Middle East & Africa Transceiver Market Value Share Analysis, by Type, 2019 and 2027
Figure 62: Middle East & Africa Transceiver Market Value Share Analysis, by Form Factor, 2019 and 2027
Figure 63: Middle East & Africa Transceiver Market Value Share Analysis, by End-use Industry, 2019 and 2027
Figure 64: Middle East & Africa Transceiver Market Value Share Analysis, by Country/Sub-region, 2019 and 2027
Figure 65: Middle East & Africa Transceiver Market Attractiveness Analysis, by Type
Figure 66: Middle East & Africa Transceiver Market Attractiveness Analysis, by Form Factor
Figure 67: Middle East & Africa Transceiver Market Attractiveness Analysis, by End-use Industry
Figure 68: Middle East & Africa Transceiver Market Attractiveness Analysis, by Country/Sub-region
Figure 69: South America Transceiver Market Revenue (US$ Mn) Forecast, 2017–2027
Figure 70: South America Transceiver Market Size Y-o-Y Growth Projection, 2017–2027
Figure 71: South America Transceiver Market Value Share Analysis, by Type, 2019 and 2027
Figure 72: South America Transceiver Market Value Share Analysis, by Form Factor, 2019 and 2027
Figure 73: South America Transceiver Market Value Share Analysis, by End-use Industry, 2019 and 2027
Figure 74: South America Transceiver Market Value Share Analysis, by Country/Sub-region, 2019 and 2027
Figure 75: South America Transceiver Market Attractiveness Analysis, by Type
Figure 76: South America Transceiver Market Attractiveness Analysis, by Form Factor
Figure 77: South America Transceiver Market Attractiveness Analysis, by End-use Industry
Figure 78: South America Transceiver Market Attractiveness Analysis, by Country/Sub-region
Copyright © Transparency Market Research, Inc. All Rights reserved
Trust Online

Transceiver Market