
Reports
Reports
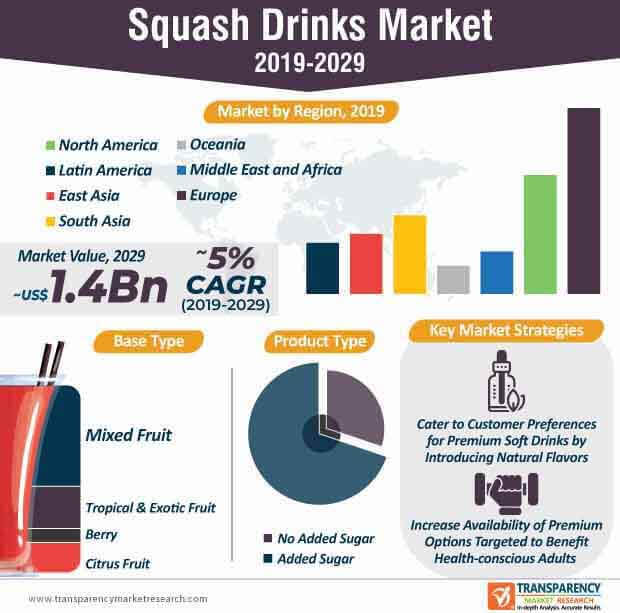
Blending is one of the most important procedures in the F&B processing industry. As such, blended products are anticipated to dominate the squash drinks market in terms of value and volume. This product type segment is projected to reach a volume of ~263,200 metric tons by the end of 2029. Hence, manufacturers in the squash drinks market are increasing their production capabilities to produce blended grape squashes.
Moreover, South Asia is estimated to reach the third-highest volume among all regions in the squash drinks market. It is estimated to reach a production of ~89,600 metric tons by 2029. India being one of the rapidly growing economies in South Asia, is also one of the largest producers of fruits worldwide. Hence, manufacturers in the squash drinks market are penetrating in other developing countries of South Asia to boost sales. They are also tying up with farmers to source good quality grapes to fulfill consumer demands for premium-quality products. Manufacturers are also boosting developing marketing strategies around health promoting phytonutrients, vitamins, and antioxidants in products.
Manufacturers in the squash drinks market are adopting various tactics to increase the sales of underperforming squash drinks. For instance, soft drinks firm Britvic partnered with Sainbury’s - a supermarket company, to rebrand and reformulate Robinsons squash into a new range products in their existing product line.
Companies in the squash drinks market landscape are adopting marketing tactics to increase consumer uptake. They are strategically staging their products with labels such as ‘Fruit Cordial’ range or ‘Fruit Creations’ squash collection. As such, the mixed fruit base type segment is estimated to reach a volume of ~293,200 metric tons by 2029. Hence, manufacturers are increasing the availability of squash drinks in mixed fruit base type.
Moreover, manufacturers are increasing awareness about adding squash in tap water to enhance taste. This trend is helping companies to increase consumption in the U.K. and maximizing incremental opportunities for both manufacturers as well as retailers.
Companies are focusing on leveraging incremental opportunities in Europe, since the region dictates the squash drinks market in terms of value and volume. The squash drinks market in Europe is estimated to reach a value of ~US$ 400 Mn by 2029. For instance, Princes - U.K.’s food and drinks company, announced its £17 Mn (~US$ 22 Mn) investment in installing a new squash bottling plant in Bradford.
Stakeholders in the squash drinks market are increasingly investing in new technologies that boost production capabilities of companies on an hourly basis. They are upgrading their credibility credentials by adopting sustainable production practices. Companies are using recycled PET bottles to significantly reduce the excess weight of conventional plastic bottles. They are growing increasingly aware about their shared responsibility towards reduction of plastic pollution. Companies are investing in cutting-edge equipment to increase production and enhance production efficiency at sites.
The squash drinks market is undergoing a shift in consumer preferences from alcoholic drinks to increased inclination toward premium soft drinks. Health-conscious customers are aiming to moderate their alcohol intake. Thus, manufacturers in the squash drinks market are capitalizing on this trend, and introducing fresh and natural flavors.
Manufacturers in the squash drinks market are tapping into opportunities in HoReCa to offer great tasting drinks to customers. Though added sugar products are projected to hold a higher value and volume as compared to no-added sugar products, more and more customers are demanding unconventional drinks sans sugar.
However, stakeholders in HoReCa are pushing sales of cordials to maximize their profit potential. They are investing in on premise dispensing systems to meet the growing demand for non-alcoholic drinks. Hence, manufacturers in the squash drinks ecosystem are aiming to increase their offerings in natural credentials with no added sugar. They are, thus, likely to tie up with stakeholders in HoReCa and strengthen supply chain of branded glassware and bar equipment to boost brand identity.
Analysts’ Viewpoint
Apart from store-based retailing, manufacturers in the squash drinks market are exploring opportunities in online retailing to further sales. For instance, PepsiCo partnered with different manufacturers for the launch of its e-Commerce-only squash drink, Drinkfinity. Thus, manufacturers are introducing products rapidly into the squash drinks market.
However, several companies are experiencing a downturn in sales of products. Hence, manufacturers should adopt marketing strategies, such as rebranding to increase consumer base. Manufacturers should also direct investments toward Europe, North America, and South Asia to maximize profits. Moreover, they should increase product offerings in premium options of squash drinks to meet the needs of health-conscious adults.
Squash Drinks Market: Overview
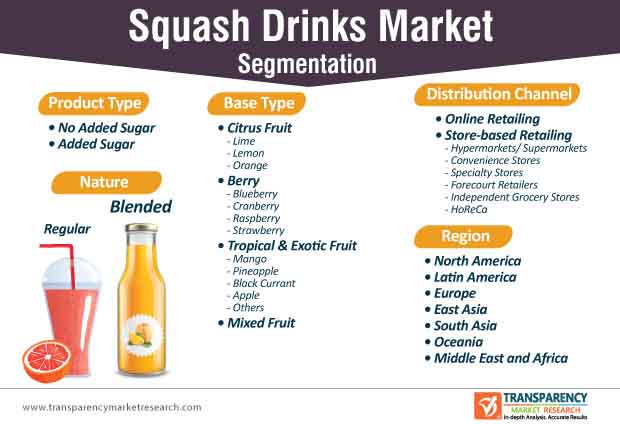
Squash Drinks Market: Segmentation
Squash Drinks Market: Trends
Squash Drinks Market: Strategies
Squash Drinks Market: Key Players
Key players operating in the squash drinks market, as profiled in the study, include -
Squash Drinks is projected to reach US$ 1.4 Bn by the end of 2019
Squash Drinks is expected to grow at a CAGR of 5% during 2019-2029
Flavor and Palatability with High Nutritional Value to Drive Squash Drinks Market
North America is a more attractive region for vendors in the Squash Drinks
Key vendors in the Squash Drinks are J Sainsbury plc (Sainsbury's), Nichols plc (Vimto), Dr Pepper Snapple Group (Schweppes), Unilever plc (Kissan), Prigat, PepsiCo Inc (Tropicana), etc
1. Global Squash Drinks Market - Executive Summary
1.1. Global Squash Drinks Market Country Analysis
1.2. Global Market Outlook Demand-side Trends
1.3. Supply-side Trends
1.4. Opportunity Assessment- Winning & Loosing Components
1.5. Variety Roadmap Analysis
1.6. Analysis and Recommendations Market Overview
2. Market Introduction
2.1. Market Taxonomy
2.2. Market Definition
3. Key Market Trends
3.1. Key Trends Impacting the Market
3.2. Product Innovation / Development Trends
3.3. Trend Analysis- Impact on Time Line (2019-2029)
3.4. Key Success Factors
3.5. Product Launch Track & Trends
4. Market Background
4.1. Global Food and Beverage Market Overview
4.2. Global Non-alcoholic Beverages Market Overview
4.3. Non-alcoholic Beverages: Growth Categories to Watch
4.4. Food For Thought
4.5. Policy Developments and Regulatory Scenario
4.6. Macro-Economic Factors
4.7. Forecast Factors - Relevance & Impact
4.8. Value Chain Analysis
4.9. Market Dynamics
4.9.1. Drivers
4.9.2. Restraints
4.9.3. Opportunity
5. Survey Analysis
5.1. Consumer Sentiment Analysis
5.2. Social Media Survey Analysis
6. Global Squash Drinks Market - Pricing Analysis
6.1.1. Manufacturer Level Pricing
6.1.2. Distributor Level Pricing
6.2. Price Point Assessment by Product Type
6.3. Price Forecast till 2027
7. Global Squash Drinks Market Analysis and Forecast
7.1. Market Size Analysis (2014-2018) and Forecast (2019-2029)
7.1.1. Market Value (US$ Mn) and Volume (Tons) and Y-o-Y Growth
7.1.2. Absolute $ Opportunity
7.2. Global Squash Drinks Market Scenario Forecast (Optimistic, Likely and Conservative Market Conditions)
7.2.1. Forecast Factors and Relevance of Impact
7.2.2. Regional Squash Drinks Market Business Performance Summary
8. Global Squash Drinks Market Analysis By Nature
8.1. Introduction
8.1.1. Y-o-Y Growth Comparison By Nature
8.1.2. Basis Point Share (BPS) Analysis By Nature
8.2. Squash Drinks Market Size (US$ Mn) and Volume (MT) Analysis (2014-2018) & Forecast (2019-2029) By Nature
8.2.1. Organic
8.2.2. Conventional
8.3. Market Attractiveness Analysis By Nature
9. Global Squash Drinks Market Analysis By Product Type
9.1. Introduction
9.1.1. Y-o-Y Growth Comparison By Product Type
9.1.2. Basis Point Share (BPS) Analysis By Product Type
9.2. Squash Drinks Market Size (US$ Mn) and Volume (MT) Analysis (2014-2018) & Forecast (2019-2029) By Product Type
9.2.1. Added Sugar
9.2.2. No Added Sugar
9.3. Market Attractiveness Analysis By Product Type
10. Global Squash Drinks Market Analysis By Base Type
10.1. Introduction
10.1.1. Y-o-Y Growth Comparison By Base Type
10.1.2. Basis Point Share (BPS) Analysis By Base Type
10.2. Squash Drinks Market Size (US$ Mn) and Volume (MT) Analysis (2014-2018) & Forecast (2019-2029) By Base Type
10.2.1. Citrus Fruits
10.2.1.1. Lime
10.2.1.2. Lemon
10.2.1.3. Orange
10.2.2. Berries
10.2.2.1. Blueberry
10.2.2.2. Cranberry
10.2.2.3. Raspberry
10.2.2.4. Strawberry
10.2.3. Tropical & Exotic Fruits
10.2.3.1. Mango
10.2.3.2. Pineapple
10.2.3.3. Black Currant
10.2.3.4. Apple
10.2.3.5. Others
10.2.4. Mixed Fruit
10.3. Market Attractiveness Analysis By Base Type
11. Global Squash Drinks Market Analysis By Distribution Channel
11.1. Introduction
11.1.1. Y-o-Y Growth Comparison By Distribution Channel
11.1.2. Basis Point Share (BPS) Analysis By Distribution Channel
11.2. Squash Drinks Market Size (US$ Mn) and Volume (MT) Analysis (2014-2018) & Forecast (2019-2029) By Distribution Channel
11.3. Online Retailing
11.4. Store-based Retailing
11.4.1.1. Hypermarkets/ Supermarkets
11.4.1.2. Convenience Stores
11.4.1.3. Specialty Stores
11.4.1.4. Forecourt Retailers
11.4.1.5. Independent Grocery Stores
11.4.1.6. HoReCa
11.5. Market Attractiveness Analysis By Distribution Channel
12. Global Squash Drinks Market Analysis and Forecast, By Region
12.1. Introduction
12.1.1. Basis Point Share (BPS) Analysis By Region
12.1.2. Y-o-Y Growth Projections By Region
12.2. Squash Drinks Market Size (US$ Mn) and Volume (MT) & Forecast (2019-2029) Analysis By Region
12.2.1. North America
12.2.2. Latin America
12.2.3. Europe
12.2.4. East Asia
12.2.5. South Asia
12.2.6. Oceania
12.2.7. Middle East and Africa
12.3. Market Attractiveness Analysis By Region
13. North America Squash Drinks Market Analysis and Forecast
13.1. Introduction
13.1.1. Basis Point Share (BPS) Analysis By Country
13.1.2. Y-o-Y Growth Projections By Country
13.2. Squash Drinks Market Size (Value (US$) and Volume (MT) Analysis (2014-2018) and Forecast (2019-2029)
13.2.1. Market Attractiveness By Country
13.2.1.1. U.S.
13.2.1.2. Canada
13.2.2. By Nature
13.2.3. By Product Type
13.2.4. By Base Type
13.2.5. By Distribution Channel
13.3. Market Attractiveness Analysis
13.3.1. By Country
13.3.2. By Nature
13.3.3. By Product Type
13.3.4. By Base Type
13.3.5. By Distribution Channel
13.4. Drivers and Restraints: Impact Analysis
13.5. Heat Map Analysis
13.6. Market Trends
14. Latin America Squash Drinks Market Analysis and Forecast
14.1. Introduction
14.1.1. Basis Point Share (BPS) Analysis By Country
14.1.2. Y-o-Y Growth Projections By Country
14.1.3. Key Regulations
14.2. Squash Drinks Market Size (Value (US$) and Volume (MT) Analysis (2014-2018) and Forecast (2019-2029)
14.2.1. By Country
14.2.1.1. Brazil
14.2.1.2. Mexico
14.2.1.3. Chile
14.2.1.4. Argentina
14.2.1.5. Rest of Latin America
14.2.2. By Nature
14.2.3. By Product Type
14.2.4. By Base Type
14.2.5. By Distribution Channel
14.3. Market Attractiveness Analysis
14.3.1. By Country
14.3.2. By Nature
14.3.3. By Product Type
14.3.4. By Base Type
14.3.5. By Distribution Channel
14.4. Drivers and Restraints: Impact Analysis
14.5. Heat Map Analysis
14.6. Market Trends
15. Europe Squash Drinks Market Analysis and Forecast
15.1. Introduction
15.1.1. Basis Point Share (BPS) Analysis By Country
15.1.2. Y-o-Y Growth Projections By Country
15.1.3. Key Regulations
15.2. Squash Drinks Market Size (Value (US$) and Volume (MT) Analysis (2014-2018) and Forecast (2019-2029)
15.2.1. By Country
15.2.1.1. EU-4
15.2.1.2. U.K.
15.2.1.3. BENELUX
15.2.1.4. NORDIC
15.2.1.5. Russia
15.2.1.6. Poland
15.2.1.7. Rest of Europe
15.2.2. By Nature
15.2.3. By Product Type
15.2.4. By Base Type
15.2.5. By Distribution Channel
15.3. Market Attractiveness Analysis
15.3.1. By Country
15.3.2. By Nature
15.3.3. By Product Type
15.3.4. By Base Type
15.3.5. By Distribution Channel
15.4. Drivers and Restraints: Impact Analysis
15.5. Heat Map Analysis
15.6. Market Trends
16. East Asia Squash Drinks Market Analysis and Forecast
16.1. Introduction
16.1.1. Basis Point Share (BPS) Analysis By Country
16.1.2. Y-o-Y Growth Projections By Country
16.1.3. Key Regulations
16.2. Squash Drinks Market Size (Value (US$) and Volume (MT) Analysis (2014-2018) and Forecast (2019-2029)
16.2.1. By Country
16.2.1.1. China
16.2.1.2. Japan
16.2.1.3. South Korea
16.2.2. By Nature
16.2.3. By Product Type
16.2.4. By Base Type
16.2.5. By Distribution Channel
16.3. Market Attractiveness Analysis
16.3.1. By Country
16.3.2. By Nature
16.3.3. By Product Type
16.3.4. By Base Type
16.3.5. By Distribution Channel
16.4. Drivers and Restraints: Impact Analysis
16.5. Heat Map Analysis
16.6. Market Trends
17. South Asia Squash Drinks Market Analysis and Forecast
17.1. Introduction
17.1.1. Basis Point Share (BPS) Analysis By Country
17.1.2. Y-o-Y Growth Projections By Country
17.1.3. Key Regulations
17.2. Squash Drinks Market Size (Value (US$) and Volume (MT) Analysis (2014-2018) and Forecast (2019-2029)
17.2.1. By Country
17.2.1.1. India
17.2.1.2. Thailand
17.2.1.3. Indonesia
17.2.1.4. Malaysia
17.2.1.5. Singapore
17.2.1.6. Rest of South Asia
17.2.2. By Nature
17.2.3. By Product Type
17.2.4. By Base Type
17.2.5. By Distribution Channel
17.3. Market Attractiveness Analysis
17.3.1. By Country
17.3.2. By Nature
17.3.3. By Product Type
17.3.4. By Base Type
17.3.5. By Distribution Channel
17.4. Drivers and Restraints: Impact Analysis
17.5. Heat Map Analysis
17.6. Market Trends
18. Oceania Squash Drinks Market Analysis and Forecast
18.1. Introduction
18.1.1. Basis Point Share (BPS) Analysis By Country
18.1.2. Y-o-Y Growth Projections By Country
18.1.3. Key Regulations
18.2. Squash Drinks Market Size (Value (US$) and Volume (MT) Analysis (2014-2018) and Forecast (2019-2029)
18.2.1. By Country
18.2.1.1. Australia
18.2.1.2. New Zealand
18.2.2. By Nature
18.2.3. By Product Type
18.2.4. By Base Type
18.2.5. By Distribution Channel
18.3. Market Attractiveness Analysis
18.3.1. By Country
18.3.2. By Nature
18.3.3. By Product Type
18.3.4. By Base Type
18.3.5. By Distribution Channel
18.4. Drivers and Restraints: Impact Analysis
18.5. Heat Map Analysis
18.6. Market Trends
19. Middle East and Africa (MEA) Squash Drinks Market Analysis and Forecast
19.1. Introduction
19.1.1. Basis Point Share (BPS) Analysis By Country
19.1.2. Y-o-Y Growth Projections By Country
19.1.3. Key Regulations
19.2. Squash Drinks Market Size (Value (US$) and Volume (MT) Analysis (2014-2018) and Forecast (2019-2029)
19.2.1. By Country
19.2.1.1. GCC Countries
19.2.1.2. South Africa
19.2.1.3. Rest of MEA
19.2.2. By Nature
19.2.3. By Product Type
19.2.4. By Base Type
19.2.5. By Distribution Channel
19.3. Market Attractiveness Analysis
19.3.1. By Country
19.3.2. By Nature
19.3.3. By Product Type
19.3.4. By Base Type
19.3.5. By Distribution Channel
19.4. Drivers and Restraints: Impact Analysis
19.5. Heat Map Analysis
19.6. Market Trends
20. Emerging Countries Squash Drinks Market Analysis 2014-2018 and Forecast 2019-2029
20.1. Introduction
20.1.1. Market Value Proportion Analysis, By Key Countries
20.1.2. Growth Comparison of Global Market v/s Emerging Countries
20.2. India Squash Drinks Market Analysis
20.2.1. Introduction
20.2.2. Pricing Analysis
20.2.3. PEST Analysis
20.2.4. Market Value Proportion Analysis by Market Taxonomy
20.2.5. Market Volume (MT) and Value (US$ Mn) Analysis and Forecast by Market Taxonomy
20.2.5.1. By Nature
20.2.5.2. By Base Type
20.2.5.3. By Product Type
20.2.5.4. By Distribution Channel
20.2.6. India Squash (Drinks) Market - Competition Landscape
20.3. China Squash Drinks Market Analysis
20.3.1. Introduction
20.3.2. Pricing Analysis
20.3.3. PEST Analysis
20.3.4. Market Value Proportion Analysis by Market Taxonomy
20.3.5. Market Volume (MT) and Value (US$ Mn) Analysis and Forecast by Market Taxonomy
20.3.5.1. By Nature
20.3.5.2. By Base Type
20.3.5.3. By Product Type
20.3.5.4. By Distribution Channel
20.3.6. China Squash (Drinks) Market - Competition Landscape
20.4. Mexico Squash Drinks Market Analysis
20.4.1. Introduction
20.4.2. Pricing Analysis
20.4.3. PEST Analysis
20.4.4. Market Value Proportion Analysis by Market Taxonomy
20.4.5. Market Volume (MT) and Value (US$ Mn) Analysis and Forecast by Market Taxonomy
20.4.5.1. By Nature
20.4.5.2. By Base Type
20.4.5.3. By Product Type
20.4.5.4. By Distribution Channel
20.4.6. Mexico Squash (Drinks) Market - Competition Landscape
21. Competition Assessment
21.1. Global Squash Drinks Market Competition - a Dashboard View
21.2. Global Squash Drinks Market Structure Analysis
21.3. Global Squash Drinks Market Company Share Analysis
21.3.1. For Tier 1 Market Players, 2018
21.3.2. Company Market Share Analysis of Top 5 Players, By Region
21.4. Key Participants Market Presence (Intensity Mapping) by Region
22. Competition Deep-dive (Manufacturers/Suppliers)
22.1. Britvic PLC. (Robinsons)
22.1.1. Overview
22.1.2. Product Portfolio
22.1.3. Production Footprint
22.1.4. Sales Footprint
22.1.5. Channel Footprint
22.1.6. Strategy Overview
22.1.7. Marketing Strategy
22.1.8. SWOT Analysis
22.1.9. Financial Analysis
22.2. Tovali Limited (Tovali)
22.2.1. Overview
22.2.2. Product Portfolio
22.2.3. Production Footprint
22.2.4. Sales Footprint
22.2.5. Channel Footprint
22.2.6. Strategy Overview
22.2.7. Marketing Strategy
22.2.8. SWOT Analysis
22.2.9. Financial Analysis
22.3. J Sainsbury plc (Sainsbury's)
22.3.1. Overview
22.3.2. Product Portfolio
22.3.3. Production Footprint
22.3.4. Sales Footprint
22.3.5. Channel Footprint
22.3.6. Strategy Overview
22.3.7. Marketing Strategy
22.3.8. SWOT Analysis
22.3.9. Financial Analysis
22.4. Nichols plc (Vimto)
22.4.1. Overview
22.4.2. Product Portfolio
22.4.3. Production Footprint
22.4.4. Sales Footprint
22.4.5. Channel Footprint
22.4.6. Strategy Overview
22.4.7. Marketing Strategy
22.4.8. SWOT Analysis
22.4.9. Financial Analysis
22.5. Dr Pepper Snapple Group (Schweppes)
22.5.1. Overview
22.5.2. Product Portfolio
22.5.3. Production Footprint
22.5.4. Sales Footprint
22.5.5. Channel Footprint
22.5.6. Strategy Overview
22.5.7. Marketing Strategy
22.5.8. SWOT Analysis
22.5.9. Financial Analysis
22.6. Unilever plc (Kissan)
22.6.1. Overview
22.6.2. Product Portfolio
22.6.3. Production Footprint
22.6.4. Sales Footprint
22.6.5. Channel Footprint
22.6.6. Strategy Overview
22.6.7. Marketing Strategy
22.6.8. SWOT Analysis
22.6.9. Financial Analysis
22.7. Prigat
22.7.1. Overview
22.7.2. Product Portfolio
22.7.3. Production Footprint
22.7.4. Sales Footprint
22.7.5. Channel Footprint
22.7.6. Strategy Overview
22.7.7. Marketing Strategy
22.7.8. SWOT Analysis
22.7.9. Financial Analysis
22.8. PepsiCo, Inc (Tropicana)
22.8.1. Overview
22.8.2. Product Portfolio
22.8.3. Production Footprint
22.8.4. Sales Footprint
22.8.5. Channel Footprint
22.8.6. Strategy Overview
22.8.7. Marketing Strategy
22.8.8. SWOT Analysis
22.8.9. Financial Analysis
22.9. Suntory group (Lucozade Ribena Suntory Ltd.)
22.9.1. Overview
22.9.2. Product Portfolio
22.9.3. Production Footprint
22.9.4. Sales Footprint
22.9.5. Channel Footprint
22.9.6. Strategy Overview
22.9.7. Marketing Strategy
22.9.8. SWOT Analysis
22.9.9. Financial Analysis
22.10. Carlsberg Breweries A/S (Tuborg Squash)
22.10.1. Overview
22.10.2. Product Portfolio
22.10.3. Production Footprint
22.10.4. Sales Footprint
22.10.5. Channel Footprint
22.10.6. Strategy Overview
22.10.7. Marketing Strategy
22.10.8. SWOT Analysis
22.10.9. Financial Analysis
22.11. Harboe's Brewery (Harboe Squash Light)
22.11.1. Overview
22.11.2. Product Portfolio
22.11.3. Production Footprint
22.11.4. Sales Footprint
22.11.5. Channel Footprint
22.11.6. Strategy Overview
22.11.7. Marketing Strategy
22.11.8. SWOT Analysis
22.11.9. Financial Analysis
22.12. The Coca-Cola Company
22.12.1. Overview
22.12.2. Product Portfolio
22.12.3. Production Footprint
22.12.4. Sales Footprint
22.12.5. Channel Footprint
22.12.6. Strategy Overview
22.12.7. Marketing Strategy
22.12.8. SWOT Analysis
22.12.9. Financial Analysis
22.13. Belvoir Fruit Farms Ltd.
22.13.1. Overview
22.13.2. Product Portfolio
22.13.3. Production Footprint
22.13.4. Sales Footprint
22.13.5. Channel Footprint
22.13.6. Strategy Overview
22.13.7. Marketing Strategy
22.13.8. SWOT Analysis
22.13.9. Financial Analysis
22.14. Others on Request
23. Recommendation- Critical Success Factors
24. Assumptions & Acronyms Used
25. Research Methodology
List of Tables
Table 1: Squash Drinks Market Value (US$ Mn) Analysis and Forecast by Region, 2019-2029
Table 2: Squash Drinks Market Volume ('000) Analysis and Forecast by Region, 2019-2029
Table 3: Squash Drinks Market Value (US$ Mn) Analysis and Forecast by Product Type, 2019-2029
Table 4: Squash Drinks Market Volume ('000) Analysis and Forecast by Product Type, 2019-2029
Table 5: Squash Drinks Market Value (US$ Mn) Analysis and Forecast by Nature, 2019-2029
Table 6: Squash Drinks Market Volume ('000) Analysis and Forecast by Nature, 2019-2029
Table 7: Squash Drinks Market Value (US$ Mn) Analysis and Forecast by Base Type, 2019-2029
Table 8: Squash Drinks Market Volume (‘000) Analysis and Forecast by Base Type, 2019-2029
Table 9: Squash Drinks Market Volume ('000) Analysis and Forecast by Distribution Channel, 2019-2029
Table 10: Squash Drinks Market Value (US$ Mn) Analysis and Forecast by Distribution Channel, 2019-2029
Table 11: Squash Drinks Market Value (US$ Mn) Analysis and Forecast by Country, 2019-2029
Table 12: Squash Drinks Market Volume ('000) Analysis and Forecast by Country, 2019-2029
Table 13: Squash Drinks Market Value (US$ Mn) Analysis and Forecast by Product Type, 2019-2029
Table 14: Squash Drinks Market Volume ('000) Analysis and Forecast by Product Type, 2019-2029
Table 15: Squash Drinks Market Value (US$ Mn) Analysis and Forecast by Nature, 2019-2029
Table 16: Squash Drinks Market Volume ('000) Analysis and Forecast by Nature, 2019-2029
Table 17: Squash Drinks Market Value (US$ Mn) Analysis and Forecast by Base Type, 2019-2029
Table 18: Squash Drinks Market Volume (‘000) Analysis and Forecast by Base Type, 2019-2029
Table 19: Squash Drinks Market Volume ('000) Analysis and Forecast by Distribution Channel, 2019-2029
Table 20: Squash Drinks Market Value (US$ Mn) Analysis and Forecast by Distribution Channel, 2019-2029
Table 21: Squash Drinks Market Value (US$ Mn) Analysis and Forecast by Country, 2019-2029
Table 22: Squash Drinks Market Volume ('000) Analysis and Forecast by Country, 2019-2029
Table 23: Squash Drinks Market Value (US$ Mn) Analysis and Forecast by Product Type, 2019-2029
Table 24: Squash Drinks Market Volume ('000) Analysis and Forecast by Product Type, 2019-2029
Table 25: Squash Drinks Market Value (US$ Mn) Analysis and Forecast by Nature, 2019-2029
Table 26: Squash Drinks Market Volume ('000) Analysis and Forecast by Nature, 2019-2029
Table 27: Squash Drinks Market Value (US$ Mn) Analysis and Forecast by Base Type, 2019-2029
Table 28: Squash Drinks Market Volume (‘000) Analysis and Forecast by Base Type, 2019-2029
Table 29: Squash Drinks Market Volume ('000) Analysis and Forecast by Distribution Channel, 2019-2029
Table 30: Squash Drinks Market Value (US$ Mn) Analysis and Forecast by Distribution Channel, 2019-2029
Table 31: Squash Drinks Market Value (US$ Mn) Analysis and Forecast by Country, 2019-2029
Table 32: Squash Drinks Market Volume ('000) Analysis and Forecast by Country, 2019-2029
Table 33: Squash Drinks Market Value (US$ Mn) Analysis and Forecast by Product Type, 2019-2029
Table 34: Squash Drinks Market Volume ('000) Analysis and Forecast by Product Type, 2019-2029
Table 35: Squash Drinks Market Value (US$ Mn) Analysis and Forecast by Nature, 2019-2029
Table 36: Squash Drinks Market Volume ('000) Analysis and Forecast by Nature, 2019-2029
Table 37: Squash Drinks Market Value (US$ Mn) Analysis and Forecast by Base Type, 2019-2029
Table 38: Squash Drinks Market Volume (‘000) Analysis and Forecast by Base Type, 2019-2029
Table 39: Squash Drinks Market Volume ('000) Analysis and Forecast by Distribution Channel, 2019-2029
Table 40: Squash Drinks Market Value (US$ Mn) Analysis and Forecast by Distribution Channel, 2019-2029
Table 41: Squash Drinks Market Value (US$ Mn) Analysis and Forecast by Country, 2019-2029
Table 42: Squash Drinks Market Volume ('000) Analysis and Forecast by Country, 2019-2029
Table 43: Squash Drinks Market Value (US$ Mn) Analysis and Forecast by Product Type, 2019-2029
Table 44: Squash Drinks Market Volume ('000) Analysis and Forecast by Product Type, 2019-2029
Table 45: Squash Drinks Market Value (US$ Mn) Analysis and Forecast by Nature, 2019-2029
Table 46: Squash Drinks Market Volume ('000) Analysis and Forecast by Nature, 2019-2029
Table 47: Squash Drinks Market Value (US$ Mn) Analysis and Forecast by Base Type, 2019-2029
Table 48: Squash Drinks Market Volume (‘000) Analysis and Forecast by Base Type, 2019-2029
Table 49: Squash Drinks Market Volume ('000) Analysis and Forecast by Distribution Channel, 2019-2029
Table 50: Squash Drinks Market Value (US$ Mn) Analysis and Forecast by Distribution Channel, 2019-2029
Table 51: Squash Drinks Market Value (US$ Mn) Analysis and Forecast by Country, 2019-2029
Table 52: Squash Drinks Market Volume ('000) Analysis and Forecast by Country, 2019-2029
Table 53: Squash Drinks Market Value (US$ Mn) Analysis and Forecast by Product Type, 2019-2029
Table 54: Squash Drinks Market Volume ('000) Analysis and Forecast by Product Type, 2019-2029
Table 55: Squash Drinks Market Value (US$ Mn) Analysis and Forecast by Nature, 2019-2029
Table 56: Squash Drinks Market Volume ('000) Analysis and Forecast by Nature, 2019-2029
Table 57: Squash Drinks Market Value (US$ Mn) Analysis and Forecast by Base Type, 2019-2029
Table 58: Squash Drinks Market Volume (‘000) Analysis and Forecast by Base Type, 2019-2029
Table 59: Squash Drinks Market Volume ('000) Analysis and Forecast by Distribution Channel, 2019-2029
Table 60: Squash Drinks Market Value (US$ Mn) Analysis and Forecast by Distribution Channel, 2019-2029
Table 61: Squash Drinks Market Value (US$ Mn) Analysis and Forecast by Country, 2019-2029
Table 62: Squash Drinks Market Volume ('000) Analysis and Forecast by Country, 2019-2029
Table 63: Squash Drinks Market Value (US$ Mn) Analysis and Forecast by Product Type, 2019-2029
Table 64: Squash Drinks Market Volume ('000) Analysis and Forecast by Product Type, 2019-2029
Table 65: Squash Drinks Market Value (US$ Mn) Analysis and Forecast by Nature, 2019-2029
Table 66: Squash Drinks Market Volume ('000) Analysis and Forecast by Nature, 2019-2029
Table 67: Squash Drinks Market Value (US$ Mn) Analysis and Forecast by Base Type, 2019-2029
Table 68: Squash Drinks Market Volume (‘000) Analysis and Forecast by Base Type, 2019-2029
Table 69: Squash Drinks Market Volume ('000) Analysis and Forecast by Distribution Channel, 2019-2029
Table 70: Squash Drinks Market Value (US$ Mn) Analysis and Forecast by Distribution Channel, 2019-2029
Table 71: Squash Drinks Market Value (US$ Mn) Analysis and Forecast by Country, 2019-2029
Table 72: Squash Drinks Market Volume ('000) Analysis and Forecast by Country, 2019-2029
Table 73: Squash Drinks Market Value (US$ Mn) Analysis and Forecast by Product Type, 2019-2029
Table 74: Squash Drinks Market Volume ('000) Analysis and Forecast by Product Type, 2019-2029
Table 75: Squash Drinks Market Value (US$ Mn) Analysis and Forecast by Nature, 2019-2029
Table 76: Squash Drinks Market Volume ('000) Analysis and Forecast by Nature, 2019-2029
Table 77: Squash Drinks Market Value (US$ Mn) Analysis and Forecast by Base Type, 2019-2029
Table 78: Squash Drinks Market Volume (‘000) Analysis and Forecast by Base Type, 2019-2029
Table 79: Squash Drinks Market Volume ('000) Analysis and Forecast by Distribution Channel, 2019-2029
Table 80: Squash Drinks Market Value (US$ Mn) Analysis and Forecast by Distribution Channel, 2019-2029
List of Figures
Figure 01: Global Squash Drinks Market Value Share (%) and BPS Analysis by Region, 2014, 2019 & 2029
Figure 02: Global Squash Drinks Market Y-o-Y Analysis by Region, 2019 & 2029
Figure 03: Global Squash Drinks Market Attractiveness, by Region, 2019 to 2029
Figure 04: Global Squash Drinks Market Value Share (%) and BPS Analysis by Product Type, 2014, 2019 & 2029
Figure 05: Global Squash Drinks Market Y-o-Y Analysis by Product Type, 2019 & 2029
Figure 06: Global Squash Drinks Market Attractiveness, by Product Type, 2019 to 2029
Figure 07: Global Squash Drinks Market Value Share (%) and BPS Analysis by Nature, 2014, 2019 & 2029
Figure 08: Global Squash Drinks Market Y-o-Y Analysis by Nature, 2019 & 2029
Figure 09: Global Squash Drinks Market Attractiveness, by Nature, 2019 to 2029
Figure 10: Global Squash Drinks Market Value Share (%) and BPS Analysis by Base Type, 2014, 2019 & 2029
Figure 11: Global Squash Drinks Market Y-o-Y Analysis by Base Type, 2019 & 2029
Figure 12: Global Squash Drinks Market Attractiveness, by Base Type, 2019 to 2029
Figure 13: Global Squash Drinks Market Value Share (%) and BPS Analysis by Distribution Channel, 2014, 2019 & 2029
Figure 14: Global Squash Drinks Market Y-o-Y Analysis by Distribution Channel, 2019 & 2029
Figure 15: Global Squash Drinks Market Attractiveness, by Distribution Channel, 2019 to 2029
Figure 16: North America Squash Drinks Market Value Share (%) and BPS Analysis by Country, 2014, 2019 & 2029
Figure 17: North America Squash Drinks Market Y-o-Y Analysis by Country, 2019 & 2029
Figure 18: North America Squash Drinks Market Attractiveness, by Country, 2019 to 2029
Figure 19: North America Squash Drinks Market Value Share (%) and BPS Analysis by Product Type, 2014, 2019 & 2029
Figure 20: North America Squash Drinks Market Y-o-Y Analysis by Product Type, 2019 & 2029
Figure 21: North America Squash Drinks Market Attractiveness, by Product Type, 2019 to 2029
Figure 22: North America Squash Drinks Market Value Share (%) and BPS Analysis by Nature, 2014, 2019 & 2029
Figure 23: North America Squash Drinks Market Y-o-Y Analysis by Nature, 2019 & 2029
Figure 24: North America Squash Drinks Market Attractiveness, by Nature, 2019 to 2029
Figure 25: North America Squash Drinks Market Value Share (%) and BPS Analysis by Base Type, 2014, 2019 & 2029
Figure 26: North America Squash Drinks Market Y-o-Y Analysis by Base Type, 2019 & 2029
Figure 27: North America Squash Drinks Market Attractiveness, by Base Type, 2019 to 2029
Figure 28: North America Squash Drinks Market Value Share (%) and BPS Analysis by Distribution Channel, 2014, 2019 & 2029
Figure 29: North America Squash Drinks Market Y-o-Y Analysis by Distribution Channel, 2019 & 2029
Figure 30: North America Squash Drinks Market Attractiveness, by Distribution Channel, 2019 to 2029
Figure 31: Latin America Squash Drinks Market Value Share (%) and BPS Analysis by Country, 2014, 2019 & 2029
Figure 32: Latin America Squash Drinks Market Y-o-Y Analysis by Country, 2019 & 2029
Figure 33: Latin America Squash Drinks Market Attractiveness, by Country, 2019 to 2029
Figure 34: Latin America Squash Drinks Market Value Share (%) and BPS Analysis by Product Type, 2014, 2019 & 2029
Figure 35: Latin America Squash Drinks Market Y-o-Y Analysis by Product Type, 2019 & 2029
Figure 36: Latin America Squash Drinks Market Attractiveness, by Product Type, 2019 to 2029
Figure 37: Latin America Squash Drinks Market Value Share (%) and BPS Analysis by Nature, 2014, 2019 & 2029
Figure 38: Latin America Squash Drinks Market Y-o-Y Analysis by Nature, 2019 & 2029
Figure 39: Latin America Squash Drinks Market Attractiveness, by Nature, 2019 to 2029
Figure 40: Latin America Squash Drinks Market Value Share (%) and BPS Analysis by Base Type, 2014, 2019 & 2029
Figure 41: Latin America Squash Drinks Market Y-o-Y Analysis by Base Type, 2019 & 2029
Figure 42: Latin America Squash Drinks Market Attractiveness, by Base Type, 2019 to 2029
Figure 43: Latin America Squash Drinks Market Value Share (%) and BPS Analysis by Distribution Channel, 2014, 2019 & 2029
Figure 44: Latin America Squash Drinks Market Y-o-Y Analysis by Distribution Channel, 2019 & 2029
Figure 45: Latin America Squash Drinks Market Attractiveness, by Distribution Channel, 2019 to 2029
Figure 46: Europe Squash Drinks Market Value Share (%) and BPS Analysis by Country, 2014, 2019 & 2029
Figure 47: Europe Squash Drinks Market Y-o-Y Analysis by Country, 2019 & 2029
Figure 48: Europe Squash Drinks Market Attractiveness, by Country, 2019 to 2029
Figure 49: Europe Squash Drinks Market Value Share (%) and BPS Analysis by Product Type, 2014, 2019 & 2029
Figure 50: Europe Squash Drinks Market Y-o-Y Analysis by Product Type, 2019 & 2029
Figure 51: Europe Squash Drinks Market Attractiveness, by Product Type, 2019 to 2029
Figure 52: Europe Squash Drinks Market Value Share (%) and BPS Analysis by Nature, 2014, 2019 & 2029
Figure 53: Europe Squash Drinks Market Y-o-Y Analysis by Nature, 2019 & 2029
Figure 54: Europe Squash Drinks Market Attractiveness, by Nature, 2019 to 2029
Figure 55: Europe Squash Drinks Market Value Share (%) and BPS Analysis by Base Type, 2014, 2019 & 2029
Figure 56: Europe Squash Drinks Market Y-o-Y Analysis by Base Type, 2019 & 2029
Figure 57: Europe Squash Drinks Market Attractiveness, by Base Type, 2019 to 2029
Figure 58: Europe Squash Drinks Market Value Share (%) and BPS Analysis by Distribution Channel, 2014, 2019 & 2029
Figure 59: Europe Squash Drinks Market Y-o-Y Analysis by Distribution Channel, 2019 & 2029
Figure 60: Europe Squash Drinks Market Attractiveness, by Distribution Channel, 2019 to 2029
Figure 61: East Asia Squash Drinks Market Value Share (%) and BPS Analysis by Country, 2014, 2019 & 2029
Figure 62: East Asia Squash Drinks Market Y-o-Y Analysis by Country, 2019 & 2029
Figure 63: East Asia Squash Drinks Market Attractiveness, by Country, 2019 to 2029
Figure 64: East Asia Squash Drinks Market Value Share (%) and BPS Analysis by Product Type, 2014, 2019 & 2029
Figure 65: East Asia Squash Drinks Market Y-o-Y Analysis by Product Type, 2019 & 2029
Figure 66: East Asia Squash Drinks Market Attractiveness, by Product Type, 2019 to 2029
Figure 67: East Asia Squash Drinks Market Value Share (%) and BPS Analysis by Nature, 2014, 2019 & 2029
Figure 68: East Asia Squash Drinks Market Y-o-Y Analysis by Nature, 2019 & 2029
Figure 69: East Asia Squash Drinks Market Attractiveness, by Nature, 2019 to 2029
Figure 70: East Asia Squash Drinks Market Value Share (%) and BPS Analysis by Base Type, 2014, 2019 & 2029
Figure 71: East Asia Squash Drinks Market Y-o-Y Analysis by Base Type, 2019 & 2029
Figure 72: East Asia Squash Drinks Market Attractiveness, by Base Type, 2019 to 2029
Figure 73: East Asia Squash Drinks Market Value Share (%) and BPS Analysis by Distribution Channel, 2014, 2019 & 2029
Figure 74: East Asia Squash Drinks Market Y-o-Y Analysis by Distribution Channel, 2019 & 2029
Figure 75: East Asia Squash Drinks Market Attractiveness, by Distribution Channel, 2019 to 2029
Figure 76: South Asia Squash Drinks Market Value Share (%) and BPS Analysis by Country, 2014, 2019 & 2029
Figure 77: South Asia Squash Drinks Market Y-o-Y Analysis by Country, 2019 & 2029
Figure 78: South Asia Squash Drinks Market Attractiveness, by Country, 2019 to 2029
Figure 79: South Asia Squash Drinks Market Value Share (%) and BPS Analysis by Product Type, 2014, 2019 & 2029
Figure 80: South Asia Squash Drinks Market Y-o-Y Analysis by Product Type, 2019 & 2029
Figure 81: South Asia Squash Drinks Market Attractiveness, by Product Type, 2019 to 2029
Figure 82: South Asia Squash Drinks Market Value Share (%) and BPS Analysis by Nature, 2014, 2019 & 2029
Figure 83: South Asia Squash Drinks Market Y-o-Y Analysis by Nature, 2019 & 2029
Figure 84: South Asia Squash Drinks Market Attractiveness, by Nature, 2019 to 2029
Figure 85: South Asia Squash Drinks Market Value Share (%) and BPS Analysis by Base Type, 2014, 2019 & 2029
Figure 86: South Asia Squash Drinks Market Y-o-Y Analysis by Base Type, 2019 & 2029
Figure 87: South Asia Squash Drinks Market Attractiveness, by Base Type, 2019 to 2029
Figure 88: South Asia Squash Drinks Market Value Share (%) and BPS Analysis by Distribution Channel, 2014, 2019 & 2029
Figure 89: South Asia Squash Drinks Market Y-o-Y Analysis by Distribution Channel, 2019 & 2029
Figure 90: South Asia Squash Drinks Market Attractiveness, by Distribution Channel, 2019 to 2029
Figure 91: Oceania Squash Drinks Market Value Share (%) and BPS Analysis by Country, 2014, 2019 & 2029
Figure 92: Oceania Squash Drinks Market Y-o-Y Analysis by Country, 2019 & 2029
Figure 93: Oceania Squash Drinks Market Attractiveness, by Country, 2019 to 2029
Figure 94: Oceania Squash Drinks Market Value Share (%) and BPS Analysis by Product Type, 2014, 2019 & 2029
Figure 95: Oceania Squash Drinks Market Y-o-Y Analysis by Product Type, 2019 & 2029
Figure 96: Oceania Squash Drinks Market Attractiveness, by Product Type, 2019 to 2029
Figure 97: Oceania Squash Drinks Market Value Share (%) and BPS Analysis by Nature, 2014, 2019 & 2029
Figure 98: Oceania Squash Drinks Market Y-o-Y Analysis by Nature, 2019 & 2029
Figure 99: Oceania Squash Drinks Market Attractiveness, by Nature, 2019 to 2029
Figure 100: Oceania Squash Drinks Market Value Share (%) and BPS Analysis by Base Type, 2014, 2019 & 2029
Figure 101: Oceania Squash Drinks Market Y-o-Y Analysis by Base Type, 2019 & 2029
Figure 102: Oceania Squash Drinks Market Attractiveness, by Base Type, 2019 to 2029
Figure 103: Oceania Squash Drinks Market Value Share (%) and BPS Analysis by Distribution Channel, 2014, 2019 & 2029
Figure 104: Oceania Squash Drinks Market Y-o-Y Analysis by Distribution Channel, 2019 & 2029
Figure 105: Oceania Squash Drinks Market Attractiveness, by Distribution Channel, 2019 to 2029
Figure 106: Middle East & Africa Squash Drinks Market Value Share (%) and BPS Analysis by Country, 2014, 2019 & 2029
Figure 107: Middle East & Africa Squash Drinks Market Y-o-Y Analysis by Country, 2019 & 2029
Figure 108: Middle East & Africa Squash Drinks Market Attractiveness, by Country, 2019 to 2029
Figure 109: Middle East & Africa Squash Drinks Market Value Share (%) and BPS Analysis by Product Type, 2014, 2019 & 2029
Figure 110: Middle East & Africa Squash Drinks Market Y-o-Y Analysis by Product Type, 2019 & 2029
Figure 111: Middle East & Africa Squash Drinks Market Attractiveness, by Product Type, 2019 to 2029
Figure 112: Middle East & Africa Squash Drinks Market Value Share (%) and BPS Analysis by Nature, 2014, 2019 & 2029
Figure 113: Middle East & Africa Squash Drinks Market Y-o-Y Analysis by Nature, 2019 & 2029
Figure 114: Middle East & Africa Squash Drinks Market Attractiveness, by Nature, 2019 to 2029
Figure 115: Middle East & Africa Squash Drinks Market Value Share (%) and BPS Analysis by Base Type, 2014, 2019 & 2029
Figure 116: Middle East & Africa Squash Drinks Market Y-o-Y Analysis by Base Type, 2019 & 2029
Figure 117: Middle East & Africa Squash Drinks Market Attractiveness, by Base Type, 2019 to 2029
Figure 118: Middle East & Africa Squash Drinks Market Value Share (%) and BPS Analysis by Distribution Channel, 2014, 2019 & 2029
Figure 119: Middle East & Africa Squash Drinks Market Y-o-Y Analysis by Distribution Channel, 2019 & 2029
Figure 120: Middle East & Africa Squash Drinks Market Attractiveness, by Distribution Channel, 2019 to 2029
Copyright © Transparency Market Research, Inc. All Rights reserved
Trust Online

Squash Drinks Market