
Reports
Reports
Analysts’ Viewpoint on Global Recycled PET (r-PET) Bottles Market Scenario
Companies operating in the recycled PET (r-PET) bottles market are focusing on key industries, such as food & beverage and packaging, in order to keep their businesses growing. Increase in health issues and awareness about the importance of safe drinking water is anticipated to boost production capacities to cater to the rising demand for r-PET bottles. Various companies are likely to include r-PET resins in their PET bottles. Accordingly, most of the bottles would be made of 25% r-PET and 75% PET, or of complete r-PET in the near future. Manufacturers are collaborating with well-established transportation and logistics companies to deliver products in stipulated time in order to remain competitive in the market. Moreover, manufacturers are also investing in the development of quality products to consolidate their position in the global market.
Polyethylene terephthalate, also called PET, is the name of a type of clear, strong, lightweight, and 100% recyclable plastic. Unlike other types of plastic, PET is not a single use plastic. PET is 100% recyclable, versatile, and manufactured to be remade. PET is the most widely recycled plastic. PET plastic and containers are commonly melted down and spun into fibers for fiber fill or carpets. When collected in a suitably pure state, plastic bottles can be recycled into their original form, and methods have been devised for breaking the polymer down into its chemical precursors for resynthesizing into PET.
Recycled PET (r-PET) can be used to make several new products, including polyester staple fiber or filament used for apparel (clothing), home textiles (duvets, pillows, carpeting), automotive parts (carpets, sound insulation, boot linings, seat covers) and industrial end-use items (geotextiles and roof insulation), and new PET packaging and bottles for both food and non-food products. It is generally blended in a ratio of virgin to recycled, depending on the application required.
Plastic is extensively utilized in the food & beverage industry for packaging, storing, carrying, or dispensing of food products. However, it is a matter of concern, as substances from the packaging are being transferred to the food in quantities that pose a risk to health, and the food is adversely affected in terms of taste, odor, and composition. Therefore, the demand for recycled plastics is increasing to overcome these challenges. Recycled PET is also popular for packaging salad dressings, peanut butter, cooking oils, mouthwash, shampoo, liquid hand soap, window cleaner, and even tennis balls. Special grades of recycled PET (r-PET) are used for carry-home food containers and prepared food trays that can be warmed in the oven or the microwave. Thus, need for recycled plastic, especially for use in food & beverage packaging, is steadily increasing.
The surge in population across the globe has boosted the demand for raw materials such as minerals, fossil fuels, biomass, and natural or synthetic materials. This has adversely affected the environment, primarily its biodiversity. Additionally, an increase in emission levels of carbon dioxide across the globe has led to changes in the Earth’s climatic condition. These factors have created an imbalance in the ecosystem, thereby giving rise to a concept called ‘circular economy’.
In 2015, the European Union published an action plan for transition to a circular economy. The plan states that manufacturers operating in the plastic packaging market in Europe are required to either reusable or recycled plastics in a cost-effective manner by 2030. The plan also focuses on reducing the consumption of single-use plastics as well as prohibiting the intentional usage of micro-plastics.
A circular economy seeks to replace the make-use-dispose economic model in order to extract the maximum value from products and materials through recycling, reusing, and upcycling. According to the Ellen MacArthur Foundation, the adoption of the circular economy across the globe can result in a decline in material consumption by 32% by 2030 and 53% by 2050.
PET offers attractive opportunities for the replacement of existing products, which are manufactured using recyclable materials or advanced technologies. Additionally, expansion of infrastructure facilities for recycling of post-consumer products into food-grade r-PET has resulted into sufficient availability of materials to manufacture new bottles.
In terms of grade, the global recycled PET (r-PET) bottles market has been classified into food grade and non-food grade recycled PET (r-PET) bottles. The food grade segment held a large share of 92.2% in 2021. The segment is anticipated to grow at a CAGR of 9.6% by 2031. Food grade r-PET plastic bottles are light in weight. The material is also stable and biologically inert. It does not react with foods or beverages. Furthermore, it offers excellent resistance to microorganisms.
Food grade r-PET bottles are utilized in the manufacture of beverage bottles and food trays. According to a study carried out by joint Swiss-German under the EUROENVIRON-DIMO project, about 50% of waste food-grade PET bottles are used for recycling in food packaging applications. Therefore, food-grade recycled PET (r-PET) bottles is expected to dominate the global market.
In terms of region, Asia Pacific held a notable share of 42.2% of the global recycled PET (r-PET) bottles market in 2021. Its share is anticipated to rise to reach 44.4% of the market by 2031. The high share can be ascribed to the presence of a large number of regulations across the region.
North America also accounted for a key share of the global market in 2021. The market in the region is dominated by a large number of manufacturers and producers of technologies.
Manufacturers operating in the r-PET market in Europe need to conform to several regulations. The market share held by Latin America is anticipated to decline by the end of the forecast period, owing to the presence of fewer manufacturers in the region.
The global recycled PET (r-PET) bottles market is highly consolidated, with a small number of large-scale vendors controlling majority of the share. Most companies are investing considerably in comprehensive research and development activities, primarily to create environment-friendly products. Diversification of product portfolios and mergers & acquisitions are key strategies adopted by prominent players, which include Indorama Ventures Public Company Ltd., Alpha Werke Alwin Lehner GmbH & Co KG, Pheonix Technologies International LLC, CarbonLITE Industries LLC, and Vanden Global Ltd.
Each of these players has been profiled in the recycled PET (r-PET) bottles market report based on parameters such as company overview, financial overview, business strategies, product portfolio, business segments, and recent developments.
|
Attribute |
Detail |
|
Market Size Value in 2021 |
US$ 1.9 Bn |
|
Market Forecast Value in 2031 |
US$ 4.3 Bn |
|
Growth Rate (CAGR) |
9.6% |
|
Forecast Period |
2022–2031 |
|
Historical Data Available for |
2020 |
|
Quantitative Units |
US$ Bn for Value and Thousand Tons for Volume |
|
Market Analysis |
It includes cross-segment analysis at the global as well as regional level. Furthermore, the qualitative analysis includes drivers, restraints, opportunities, key trends, Porter’s Five Forces analysis, value chain analysis, and key trend analysis. |
|
Competition Landscape |
|
|
Format |
Electronic (PDF) + Excel |
|
Market Segmentation |
|
|
Regions Covered |
|
|
Countries Covered |
|
|
Companies Profiled |
|
|
Customization Scope |
Available upon request |
|
Pricing |
Available upon request |
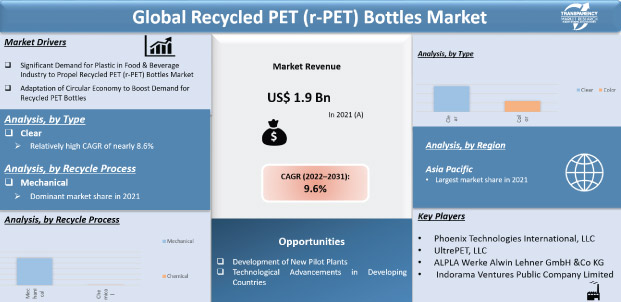
The market stood at US$ 1.9 Bn in 2021.
The market is expected to grow at a CAGR of 9.6% from 2022 to 2031.
High demand for plastic in the food & beverage industry and adoption of circular economy to boost the demand for recycled pet bottles.
Food grade was the largest segment that held 92.1% share in 2021.
Asia Pacific was the most lucrative region of the recycled PET (r-PET) bottles market in 2021.
Phoenix Technologies International, LLC, UltrePET LLC, ALPLA Werke Alwin Lehner GmbH & Co KG, Indorama Ventures Public Company Limited, CarbonLITE Industries LLC, and Verdeco Recycling, Inc.
1. Executive Summary
1.1. Recycled PET (r-PET) Bottles Market Snapshot
1.2. Current Market and Future Potential
2. Market Overview
2.1. Market Segmentation
2.2. Market Trends
2.3. Market Dynamics
2.3.1. Drivers
2.3.2. Restraints
2.3.3. Opportunities
2.4. Porter’s Five Forces Analysis
2.5. Regulatory Analysis
2.6. Value Chain Analysis
2.6.1. List of Raw Material Providers
2.6.2. List of Key Manufacturers
2.6.3. List of Suppliers/Distributors
2.6.4. List of Potential Customers
2.6.5. Production Overview/Route of Synthesis
3. COVID-19 Impact Analysis
4. Production Output Analysis, 2021
5. Price Trend Analysis
6. Global Recycled PET (r-PET) Bottles Market Analysis and Forecast, by Grade, 2020–2031
6.1. Introduction and Definitions
6.2. Global Recycled PET (r-PET) Bottles Market Volume (Thousand Tons) and Value (US$ Bn) Forecast, by Grade, 2020–2031
6.2.1. Food
6.2.2. Non-food
6.3. Global Recycled PET (r-PET) Bottles Market Attractiveness, by Grade
7. Global Recycled PET (r-PET) Bottles Market Analysis and Forecast, by Type, 2020–2031
7.1. Introduction and Definitions
7.2. Global Recycled PET (r-PET) Bottles Market Volume (Thousand Tons) and Value (US$ Bn) Forecast, by Type, 2020–2031
7.2.1. Clear
7.2.2. Color
7.3. Global Recycled PET (r-PET) Bottles Market Attractiveness, by Type
8. Global Recycled PET (r-PET) Bottles Market Analysis and Forecast, by Recycle Process, 2020–2031
8.1. Introduction and Definitions
8.2. Global Recycled PET (r-PET) Bottles Market Volume (Thousand Tons) and Value (US$ Bn) Forecast, by Recycle Process, 2020–2031
8.2.1. Mechanical
8.2.2. Chemical
8.3. Global Recycled PET (r-PET) Bottles Market Attractiveness, by Recycle Process
9. Global Recycled PET (r-PET) Bottles Market Analysis and Forecast, by Region, 2020–2031
9.1. Key Findings
9.2. Global Recycled PET (r-PET) Bottles Market Volume (Thousand Tons) and Value (US$ Bn) Forecast, by Region, 2020–2031
9.2.1. North America
9.2.2. Europe
9.2.3. Asia Pacific
9.2.4. Middle East & Africa
9.2.5. Latin America
9.3. Global Recycled PET (r-PET) Bottles Market Attractiveness, by Region
10. North America Recycled PET (r-PET) Bottles Market Analysis and Forecast, 2020–2031
10.1. Key Findings
10.2. North America Recycled PET (r-PET) Bottles Market Volume (Thousand Tons) and Value (US$ Bn) Forecast, by Grade, 2020–2031
10.3. North America Recycled PET (r-PET) Bottles Market Volume (Thousand Tons) and Value (US$ Bn) Forecast, by Type, 2020–2031
10.4. North America Recycled PET (r-PET) Bottles Market Volume (Thousand Tons) and Value (US$ Bn) Forecast, by Recycle Process, 2020–2031
10.5. North America Recycled PET (r-PET) Bottles Market Volume (Thousand Tons) and Value (US$ Bn) Forecast, by Country, 2020–2031
10.5.1. U.S. Recycled PET (r-PET) Bottles Market Volume (Thousand Tons) and Value (US$ Bn) Forecast, by Grade, 2020–2031
10.5.2. U.S. Recycled PET (r-PET) Bottles Market Volume (Thousand Tons) and Value (US$ Bn) Forecast, by Type, 2020–2031
10.5.3. U.S. Recycled PET (r-PET) Bottles Market Volume (Thousand Tons) and Value (US$ Bn) Forecast, by Recycle Process, 2020–2031
10.5.4. Canada Recycled PET (r-PET) Bottles Market Volume (Thousand Tons) and Value (US$ Bn) Forecast, by Grade, 2020–2031
10.5.5. Canada Recycled PET (r-PET) Bottles Market Volume (Thousand Tons) and Value (US$ Bn) Forecast, by Type, 2020–2031
10.5.6. Canada Recycled PET (r-PET) Bottles Market Volume (Thousand Tons) and Value (US$ Bn) Forecast, by Recycle Process, 2020–2031
10.6. North America Recycled PET (r-PET) Bottles Market Attractiveness Analysis
11. Europe Recycled PET (r-PET) Bottles Market Analysis and Forecast, 2020–2031
11.1. Key Findings
11.2. Europe Recycled PET (r-PET) Bottles Market Volume (Thousand Tons) and Value (US$ Bn) Forecast, by Grade, 2020–2031
11.3. Europe Recycled PET (r-PET) Bottles Market Volume (Thousand Tons) and Value (US$ Bn) Forecast, by Type, 2020–2031
11.4. Europe Recycled PET (r-PET) Bottles Market Volume (Thousand Tons) and Value (US$ Bn) Forecast, by Recycle Process, 2020–2031
11.5. Europe Recycled PET (r-PET) Bottles Market Volume (Thousand Tons) and Value (US$ Bn) Forecast, by Country and Sub-region, 2021-2031
11.5.1. Germany Recycled PET (r-PET) Bottles Market Volume (Thousand Tons) and Value (US$ Bn) Forecast, by Grade, 2020–2031
11.5.2. Germany Recycled PET (r-PET) Bottles Market Volume (Thousand Tons) and Value (US$ Bn) Forecast, by Type, 2020–2031
11.5.3. Germany Recycled PET (r-PET) Bottles Market Volume (Thousand Tons) and Value (US$ Bn) Forecast, by Recycle Process, 2020–2031
11.5.4. France Recycled PET (r-PET) Bottles Market Volume (Thousand Tons) and Value (US$ Bn) Forecast, by Grade, 2020–2031
11.5.5. France Recycled PET (r-PET) Bottles Market Volume (Thousand Tons) and Value (US$ Bn) Forecast, by Type, 2020–2031
11.5.6. France Recycled PET (r-PET) Bottles Market Volume (Thousand Tons) and Value (US$ Bn) Forecast, by Recycle Process, 2020–2031
11.5.7. U.K. Recycled PET (r-PET) Bottles Market Volume (Thousand Tons) and Value (US$ Bn) Forecast, by Grade, 2020–2031
11.5.8. U.K. Recycled PET (r-PET) Bottles Market Volume (Thousand Tons) and Value (US$ Bn) Forecast, by Type, 2020–2031
11.5.9. U.K. Recycled PET (r-PET) Bottles Market Volume (Thousand Tons) and Value (US$ Bn) Forecast, by Recycle Process, 2020–2031
11.5.10. Italy Recycled PET (r-PET) Bottles Market Volume (Thousand Tons) and Value (US$ Bn) Forecast, by Grade, 2020–2031
11.5.11. Italy Recycled PET (r-PET) Bottles Market Volume (Thousand Tons) and Value (US$ Bn) Forecast, by Type, 2020–2031
11.5.12. Italy Recycled PET (r-PET) Bottles Market Volume (Thousand Tons) and Value (US$ Bn) Forecast, by Recycle Process, 2020–2031
11.5.13. Spain Recycled PET (r-PET) Bottles Market Volume (Thousand Tons) and Value (US$ Bn) Forecast, by Grade, 2020–2031
11.5.14. Spain Recycled PET (r-PET) Bottles Market Volume (Thousand Tons) and Value (US$ Bn) Forecast, by Type, 2020–2031
11.5.15. Spain Recycled PET (r-PET) Bottles Market Volume (Thousand Tons) and Value (US$ Bn) Forecast, by Recycle Process, 2020–2031
11.5.16. Russia & CIS Recycled PET (r-PET) Bottles Market Volume (Thousand Tons) and Value (US$ Bn) Forecast, by Grade, 2020–2031
11.5.17. Russia & CIS Recycled PET (r-PET) Bottles Market Volume (Thousand Tons) and Value (US$ Bn) Forecast, by Type, 2020–2031
11.5.18. Russia & CIS Recycled PET (r-PET) Bottles Market Volume (Thousand Tons) and Value (US$ Bn) Forecast, by Recycle Process, 2020–2031
11.5.19. Rest of Europe Recycled PET (r-PET) Bottles Market Volume (Thousand Tons) and Value (US$ Bn) Forecast, by Grade, 2020–2031
11.5.20. Rest of Europe Recycled PET (r-PET) Bottles Market Volume (Thousand Tons) and Value (US$ Bn) Forecast, by Type, 2020–2031
11.5.21. Rest of Europe Recycled PET (r-PET) Bottles Market Volume (Thousand Tons) and Value (US$ Bn) Forecast, by Recycle Process, 2020–2031
11.6. Europe Recycled PET (r-PET) Bottles Market Attractiveness Analysis
12. Asia Pacific Recycled PET (r-PET) Bottles Market Analysis and Forecast, 2020–2031
12.1. Key Findings
12.2. Asia Pacific Recycled PET (r-PET) Bottles Market Volume (Thousand Tons) and Value (US$ Bn) Forecast, by Grade
12.3. Asia Pacific Recycled PET (r-PET) Bottles Market Volume (Thousand Tons) and Value (US$ Bn) Forecast, by Type, 2020–2031
12.4. Asia Pacific Recycled PET (r-PET) Bottles Market Volume (Thousand Tons) and Value (US$ Bn) Forecast, by Recycle Process, 2020–2031
12.5. Asia Pacific Recycled PET (r-PET) Bottles Market Volume (Thousand Tons) and Value (US$ Bn) Forecast, by Country and Sub-region, 2021-2031
12.5.1. China Recycled PET (r-PET) Bottles Market Volume (Thousand Tons) and Value (US$ Bn) Forecast, by Grade, 2020–2031
12.5.2. China Recycled PET (r-PET) Bottles Market Volume (Thousand Tons) and Value (US$ Bn) Forecast, by Type, 2020–2031
12.5.3. China Recycled PET (r-PET) Bottles Market Volume (Thousand Tons) and Value (US$ Bn) Forecast, by Recycle Process, 2020–2031
12.5.4. Japan Recycled PET (r-PET) Bottles Market Volume (Thousand Tons) and Value (US$ Bn) Forecast, by Grade, 2020–2031
12.5.5. Japan Recycled PET (r-PET) Bottles Market Volume (Thousand Tons) and Value (US$ Bn) Forecast, by Type, 2020–2031
12.5.6. Japan Recycled PET (r-PET) Bottles Market Volume (Thousand Tons) and Value (US$ Bn) Forecast, by Recycle Process, 2020–2031
12.5.7. India Recycled PET (r-PET) Bottles Market Volume (Thousand Tons) and Value (US$ Bn) Forecast, by Grade, 2020–2031
12.5.8. India Recycled PET (r-PET) Bottles Market Volume (Thousand Tons) and Value (US$ Bn) Forecast, by Type, 2020–2031
12.5.9. India Recycled PET (r-PET) Bottles Market Volume (Thousand Tons) and Value (US$ Bn) Forecast, by Recycle Process, 2020–2031
12.5.10. ASEAN Recycled PET (r-PET) Bottles Market Volume (Thousand Tons) and Value (US$ Bn) Forecast, by Grade, 2020–2031
12.5.11. ASEAN Recycled PET (r-PET) Bottles Market Volume (Thousand Tons) and Value (US$ Bn) Forecast, by Type, 2020–2031
12.5.12. ASEAN Recycled PET (r-PET) Bottles Market Volume (Thousand Tons) and Value (US$ Bn) Forecast, by Recycle Process, 2020–2031
12.5.13. South Korea Recycled PET (r-PET) Bottles Market Volume (Thousand Tons) and Value (US$ Bn) Forecast, by Grade, 2020–2031
12.5.14. South Korea Recycled PET (r-PET) Bottles Market Volume (Thousand Tons) and Value (US$ Bn) Forecast, by Type, 2020–2031
12.5.15. South Korea Recycled PET (r-PET) Bottles Market Volume (Thousand Tons) and Value (US$ Bn) Forecast, by Recycle Process, 2020–2031
12.5.16. Rest of Asia Pacific Recycled PET (r-PET) Bottles Market Volume (Thousand Tons) and Value (US$ Bn) Forecast, by Grade, 2020–2031
12.5.17. Rest of Asia Pacific Recycled PET (r-PET) Bottles Market Volume (Thousand Tons) and Value (US$ Bn) Forecast, by Type, 2020–2031
12.5.18. Rest of Asia Pacific Recycled PET (r-PET) Bottles Market Volume (Thousand Tons) and Value (US$ Bn) Forecast, by Recycle Process, 2020–2031
12.6. Asia Pacific Recycled PET (r-PET) Bottles Market Attractiveness Analysis
13. Latin America Recycled PET (r-PET) Bottles Market Analysis and Forecast, 2020–2031
13.1. Key Findings
13.2. Latin America Recycled PET (r-PET) Bottles Market Volume (Thousand Tons) and Value (US$ Bn) Forecast, by Grade, 2020–2031
13.3. Latin America Recycled PET (r-PET) Bottles Market Volume (Thousand Tons) and Value (US$ Bn) Forecast, by Type, 2020–2031
13.4. Latin America Recycled PET (r-PET) Bottles Market Volume (Thousand Tons) and Value (US$ Bn) Forecast, by Recycle Process, 2020–2031
13.5. Latin America Recycled PET (r-PET) Bottles Market Volume (Thousand Tons) and Value (US$ Bn) Forecast, by Country and Sub-region, 2021-2031
13.5.1. Brazil Recycled PET (r-PET) Bottles Market Volume (Thousand Tons) and Value (US$ Bn) Forecast, by Grade, 2020–2031
13.5.2. Brazil Recycled PET (r-PET) Bottles Market Volume (Thousand Tons) and Value (US$ Bn) Forecast, by Type, 2020–2031
13.5.3. Brazil Recycled PET (r-PET) Bottles Market Volume (Thousand Tons) and Value (US$ Bn) Forecast, by Recycle Process, 2020–2031
13.5.4. Mexico Recycled PET (r-PET) Bottles Market Volume (Thousand Tons) and Value (US$ Bn) Forecast, by Grade, 2020–2031
13.5.5. Mexico Recycled PET (r-PET) Bottles Market Volume (Thousand Tons) and Value (US$ Bn) Forecast, by Type, 2020–2031
13.5.6. Mexico Recycled PET (r-PET) Bottles Market Volume (Thousand Tons) and Value (US$ Bn) Forecast, by Recycle Process, 2020–2031
13.5.7. Rest of Latin America Recycled PET (r-PET) Bottles Market Volume (Thousand Tons) and Value (US$ Bn) Forecast, by Grade, 2020–2031
13.5.8. Rest of Latin America Recycled PET (r-PET) Bottles Market Volume (Thousand Tons) and Value (US$ Bn) Forecast, by Type, 2020–2031
13.5.9. Rest of Latin America Recycled PET (r-PET) Bottles Market Volume (Thousand Tons) and Value (US$ Bn) Forecast, by Recycle Process, 2020–2031
13.6. Latin America Recycled PET (r-PET) Bottles Market Attractiveness Analysis
14. Middle East & Africa Recycled PET (r-PET) Bottles Market Analysis and Forecast, 2020–2031
14.1. Key Findings
14.2. Middle East & Africa Recycled PET (r-PET) Bottles Market Volume (Thousand Tons) and Value (US$ Bn) Forecast, by Grade, 2020–2031
14.3. Middle East & Africa Recycled PET (r-PET) Bottles Market Volume (Thousand Tons) and Value (US$ Bn) Forecast, by Type, 2020–2031
14.4. Middle East & Africa Recycled PET (r-PET) Bottles Market Volume (Thousand Tons) and Value (US$ Bn) Forecast, by Recycle Process, 2020–2031
14.5. Middle East & Africa Recycled PET (r-PET) Bottles Market Volume (Thousand Tons) and Value (US$ Bn) Forecast, by Country and Sub-region, 2021-2031
14.5.1. GCC Recycled PET (r-PET) Bottles Market Volume (Thousand Tons) and Value (US$ Bn) Forecast, by Grade, 2020–2031
14.5.2. GCC Recycled PET (r-PET) Bottles Market Volume (Thousand Tons) and Value (US$ Bn) Forecast, by Type, 2020–2031
14.5.3. GCC Recycled PET (r-PET) Bottles Market Volume (Thousand Tons) and Value (US$ Bn) Forecast, by Recycle Process, 2020–2031
14.5.4. South Africa Recycled PET (r-PET) Bottles Market Volume (Thousand Tons) and Value (US$ Bn) Forecast, by Grade, 2020–2031
14.5.5. South Africa Recycled PET (r-PET) Bottles Market Volume (Thousand Tons) and Value (US$ Bn) Forecast, by Type, 2020–2031
14.5.6. South Africa Recycled PET (r-PET) Bottles Market Volume (Thousand Tons) and Value (US$ Bn) Forecast, by Recycle Process, 2020–2031
14.5.7. Rest of Middle East & Africa Recycled PET (r-PET) Bottles Market Volume (Thousand Tons) and Value (US$ Bn) Forecast, by Grade, 2020–2031
14.5.8. Rest of Middle East & Africa Recycled PET (r-PET) Bottles Market Volume (Thousand Tons) and Value (US$ Bn) Forecast, by Type, 2020–2031
14.5.9. Rest of Middle East & Africa Recycled PET (r-PET) Bottles Market Volume (Thousand Tons) and Value (US$ Bn) Forecast, by Recycle Process, 2020–2031
14.6. Middle East & Africa Recycled PET (r-PET) Bottles Market Attractiveness Analysis
15. Competition Landscape
15.1. Global Recycled PET (r-PET) Bottles Company Market Share Analysis, 2021
15.2. Company Profiles (Details – Overview, Financials, Recent Developments, and Strategy)
15.2.1. Extrupet Group (Pty) Ltd
15.2.1.1. Company Description
15.2.1.2. Business Overview
15.2.1.3. Financial Overview
15.2.1.4. Strategic Overview
15.2.2. CarbonLITE Industries LLC
15.2.2.1. Company Description
15.2.2.2. Business Overview
15.2.2.3. Financial Overview
15.2.2.4. Strategic Overview
15.2.3. Phoenix Technologies International, LLC
15.2.3.1. Company Description
15.2.3.2. Business Overview
15.2.3.3. Financial Overview
15.2.3.4. Strategic Overview
15.2.4. Vanden Global Ltd
15.2.4.1. Company Description
15.2.4.2. Business Overview
15.2.4.3. Financial Overview
15.2.4.4. Strategic Overview
15.2.5. UltrePET, LLC
15.2.5.1. Company Description
15.2.5.2. Business Overview
15.2.5.3. Financial Overview
15.2.5.4. Strategic Overview
15.2.6. Seiu Japan Co., Ltd
15.2.6.1. Company Description
15.2.6.2. Business Overview
15.2.6.3. Financial Overview
15.2.6.4. Strategic Overview
15.2.7. ALPLA Werke Alwin Lehner GmbH & Co KG
15.2.7.1. Company Description
15.2.7.2. Business Overview
15.2.7.3. Financial Overview
15.2.7.4. Strategic Overview
15.2.8. SEINAN Corporation.
15.2.8.1. Company Description
15.2.8.2. Business Overview
15.2.8.3. Financial Overview
15.2.8.4. Strategic Overview
15.2.9. Kuusakoski Oy
15.2.9.1. Company Description
15.2.9.2. Business Overview
15.2.9.3. Financial Overview
15.2.9.4. Strategic Overview
15.2.10. Evergreen Plastics, Inc
15.2.10.1. Company Description
15.2.10.2. Business Overview
15.2.10.3. Financial Overview
15.2.10.4. Strategic Overview
15.2.11. Indorama Ventures Public Company Limited
15.2.11.1. Company Description
15.2.11.2. Business Overview
15.2.11.3. Financial Overview
15.2.11.4. Strategic Overview
15.2.12. Verdeco Recycling, Inc
15.2.12.1. Company Description
15.2.12.2. Business Overview
15.2.12.3. Financial Overview
15.2.12.4. Strategic Overview
15.2.13. Clear Path Recycling, LLC
15.2.13.1. Company Description
15.2.13.2. Business Overview
15.2.13.3. Financial Overview
15.2.13.4. Strategic Overview
16. Primary Research: Key Insights
17. Appendix
List of Tables
Table 1: Global Recycled PET (r-PET) Bottles Market Volume (Thousand Tons) Forecast, by Grade, 2020–2031
Table 2: Global Recycled PET (r-PET) Bottles Market Value (US$ Bn) Forecast, by Grade, 2020–2031
Table 3: Global Recycled PET (r-PET) Bottles Market Volume (Thousand Tons) Forecast, by Type, 2020–2031
Table 4: Global Recycled PET (r-PET) Bottles Market Value (US$ Bn) Forecast, by Type, 2020–2031
Table 5: Global Recycled PET (r-PET) Bottles Market Volume (Thousand Tons) Forecast, by Recycle Process, 2020–2031
Table 6: Global Recycled PET (r-PET) Bottles Market Value (US$ Bn) Forecast, by Recycle Process, 2020–2031
Table 7: Global Recycled PET (r-PET) Bottles Market Volume (Thousand Tons) Forecast, by Region, 2020–2031
Table 8: Global Recycled PET (r-PET) Bottles Market Value (US$ Bn) Forecast, by Region, 2020–2031
Table 9: North America Recycled PET (r-PET) Bottles Market Volume (Thousand Tons) Forecast, by Grade, 2020–2031
Table 10: North America Recycled PET (r-PET) Bottles Market Value (US$ Bn) Forecast, by Grade, 2020–2031
Table 11: North America Recycled PET (r-PET) Bottles Market Volume (Thousand Tons) Forecast, by Type, 2020–2031
Table 12: North America Recycled PET (r-PET) Bottles Market Value (US$ Bn) Forecast, by Type, 2020–2031
Table 13: North America Recycled PET (r-PET) Bottles Market Volume (Thousand Tons) Forecast, by Recycle Process, 2020–2031
Table 14: North America Recycled PET (r-PET) Bottles Market Value (US$ Bn) Forecast, by Recycle Process, 2020–2031
Table 15: North America Recycled PET (r-PET) Bottles Market Volume (Thousand Tons) Forecast, by Country, 2020–2031
Table 16: North America Recycled PET (r-PET) Bottles Market Value (US$ Bn) Forecast, by Country, 2020–2031
Table 17: U.S. Recycled PET (r-PET) Bottles Market Volume (Thousand Tons) Forecast, by Grade, 2020–2031
Table 18: U.S. Recycled PET (r-PET) Bottles Market Value (US$ Bn) Forecast, by Grade, 2020–2031
Table 19: U.S. Recycled PET (r-PET) Bottles Market Volume (Thousand Tons) Forecast, by Type, 2020–2031
Table 20: U.S. Recycled PET (r-PET) Bottles Market Value (US$ Bn) Forecast, by Type, 2020–2031
Table 21: U.S. Recycled PET (r-PET) Bottles Market Volume (Thousand Tons) Forecast, by Recycle Process, 2020–2031
Table 22: U.S. Recycled PET (r-PET) Bottles Market Value (US$ Bn) Forecast, by Recycle Process, 2020–2031
Table 23: Canada Recycled PET (r-PET) Bottles Market Volume (Thousand Tons) Forecast, by Grade, 2020–2031
Table 24: Canada Recycled PET (r-PET) Bottles Market Value (US$ Bn) Forecast, by Grade, 2020–2031
Table 25: Canada Recycled PET (r-PET) Bottles Market Volume (Thousand Tons) Forecast, by Type, 2020–2031
Table 26: Canada Recycled PET (r-PET) Bottles Market Value (US$ Bn) Forecast, by Type, 2020–2031
Table 27: Canada Recycled PET (r-PET) Bottles Market Volume (Thousand Tons) Forecast, by Recycle Process, 2020–2031
Table 28: Canada Recycled PET (r-PET) Bottles Market Value (US$ Bn) Forecast, by Recycle Process, 2020–2031
Table 29: Europe Recycled PET (r-PET) Bottles Market Volume (Thousand Tons) Forecast, by Grade, 2020–2031
Table 30: Europe Recycled PET (r-PET) Bottles Market Value (US$ Bn) Forecast, by Grade, 2020–2031
Table 31: Europe Recycled PET (r-PET) Bottles Market Volume (Thousand Tons) Forecast, by Type, 2020–2031
Table 32: Europe Recycled PET (r-PET) Bottles Market Value (US$ Bn) Forecast, by Type, 2020–2031
Table 33: Europe Recycled PET (r-PET) Bottles Market Volume (Thousand Tons) Forecast, by Recycle Process, 2020–2031
Table 34: Europe Recycled PET (r-PET) Bottles Market Value (US$ Bn) Forecast, by Recycle Process, 2020–2031
Table 35: Europe Recycled PET (r-PET) Bottles Market Volume (Thousand Tons) Forecast, by Country and Sub-region, 2020–2031
Table 36: Europe Recycled PET (r-PET) Bottles Market Value (US$ Bn) Forecast, by Country and Sub-region, 2020–2031
Table 37: Germany Recycled PET (r-PET) Bottles Market Volume (Thousand Tons) Forecast, by Grade, 2020–2031
Table 38: Germany Recycled PET (r-PET) Bottles Market Value (US$ Bn) Forecast, by Grade, 2020–2031
Table 39: Germany Recycled PET (r-PET) Bottles Market Volume (Thousand Tons) Forecast, by Type, 2020–2031
Table 40: Germany Recycled PET (r-PET) Bottles Market Value (US$ Bn) Forecast, by Type, 2020–2031
Table 41: Germany Recycled PET (r-PET) Bottles Market Volume (Thousand Tons) Forecast, by Recycle Process, 2020–2031
Table 42: Germany Recycled PET (r-PET) Bottles Market Value (US$ Bn) Forecast, by Recycle Process, 2020–2031
Table 43: France Recycled PET (r-PET) Bottles Market Volume (Thousand Tons) Forecast, by Grade, 2020–2031
Table 44: France Recycled PET (r-PET) Bottles Market Value (US$ Bn) Forecast, by Grade, 2020–2031
Table 45: France Recycled PET (r-PET) Bottles Market Volume (Thousand Tons) Forecast, by Type, 2020–2031
Table 46: France Recycled PET (r-PET) Bottles Market Value (US$ Bn) Forecast, by Type, 2020–2031
Table 47: France Recycled PET (r-PET) Bottles Market Volume (Thousand Tons) Forecast, by Recycle Process, 2020–2031
Table 48: France Recycled PET (r-PET) Bottles Market Value (US$ Bn) Forecast, by Recycle Process, 2020–2031
Table 49: U.K. Recycled PET (r-PET) Bottles Market Volume (Thousand Tons) Forecast, by Grade, 2020–2031
Table 50: U.K. Recycled PET (r-PET) Bottles Market Value (US$ Bn) Forecast, by Grade, 2020–2031
Table 51: U.K. Recycled PET (r-PET) Bottles Market Volume (Thousand Tons) Forecast, by Type, 2020–2031
Table 52: U.K. Recycled PET (r-PET) Bottles Market Value (US$ Bn) Forecast, by Type, 2020–2031
Table 53: U.K. Recycled PET (r-PET) Bottles Market Volume (Thousand Tons) Forecast, by Recycle Process, 2020–2031
Table 54: U.K. Recycled PET (r-PET) Bottles Market Value (US$ Bn) Forecast, by Recycle Process, 2020–2031
Table 55: Italy Recycled PET (r-PET) Bottles Market Volume (Thousand Tons) Forecast, by Grade, 2020–2031
Table 56: Italy Recycled PET (r-PET) Bottles Market Value (US$ Bn) Forecast, by Grade, 2020–2031
Table 57: Italy Recycled PET (r-PET) Bottles Market Volume (Thousand Tons) Forecast, by Type, 2020–2031
Table 58: Italy Recycled PET (r-PET) Bottles Market Value (US$ Bn) Forecast, by Type, 2020–2031
Table 59: Italy Recycled PET (r-PET) Bottles Market Volume (Thousand Tons) Forecast, by Recycle Process, 2020–2031
Table 60: Italy Recycled PET (r-PET) Bottles Market Value (US$ Bn) Forecast, by Recycle Process, 2020–2031
Table 61: Spain Recycled PET (r-PET) Bottles Market Volume (Thousand Tons) Forecast, by Grade, 2020–2031
Table 62: Spain Recycled PET (r-PET) Bottles Market Value (US$ Bn) Forecast, by Grade, 2020–2031
Table 63: Spain Recycled PET (r-PET) Bottles Market Volume (Thousand Tons) Forecast, by Type, 2020–2031
Table 64: Spain Recycled PET (r-PET) Bottles Market Value (US$ Bn) Forecast, by Type, 2020–2031
Table 65: Spain Recycled PET (r-PET) Bottles Market Volume (Thousand Tons) Forecast, by Recycle Process, 2020–2031
Table 66: Spain Recycled PET (r-PET) Bottles Market Value (US$ Bn) Forecast, by Recycle Process, 2020–2031
Table 67: Russia & CIS Recycled PET (r-PET) Bottles Market Volume (Thousand Tons) Forecast, by Grade, 2020–2031
Table 68: Russia & CIS Recycled PET (r-PET) Bottles Market Value (US$ Bn) Forecast, by Grade, 2020–2031
Table 69: Russia & CIS Recycled PET (r-PET) Bottles Market Volume (Thousand Tons) Forecast, by Type, 2020–2031
Table 70: Russia & CIS Recycled PET (r-PET) Bottles Market Value (US$ Bn) Forecast, by Type, 2020–2031
Table 71: Russia & CIS Recycled PET (r-PET) Bottles Market Volume (Thousand Tons) Forecast, by Recycle Process, 2020–2031
Table 72: Russia & CIS Recycled PET (r-PET) Bottles Market Value (US$ Bn) Forecast, by Recycle Process, 2020–2031
Table 73: Rest of Europe Recycled PET (r-PET) Bottles Market Volume (Thousand Tons) Forecast, by Grade, 2020–2031
Table 74: Rest of Europe Recycled PET (r-PET) Bottles Market Value (US$ Bn) Forecast, by Grade, 2020–2031
Table 75: Rest of Europe Recycled PET (r-PET) Bottles Market Volume (Thousand Tons) Forecast, by Type, 2020–2031
Table 76: Rest of Europe Recycled PET (r-PET) Bottles Market Value (US$ Bn) Forecast, by Type, 2020–2031
Table 77: Rest of Europe Recycled PET (r-PET) Bottles Market Volume (Thousand Tons) Forecast, by Recycle Process, 2020–2031
Table 78: Rest of Europe Recycled PET (r-PET) Bottles Market Value (US$ Bn) Forecast, by Recycle Process, 2020–2031
Table 79: Asia Pacific Recycled PET (r-PET) Bottles Market Volume (Thousand Tons) Forecast, by Grade, 2020–2031
Table 80: Asia Pacific Recycled PET (r-PET) Bottles Market Value (US$ Bn) Forecast, by Grade, 2020–2031
Table 81: Asia Pacific Recycled PET (r-PET) Bottles Market Volume (Thousand Tons) Forecast, by Type, 2020–2031
Table 82: Asia Pacific Recycled PET (r-PET) Bottles Market Value (US$ Bn) Forecast, by Type, 2020–2031
Table 83: Asia Pacific Recycled PET (r-PET) Bottles Market Volume (Thousand Tons) Forecast, by Recycle Process, 2020–2031
Table 84: Asia Pacific Recycled PET (r-PET) Bottles Market Value (US$ Bn) Forecast, by Recycle Process, 2020–2031
Table 85: Asia Pacific Recycled PET (r-PET) Bottles Market Volume (Thousand Tons) Forecast, by Country and Sub-region, 2020–2031
Table 86: Asia Pacific Recycled PET (r-PET) Bottles Market Value (US$ Bn) Forecast, by Country and Sub-region, 2020–2031
Table 87: China Recycled PET (r-PET) Bottles Market Volume (Thousand Tons) Forecast, by Grade, 2020–2031
Table 88: China Recycled PET (r-PET) Bottles Market Value (US$ Bn) Forecast, by Grade 2020–2031
Table 89: China Recycled PET (r-PET) Bottles Market Volume (Thousand Tons) Forecast, by Type, 2020–2031
Table 90: China Recycled PET (r-PET) Bottles Market Value (US$ Bn) Forecast, by Type, 2020–2031
Table 91: China Recycled PET (r-PET) Bottles Market Volume (Thousand Tons) Forecast, by Recycle Process, 2020–2031
Table 92: China Recycled PET (r-PET) Bottles Market Value (US$ Bn) Forecast, by Recycle Process, 2020–2031
Table 93: Japan Recycled PET (r-PET) Bottles Market Volume (Thousand Tons) Forecast, by Grade, 2020–2031
Table 94: Japan Recycled PET (r-PET) Bottles Market Value (US$ Bn) Forecast, by Grade, 2020–2031
Table 95: Japan Recycled PET (r-PET) Bottles Market Volume (Thousand Tons) Forecast, by Type, 2020–2031
Table 96: Japan Recycled PET (r-PET) Bottles Market Value (US$ Bn) Forecast, by Type, 2020–2031
Table 97: Japan Recycled PET (r-PET) Bottles Market Volume (Thousand Tons) Forecast, by Recycle Process, 2020–2031
Table 98: Japan Recycled PET (r-PET) Bottles Market Value (US$ Bn) Forecast, by Recycle Process, 2020–2031
Table 99: India Recycled PET (r-PET) Bottles Market Volume (Thousand Tons) Forecast, by Grade, 2020–2031
Table 100: India Recycled PET (r-PET) Bottles Market Value (US$ Bn) Forecast, by Grade, 2020–2031
Table 101: India Recycled PET (r-PET) Bottles Market Volume (Thousand Tons) Forecast, by Type, 2020–2031
Table 102: India Recycled PET (r-PET) Bottles Market Value (US$ Bn) Forecast, by Type, 2020–2031
Table 103: India Recycled PET (r-PET) Bottles Market Volume (Thousand Tons) Forecast, by Recycle Process, 2020–2031
Table 104: India Recycled PET (r-PET) Bottles Market Value (US$ Bn) Forecast, by Recycle Process, 2020–2031
Table 107: ASEAN Recycled PET (r-PET) Bottles Market Volume (Thousand Tons) Forecast, by Grade, 2020–2031
Table 108: ASEAN Recycled PET (r-PET) Bottles Market Value (US$ Bn) Forecast, by Grade, 2020–2031
Table 109: ASEAN Recycled PET (r-PET) Bottles Market Volume (Thousand Tons) Forecast, by Type, 2020–2031
Table 110: ASEAN Recycled PET (r-PET) Bottles Market Value (US$ Bn) Forecast, by Type, 2020–2031
Table 111: ASEAN Recycled PET (r-PET) Bottles Market Volume (Thousand Tons) Forecast, by Recycle Process, 2020–2031
Table 112: ASEAN Recycled PET (r-PET) Bottles Market Value (US$ Bn) Forecast, by Recycle Process, 2020–2031
Table 113: Rest of Asia Pacific Recycled PET (r-PET) Bottles Market Volume (Thousand Tons) Forecast, by Grade, 2020–2031
Table 114: Rest of Asia Pacific Recycled PET (r-PET) Bottles Market Value (US$ Bn) Forecast, by Grade, 2020–2031
Table 115: Rest of Asia Pacific Recycled PET (r-PET) Bottles Market Volume (Thousand Tons) Forecast, by Type, 2020–2031
Table 116: Rest of Asia Pacific Recycled PET (r-PET) Bottles Market Value (US$ Bn) Forecast, by Type, 2020–2031
Table 117: Rest of Asia Pacific Recycled PET (r-PET) Bottles Market Volume (Thousand Tons) Forecast, by Recycle Process, 2020–2031
Table 118: Rest of Asia Pacific Recycled PET (r-PET) Bottles Market Value (US$ Bn) Forecast, by Recycle Process, 2020–2031
Table 119: Latin America Recycled PET (r-PET) Bottles Market Volume (Thousand Tons) Forecast, by Grade, 2020–2031
Table 120: Latin America Recycled PET (r-PET) Bottles Market Value (US$ Bn) Forecast, by Grade, 2020–2031
Table 121: Latin America Recycled PET (r-PET) Bottles Market Volume (Thousand Tons) Forecast, by Type, 2020–2031
Table 122: Latin America Recycled PET (r-PET) Bottles Market Value (US$ Bn) Forecast, by Type, 2020–2031
Table 123: Latin America Recycled PET (r-PET) Bottles Market Volume (Thousand Tons) Forecast, by Recycle Process, 2020–2031
Table 124: Latin America Recycled PET (r-PET) Bottles Market Value (US$ Bn) Forecast, by Recycle Process, 2020–2031
Table 125: Latin America Recycled PET (r-PET) Bottles Market Volume (Thousand Tons) Forecast, by Country and Sub-region, 2020–2031
Table 126: Latin America Recycled PET (r-PET) Bottles Market Value (US$ Bn) Forecast, by Country and Sub-region, 2020–2031
Table 127: Brazil Recycled PET (r-PET) Bottles Market Volume (Thousand Tons) Forecast, by Grade, 2020–2031
Table 128: Brazil Recycled PET (r-PET) Bottles Market Value (US$ Bn) Forecast, by Grade, 2020–2031
Table 129: Brazil Recycled PET (r-PET) Bottles Market Volume (Thousand Tons) Forecast, by Type, 2020–2031
Table 130: Brazil Recycled PET (r-PET) Bottles Market Value (US$ Bn) Forecast, by Type, 2020–2031
Table 131: Brazil Recycled PET (r-PET) Bottles Market Volume (Thousand Tons) Forecast, by Recycle Process, 2020–2031
Table 132: Brazil Recycled PET (r-PET) Bottles Market Value (US$ Bn) Forecast, by Recycle Process, 2020–2031
Table 133: Mexico Recycled PET (r-PET) Bottles Market Volume (Thousand Tons) Forecast, by Grade, 2020–2031
Table 134: Mexico Recycled PET (r-PET) Bottles Market Value (US$ Bn) Forecast, by Grade, 2020–2031
Table 135: Mexico Recycled PET (r-PET) Bottles Market Volume (Thousand Tons) Forecast, by Type, 2020–2031
Table 136: Mexico Recycled PET (r-PET) Bottles Market Value (US$ Bn) Forecast, by Type, 2020–2031
Table 137: Mexico Recycled PET (r-PET) Bottles Market Volume (Thousand Tons) Forecast, by Recycle Process, 2020–2031
Table 138: Mexico Recycled PET (r-PET) Bottles Market Value (US$ Bn) Forecast, by Recycle Process, 2020–2031
Table 139: Rest of Latin America Recycled PET (r-PET) Bottles Market Volume (Thousand Tons) Forecast, by Grade, 2020–2031
Table 140: Rest of Latin America Recycled PET (r-PET) Bottles Market Value (US$ Bn) Forecast, by Grade, 2020–2031
Table 141: Rest of Latin America Recycled PET (r-PET) Bottles Market Volume (Thousand Tons) Forecast, by Type, 2020–2031
Table 142: Rest of Latin America Recycled PET (r-PET) Bottles Market Value (US$ Bn) Forecast, by Type, 2020–2031
Table 143: Rest of Latin America Recycled PET (r-PET) Bottles Market Volume (Thousand Tons) Forecast, by Recycle Process, 2020–2031
Table 144: Rest of Latin America Recycled PET (r-PET) Bottles Market Value (US$ Bn) Forecast, by Recycle Process, 2020–2031
Table 145: Middle East & Africa Recycled PET (r-PET) Bottles Market Volume (Thousand Tons) Forecast, by Grade, 2020–2031
Table 146: Middle East & Africa Recycled PET (r-PET) Bottles Market Value (US$ Bn) Forecast, by Grade, 2020–2031
Table 147: Middle East & Africa Recycled PET (r-PET) Bottles Market Volume (Thousand Tons) Forecast, by Type, 2020–2031
Table 148: Middle East & Africa Recycled PET (r-PET) Bottles Market Value (US$ Bn) Forecast, by Type, 2020–2031
Table 149: Middle East & Africa Recycled PET (r-PET) Bottles Market Volume (Thousand Tons) Forecast, by Recycle Process, 2020–2031
Table 150: Middle East & Africa Recycled PET (r-PET) Bottles Market Value (US$ Bn) Forecast, by Recycle Process, 2020–2031
Table 151: Middle East & Africa Recycled PET (r-PET) Bottles Market Volume (Thousand Tons) Forecast, by Country and Sub-region, 2020–2031
Table 152: Middle East & Africa Recycled PET (r-PET) Bottles Market Value (US$ Bn) Forecast, by Country and Sub-region, 2020–2031
Table 153: GCC Recycled PET (r-PET) Bottles Market Volume (Thousand Tons) Forecast, by Grade, 2020–2031
Table 154: GCC Recycled PET (r-PET) Bottles Market Value (US$ Bn) Forecast, by Grade, 2020–2031
Table 155: GCC Recycled PET (r-PET) Bottles Market Volume (Thousand Tons) Forecast, by Type, 2020–2031
Table 156: GCC Recycled PET (r-PET) Bottles Market Value (US$ Bn) Forecast, by Type, 2020–2031
Table 157: GCC Recycled PET (r-PET) Bottles Market Volume (Thousand Tons) Forecast, by Recycle Process, 2020–2031
Table 158: GCC Recycled PET (r-PET) Bottles Market Value (US$ Bn) Forecast, by Recycle Process, 2020–2031
Table 159: South Africa Recycled PET (r-PET) Bottles Market Volume (Thousand Tons) Forecast, by Grade, 2020–2031
Table 160: South Africa Recycled PET (r-PET) Bottles Market Value (US$ Bn) Forecast, by Grade, 2020–2031
Table 161: South Africa Recycled PET (r-PET) Bottles Market Volume (Thousand Tons) Forecast, by Type, 2020–2031
Table 162: South Africa Recycled PET (r-PET) Bottles Market Value (US$ Bn) Forecast, by Type, 2020–2031
Table 163: South Africa Recycled PET (r-PET) Bottles Market Volume (Thousand Tons) Forecast, by Recycle Process, 2020–2031
Table 164: South Africa Recycled PET (r-PET) Bottles Market Value (US$ Bn) Forecast, by Recycle Process, 2020–2031
Table 165: Rest of Middle East & Africa Recycled PET (r-PET) Bottles Market Volume (Thousand Tons) Forecast, by Grade, 2020–2031
Table 166: Rest of Middle East & Africa Recycled PET (r-PET) Bottles Market Value (US$ Bn) Forecast, by Grade, 2020–2031
Table 167: Rest of Middle East & Africa Recycled PET (r-PET) Bottles Market Volume (Thousand Tons) Forecast, by Type, 2020–2031
Table 168: Rest of Middle East & Africa Recycled PET (r-PET) Bottles Market Value (US$ Bn) Forecast, by Type, 2020–2031
Table 169: Rest of Middle East & Africa Recycled PET (r-PET) Bottles Market Volume (Thousand Tons) Forecast, by Recycle Process, 2020–2031
Table 170: Rest of Middle East & Africa Recycled PET (r-PET) Bottles Market Value (US$ Bn) Forecast, by Recycle Process, 2020–2031
List of Figures
Figure 1: Global Recycled PET (r-PET) Bottles Market Volume Share Analysis, by Grade, 2021, 2025, and 2031
Figure 2: Global Recycled PET (r-PET) Bottles Market Attractiveness, by Grade
Figure 3: Global Recycled PET (r-PET) Bottles Market Volume Share Analysis, by Type, 2021, 2025, and 2031
Figure 4: Global Recycled PET (r-PET) Bottles Market Attractiveness, by Type
Figure 5: Global Recycled PET (r-PET) Bottles Market Volume Share Analysis, by Recycle Process, 2021, 2025, and 2031
Figure 6: Global Recycled PET (r-PET) Bottles Market Attractiveness, by Recycle Process
Figure 7: Global Recycled PET (r-PET) Bottles Market Volume Share Analysis, by Region, 2021, 2025, and 2031
Figure 8: Global Recycled PET (r-PET) Bottles Market Attractiveness, by Region
Figure 9: North America Recycled PET (r-PET) Bottles Market Volume Share Analysis, by Grade, 2021, 2025, and 2031
Figure 10: North America Recycled PET (r-PET) Bottles Market Attractiveness, by Grade
Figure 11: North America Recycled PET (r-PET) Bottles Market Attractiveness, by Grade
Figure 12: North America Recycled PET (r-PET) Bottles Market Volume Share Analysis, by Type, 2021, 2025, and 2031
Figure 13: North America Recycled PET (r-PET) Bottles Market Attractiveness, by Type
Figure 14: North America Recycled PET (r-PET) Bottles Market Volume Share Analysis, by Recycle Process, 2021, 2025, and 2031
Figure 15: North America Recycled PET (r-PET) Bottles Market Attractiveness, by Recycle Process
Figure 16: North America Recycled PET (r-PET) Bottles Market Attractiveness, by Country
Figure 17: Europe Recycled PET (r-PET) Bottles Market Volume Share Analysis, by Grade, 2021, 2025, and 2031
Figure 18: Europe Recycled PET (r-PET) Bottles Market Attractiveness, by Grade
Figure 19: Europe Recycled PET (r-PET) Bottles Market Volume Share Analysis, by Type, 2021, 2025, and 2031
Figure 20: Europe Recycled PET (r-PET) Bottles Market Attractiveness, by Type
Figure 21: Europe Recycled PET (r-PET) Bottles Market Volume Share Analysis, by Recycle Process, 2021, 2025, and 2031
Figure 22: Europe Recycled PET (r-PET) Bottles Market Attractiveness, by Recycle Process
Figure 23: Europe Recycled PET (r-PET) Bottles Market Volume Share Analysis, by Country and Sub-region, 2021, 2025, and 2031
Figure 24: Europe Recycled PET (r-PET) Bottles Market Attractiveness, by Country and Sub-region
Figure 25: Asia Pacific Recycled PET (r-PET) Bottles Market Volume Share Analysis, by Grade, 2021, 2025, and 2031
Figure 26: Asia Pacific Recycled PET (r-PET) Bottles Market Attractiveness, by Grade
Figure 27: Asia Pacific Recycled PET (r-PET) Bottles Market Volume Share Analysis, by Type, 2021, 2025, and 2031
Figure 28: Asia Pacific Recycled PET (r-PET) Bottles Market Attractiveness, by Type
Figure 29: Asia Pacific Recycled PET (r-PET) Bottles Market Volume Share Analysis, by Recycle Process, 2021, 2025, and 2031
Figure 30: Asia Pacific Recycled PET (r-PET) Bottles Market Attractiveness, by Recycle Process
Figure 31: Asia Pacific Recycled PET (r-PET) Bottles Market Volume Share Analysis, by Country and Sub-region, 2021, 2025, and 2031
Figure 32: Asia Pacific Recycled PET (r-PET) Bottles Market Attractiveness, by Country and Sub-region
Figure 33: Latin America Recycled PET (r-PET) Bottles Market Volume Share Analysis, by Grade, 2021, 2025, and 2031
Figure 34: Latin America Recycled PET (r-PET) Bottles Market Attractiveness, by Grade
Figure 35: Latin America Recycled PET (r-PET) Bottles Market Volume Share Analysis, by Type, 2021, 2025, and 2031
Figure 36: Latin America Recycled PET (r-PET) Bottles Market Attractiveness, by Type
Figure 37: Latin America Recycled PET (r-PET) Bottles Market Volume Share Analysis, by Recycle Process, 2021, 2025, and 2031
Figure 38: Latin America Recycled PET (r-PET) Bottles Market Attractiveness, by Recycle Process
Figure 39: Latin America Recycled PET (r-PET) Bottles Market Volume Share Analysis, by Country and Sub-region, 2021, 2025, and 2031
Figure 40: Latin America Recycled PET (r-PET) Bottles Market Attractiveness, by Country and Sub-region
Figure 41: Middle East & Africa Recycled PET (r-PET) Bottles Market Volume Share Analysis, by Grade, 2021, 2025, and 2031
Figure 42: Middle East & Africa Recycled PET (r-PET) Bottles Market Attractiveness, by Grade
Figure 43: Middle East & Africa Recycled PET (r-PET) Bottles Market Volume Share Analysis, by Type, 2021, 2025, and 2031
Figure 44: Middle East & Africa Recycled PET (r-PET) Bottles Market Attractiveness, by Type
Figure 45: Middle East & Africa Recycled PET (r-PET) Bottles Market Volume Share Analysis, by Recycle Process, 2021, 2025, and 2031
Figure 46: Middle East & Africa Recycled PET (r-PET) Bottles Market Attractiveness, by Recycle Process
Figure 47: Middle East & Africa Recycled PET (r-PET) Bottles Market Volume Share Analysis, by Country and Sub-region, 2021, 2025, and 2031
Figure 48: Middle East & Africa Recycled PET (r-PET) Bottles Market Attractiveness, by Country and Sub-region
Copyright © Transparency Market Research, Inc. All Rights reserved
Trust Online

Recycled PET (r-PET) Bottles Market