
Reports
Reports
The COVID-19 pandemic poses a serious challenge for the management of patients with different pre-existing conditions, including autoimmune diseases such as systemic sclerosis. Companies in the rare dermatological disease treatment market are under scrutiny for robust supply of treatments and medications such as antibiotics, immunosuppressants, and corticosteroids, among others, to support the health of patients.
Systemic sclerosis represents one of the most severe connective tissue diseases with multi-organ involvement, owing to concomitancy of fibrosing and microvascular alterations. Hence, companies in the rare dermatological disease treatment market are boosting their production capacities in medications to reduce morbidity and mortality rates. The deep investigation on the possible interactions between SARS-CoV-2 infection and a compromised host immune system might provide useful pathogenic and therapeutic insights into both coronavirus and systemic sclerosis.
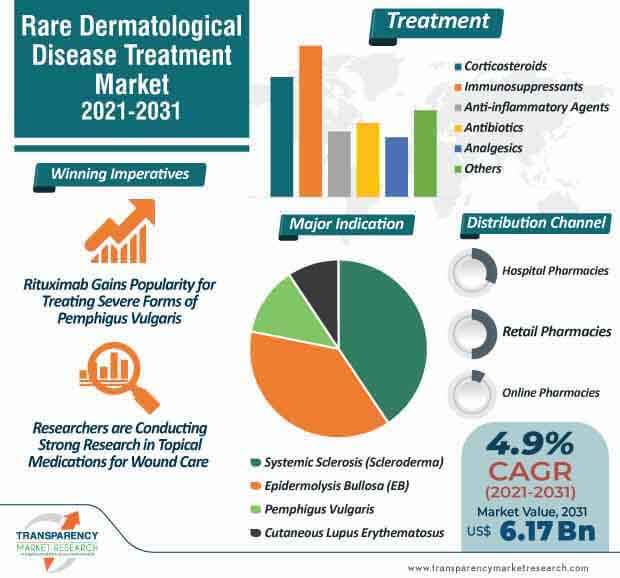
The rare dermatological disease treatment market is expected to surpass US$ 6.17 Bn by 2031. Since there is no curative treatment for epidermolysis bullosa (EB), there is a need for advances in understanding molecular genetics and underlying pathomechanisms of different forms of EB. Companies are expected to team with researchers to deploy promising R&D for exploring novel treatments for EB.
Stakeholders and researchers are gaining a strong research base in topical medications for wound care in order to accelerate wound healing. This has the potential in wound care across different forms of EB.
The rare dermatological disease treatment market is estimated to clock a CAGR of 4.9% from 2021 to 2031. The therapeutic management of pemphigus vulgaris (PV) involves the combination of systemic corticosteroids and potentially corticosteroid-sparing immunosuppressive drugs, namely azathioprine and mycophenolate mofetil as the standard first-line therapy by most clinicians.
Manufacturers in the rare dermatological disease treatment market are bolstering their output capabilities of Rituximab in order to treat severe forms of pemphigus vulgaris. Patients initially treated with prednisone/prednisolone plus Rituximab and who have persistent active lesions are being recommended to increase the doses of prednisone/prednisolone. Moderate and severe types of pemphigus vulgaris are being treated with Rituximab administered as a monotherapy or associated with topical corticosteroids in patients with absolute contraindication to systemic corticosteroid therapy.
The use of cyclophosphamide at very high doses during intensive conditioning procedures for myelosuppressive or myeloablative purposes, with or without antilymphocytic serum followed by autologous hematopoietic stem cell (HSC) transplantation has proved effective in the systemic sclerosis treatment. Companies in the rare dermatological disease treatment market are increasing their focus on these treatment options for severe and rapidly progressive forms of systemic sclerosis.
In order to improve patient quality of life, non-pharmacological therapies such as functional rehabilitation are being recommended to combat systemic sclerosis. Companies and healthcare providers in the rare dermatological disease treatment market are increasing awareness about therapeutic patient education (TPE) to obtain a better understanding of the disease.
Analysts’ Viewpoint
Given the unpredictable and threatening course of the COVID-19 pandemic, valuable prevention and management strategies are being implemented at healthcare facilities for systemic sclerosis patients. Therapeutic patient education is emerging as an effective strategy to acquire and maintain the skills to better manage systemic sclerosis. There is a need to limit common side effects usually associated with long-term immunosuppressive or corticosteroid treatment for pemphigus vulgaris. Companies in the rare dermatological disease treatment market should increase investments in research to develop novel treatment options for pemphigus vulgaris. Additional supportive treatments such as intralesional injections of corticosteroids are being considered for isolated lesions of oral mucosa, lips, and skin of pemphigus vulgaris patients.
Rare dermatological disease treatment market is expected to surpass US$ 6.17 Bn by 2031
Rare dermatological disease treatment market is estimated to clock a CAGR of 4.9% from 2021 to 2031
Rare dermatological disease treatment market is driven by increase in incidence of rare diseases and surge in research & development for orphan drugs
The systemic sclerosis segment dominated the global rare dermatological disease treatment market in 2020, and the trend is projected to continue during the forecast period
Key players in the global rare dermatological disease treatment market include Sanofi, GlaxoSmithKline plc, Novartis AG, Castle Creek Biosciences, Inc., Merck & Co.
1. Preface
1.1. Market Definition and Scope
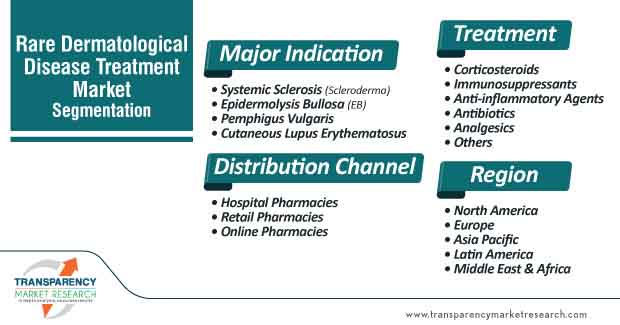
1.2. Market Segmentation
1.3. Key Research Objectives
1.4. Research Highlights
2. Assumptions and Research Methodology
3. Executive Summary : Global Rare Dermatological Disease Treatment Market
4. Market Overview
4.1. Introduction
4.1.1. Segment Definition
4.2. Overview
4.3. Market Dynamics
4.3.1. Drivers
4.3.2. Restraints
4.3.3. Opportunities
4.4. Global Rare Dermatological Disease Treatment Market Analysis and Forecast, 2017–2031
4.4.1. Market Revenue Projections (US$ Mn)
5. Key Insights
5.1. Pipeline Analysis
5.2. Novel Therapies for Rare Dermatological Disease
5.3. Key Industry Events (Mergers, Acquisitions, Partnerships, Collaborations, etc.)
5.4. COVID-19 Pandemic Impact on Industry (Value Chain and Short / Mid / Long Term Impact)
6. Global Rare Dermatological Disease Treatment Market Analysis and Forecast, by Major Indication
6.1. Introduction & Definition
6.2. Key Findings / Developments
6.3. Global Rare Dermatological Disease Treatment Market Value Forecast, by Major Indication, 2017–2031
6.3.1. Systemic Sclerosis (Scleroderma)
6.3.2. Epidermolysis Bullosa (EB)
6.3.3. Pemphigus Vulgaris
6.3.4. Cutaneous Lupus Erythematosus
6.4. Global Rare Dermatological Disease Treatment Market Attractiveness, by Major Indication
7. Global Rare Dermatological Disease Treatment Market Analysis and Forecast, by Treatment
7.1. Introduction & Definition
7.2. Key Findings / Developments
7.3. Global Rare Dermatological Disease Treatment Market Value Forecast, by Treatment, 2017–2031
7.3.1. Corticosteroids
7.3.2. Immunosuppressants
7.3.3. Anti-inflammatory Agents
7.3.4. Antibiotics
7.3.5. Analgesics
7.3.6. Others
7.4. Global Rare Dermatological Disease Treatment Market Attractiveness, by Treatment
8. Global Rare Dermatological Disease Treatment Market Analysis and Forecast, by Distribution Channel
8.1. Introduction & Definition
8.2. Key Findings / Developments
8.3. Global Rare Dermatological Disease Treatment Market Value Forecast, by Distribution Channel, 2017–2031
8.3.1. Hospital Pharmacies
8.3.2. Retail Pharmacies
8.3.3. Online Pharmacies
8.4. Global Rare Dermatological Disease Treatment Market Attractiveness, by Distribution Channel
9. Global Rare Dermatological Disease Treatment Market Analysis and Forecast, by Region
9.1. Key Findings
9.2. Global Rare Dermatological Disease Treatment Market Value Forecast, by Region
9.2.1. North America
9.2.2. Europe
9.2.3. Asia Pacific
9.2.4. Latin America
9.2.5. Middle East & Africa
9.3. Global Rare Dermatological Disease Treatment Market Attractiveness, by Country/Region
10. North America Rare Dermatological Disease Treatment Market Analysis and Forecast
10.1. Introduction
10.1.1. Key Findings
10.2. North America Rare Dermatological Disease Treatment Market Value Forecast, by Major Indication, 2017–2031
10.2.1. Systemic Sclerosis (Scleroderma)
10.2.2. Epidermolysis Bullosa (EB)
10.2.3. Pemphigus Vulgaris
10.2.4. Cutaneous Lupus Erythematosus
10.3. Market Value Forecast, by Treatment, 2017–2031
10.3.1. Corticosteroids
10.3.2. Immunosuppressants
10.3.3. Anti-inflammatory Agents
10.3.4. Antibiotics
10.3.5. Analgesics
10.3.6. Others
10.4. North America Rare Dermatological Disease Treatment Market Value Forecast, by Distribution Channel, 2017–2031
10.4.1. Hospital Pharmacies
10.4.2. Retail Pharmacies
10.4.3. Online Pharmacies
10.5. North America Rare Dermatological Disease Treatment Market Value Forecast, by Country, 2017–2031
10.5.1. U.S.
10.5.2. Canada
10.6. North America Rare Dermatological Disease Treatment Market Attractiveness Analysis
10.6.1. By Major Indication
10.6.2. By Treatment
10.6.3. By Distribution Channel
10.6.4. By Country
11. Europe Rare Dermatological Disease Treatment Market Analysis and Forecast
11.1. Introduction
11.1.1. Key Findings
11.2. Europe Rare Dermatological Disease Treatment Market Value Forecast, by Major Indication, 2017–2031
11.2.1. Systemic Sclerosis (Scleroderma)
11.2.2. Epidermolysis Bullosa (EB)
11.2.3. Pemphigus Vulgaris
11.2.4. Cutaneous Lupus Erythematosus
11.3. Europe Rare Dermatological Disease Treatment Market Value Forecast, by Treatment, 2017–2031
11.3.1. Corticosteroids
11.3.2. Immunosuppressants
11.3.3. Anti-inflammatory Agents
11.3.4. Antibiotics
11.3.5. Analgesics
11.3.6. Others
11.4. Europe Rare Dermatological Disease Treatment Market Value Forecast, by Distribution Channel, 2017–2031
11.4.1. Hospital Pharmacies
11.4.2. Retail Pharmacies
11.4.3. Online Pharmacies
11.5. Europe Rare Dermatological Disease Treatment Market Value Forecast, by Country/Sub-Region, 2017–2031
11.5.1. Germany
11.5.2. U.K.
11.5.3. France
11.5.4. Spain
11.5.5. Italy
11.5.6. Rest of Europe
11.6. Europe Rare Dermatological Disease Treatment Market Attractiveness Analysis
11.6.1. By Major Indication
11.6.2. By Treatment
11.6.3. By Distribution Channel
11.6.4. By Country/Sub-Region
12. Asia Pacific Rare Dermatological Disease Treatment Market Analysis and Forecast
12.1. Introduction
12.1.1. Key Findings
12.2. Asia Pacific Rare Dermatological Disease Treatment Market Value Forecast, by Major Indication, 2017–2031
12.2.1. Systemic Sclerosis (Scleroderma)
12.2.2. Epidermolysis Bullosa (EB)
12.2.3. Pemphigus Vulgaris
12.2.4. Cutaneous Lupus Erythematosus
12.3. Asia Pacific Rare Dermatological Disease Treatment Market Value Forecast, by Treatment, 2017–2031
12.3.1. Corticosteroids
12.3.2. Immunosuppressants
12.3.3. Anti-inflammatory Agents
12.3.4. Antibiotics
12.3.5. Analgesics
12.3.6. Others
12.4. Asia Pacific Rare Dermatological Disease Treatment Market Value Forecast, by Distribution Channel, 2017–2031
12.4.1. Hospital Pharmacies
12.4.2. Retail Pharmacies
12.4.3. Online Pharmacies
12.5. Asia Pacific Rare Dermatological Disease Treatment Market Value Forecast, by Country/Sub-Region, 2017–2031
12.5.1. China
12.5.2. Japan
12.5.3. India
12.5.4. Australia & New Zealand
12.5.5. Rest of Asia Pacific
12.6. Asia Pacific Rare Dermatological Disease Treatment Market Attractiveness Analysis
12.6.1. By Major Indication
12.6.2. By Treatment
12.6.3. By Distribution Channel
12.6.4. By Country/Sub-Region
13. Latin America Rare Dermatological Disease Treatment Market Analysis and Forecast
13.1. Introduction
13.1.1. Key Findings
13.2. Latin America Rare Dermatological Disease Treatment Market Value Forecast, by Major Indication, 2017–2031
13.2.1. Systemic Sclerosis (Scleroderma)
13.2.2. Epidermolysis Bullosa (EB)
13.2.3. Pemphigus Vulgaris
13.2.4. Cutaneous Lupus Erythematosus
13.3. Latin America Rare Dermatological Disease Treatment Market Value Forecast, by Treatment, 2017–2031
13.3.1. Corticosteroids
13.3.2. Immunosuppressants
13.3.3. Anti-inflammatory Agents
13.3.4. Antibiotics
13.3.5. Analgesics
13.3.6. Others
13.4. Latin America Rare Dermatological Disease Treatment Market Value Forecast, by Distribution Channel, 2017–2031
13.4.1. Hospital Pharmacies
13.4.2. Retail Pharmacies
13.4.3. Online Pharmacies
13.5. Latin America Rare Dermatological Disease Treatment Market Value Forecast, by Country/Sub-Region, 2017–2031
13.5.1. Brazil
13.5.2. Mexico
13.5.3. Rest of Latin America
13.6. Latin America Rare Dermatological Disease Treatment Market Attractiveness Analysis
13.6.1. By Major Indication
13.6.2. By Treatment
13.6.3. By Distribution Channel
13.6.4. By Country/Sub-Region
14. Middle East & Africa Rare Dermatological Disease Treatment Market Analysis and Forecast
14.1. Introduction
14.1.1. Key Findings
14.2. Middle East & Africa Rare Dermatological Disease Treatment Market Value Forecast, by Major Indication, 2017–2031
14.2.1. Systemic Sclerosis (Scleroderma)
14.2.2. Epidermolysis Bullosa (EB)
14.2.3. Pemphigus Vulgaris
14.2.4. Cutaneous Lupus Erythematosus
14.3. Middle East & Africa Rare Dermatological Disease Treatment Market Value Forecast, by Treatment, 2017–2031
14.3.1. Corticosteroids
14.3.2. Immunosuppressants
14.3.3. Anti-inflammatory Agents
14.3.4. Antibiotics
14.3.5. Analgesics
14.3.6. Others
14.4. Middle East & Africa Rare Dermatological Disease Treatment Market Value Forecast, by Distribution Channel, 2017–2031
14.4.1. Hospital Pharmacies
14.4.2. Retail Pharmacies
14.4.3. Online Pharmacies
14.5. Middle East & Africa Rare Dermatological Disease Treatment Market Value Forecast, by Country/Sub-Region, 2017–2031
14.5.1. GCC Countries
14.5.2. South Africa
14.5.3. Rest of Middle East & Africa
14.6. Middle East & Africa Rare Dermatological Disease Treatment Market Attractiveness Analysis
14.6.1. By Major Indication
14.6.2. By Treatment
14.6.3. By Distribution Channel
14.6.4. By Country/Sub-Region
15. Competition Landscape
15.1. Company Profiles
15.1.1. Sanofi
15.1.1.1. Company Overview (HQ, Business Segments, Employee Strength)
15.1.1.2. Growth Strategies
15.1.1.3. SWOT Analysis
15.1.2. GlaxoSmithKline plc
15.1.2.1. Company Overview (HQ, Business Segments, Employee Strength)
15.1.2.2. Growth Strategies
15.1.2.3. SWOT Analysis
15.1.3. Novartis AG
15.1.3.1. Company Overview (HQ, Business Segments, Employee Strength)
15.1.3.2. Growth Strategies
15.1.3.3. SWOT Analysis
15.1.4. Castle Creek Biosciences, Inc.
15.1.4.1. Company Overview (HQ, Business Segments, Employee Strength)
15.1.4.2. Growth Strategies
15.1.4.3. SWOT Analysis
15.1.5. Merck & Co., Inc.
15.1.5.1. Company Overview (HQ, Business Segments, Employee Strength)
15.1.5.2. Growth Strategies
15.1.5.3. SWOT Analysis
15.1.6. Bristol-Myers Squibb Company
15.1.6.1. Company Overview (HQ, Business Segments, Employee Strength)
15.1.6.2. Growth Strategies
15.1.6.3. SWOT Analysis
15.1.7. Pfizer, Inc.
15.1.7.1. Company Overview (HQ, Business Segments, Employee Strength)
15.1.7.2. Growth Strategies
15.1.7.3. SWOT Analysis
15.1.8. F. Hoffmann-La Roche Ltd.
15.1.8.1. Company Overview (HQ, Business Segments, Employee Strength)
15.1.8.2. Growth Strategies
15.1.8.3. SWOT Analysis
15.1.9. Merck KGaA
15.1.9.1. Company Overview (HQ, Business Segments, Employee Strength)
15.1.9.2. Growth Strategies
15.1.9.3. SWOT Analysis
15.1.10. Eli Lilly and Company
15.1.10.1. Company Overview (HQ, Business Segments, Employee Strength)
15.1.10.2. Growth Strategies
15.1.10.3. SWOT Analysis
15.1.11. AbbVie, Inc.
15.1.11.1. Company Overview (HQ, Business Segments, Employee Strength)
15.1.11.2. Growth Strategies
15.1.11.3. SWOT Analysis
15.1.12. Krystal Biotech, Inc.
15.1.12.1. Company Overview (HQ, Business Segments, Employee Strength)
15.1.12.2. Growth Strategies
15.1.12.3. SWOT Analysis
15.1.13. Amryt Pharma plc
15.1.13.1. Company Overview (HQ, Business Segments, Employee Strength)
15.1.13.2. Growth Strategies
15.1.13.3. SWOT Analysis
List of Tables
Table 01: Global Rare Dermatological Disease Treatment Market Value (US$ Mn) Forecast, by Major Indication, 2017–2031
Table 02: Global Rare Dermatological Disease Treatment Market Value (US$ Mn) Forecast, by Treatment, 2017–2031
Table 03: Global Rare Dermatological Disease Treatment Market Value (US$ Mn) Forecast, by Distribution Channel, 2017–2031
Table 04: Global Rare Dermatological Disease Treatment Market Value (US$ Mn) Forecast, by Region, 2017–2031
Table 05: North America Rare Dermatological Disease Treatment Market Value (US$ Mn) Forecast, by Country, 2017–2031
Table 06: North America Rare Dermatological Disease Treatment Market Value (US$ Mn) Forecast, by Major Indication, 2017–2031
Table 07: North America Rare Dermatological Disease Treatment Market Value (US$ Mn) Forecast, by Treatment, 2017–2031
Table 08: North America Rare Dermatological Disease Treatment Market Value (US$ Mn) Forecast, by Distribution Channel, 2017–2031
Table 09: Europe Rare Dermatological Disease Treatment Market Value (US$ Mn) Forecast, by Country/Sub-region, 2017–2031
Table 10: Europe Rare Dermatological Disease Treatment Market Value (US$ Mn) Forecast, by Major Indication, 2017–2031
Table 11: Europe Rare Dermatological Disease Treatment Market Value (US$ Mn) Forecast, by Treatment, 2017–2031
Table 12: Europe Rare Dermatological Disease Treatment Market Value (US$ Mn) Forecast, by Distribution Channel, 2017–2031
Table 13: Asia Pacific Rare Dermatological Disease Treatment Market Value (US$ Mn) Forecast, by Country/Sub-region, 2017–2031
Table 14: Asia Pacific Rare Dermatological Disease Treatment Market Value (US$ Mn) Forecast, by Major Indication, 2017–2031
Table 15: Asia Pacific Rare Dermatological Disease Treatment Market Value (US$ Mn) Forecast, by Treatment, 2017–2031
Table 16: Asia Pacific Rare Dermatological Disease Treatment Market Value (US$ Mn) Forecast, by Distribution Channel, 2017–2031
Table 17: Latin America Rare Dermatological Disease Treatment Market Value (US$ Mn) Forecast, by Country, 2017–2031
Table 18: Latin America Rare Dermatological Disease Treatment Market Value (US$ Mn) Forecast, by Major Indication, 2017–2031
Table 19: Latin America Rare Dermatological Disease Treatment Market Value (US$ Mn) Forecast, by Treatment, 2017–2031
Table 20: Latin America Rare Dermatological Disease Treatment Market Value (US$ Mn) Forecast, by Distribution Channel, 2017–2031
Table 21: Middle East & Africa Rare Dermatological Disease Treatment Market Value (US$ Mn) Forecast, by Country/Sub-region, 2017–2031
Table 22: Middle East & Africa Rare Dermatological Disease Treatment Market Value (US$ Mn) Forecast, by Major Indication, 2017–2031
Table 23: Middle East & Africa Rare Dermatological Disease Treatment Market Value (US$ Mn) Forecast, by Treatment, 2017–2031
Table 24: Middle East & Africa Rare Dermatological Disease Treatment Market Value (US$ Mn) Forecast, by Distribution Channel, 2017–2031
List of Figures
Figure 01: Rare Dermatological Disease Treatment Market Value (US$ Mn) Forecast, 2017–2031
Figure 02: Rare Dermatological Disease Treatment Market Value Share, by Major Indication, 2020
Figure 03: Rare Dermatological Disease Treatment Market Value Share, by Treatment, 2020
Figure 04: Rare Dermatological Disease Treatment Market Value Share, by Distribution Channel, 2020
Figure 05: Global Rare Dermatological Disease Treatment Market Value Share Analysis, by Major Indication, 2020 and 2031
Figure 06: Global Rare Dermatological Disease Treatment Market Attractiveness Analysis, by Major Indication, 2021–2031
Figure 07: Global Rare Dermatological Disease Treatment Market Revenue (US$ Mn), by Systemic Sclerosis (Scleroderma), 2017–2031
Figure 08: Global Rare Dermatological Disease Treatment Market Revenue (US$ Mn), by Epidermolysis Bullosa (EB), 2017–2031
Figure 09: Global Rare Dermatological Disease Treatment Market Revenue (US$ Mn), by Pemphigus Vulgaris, 2017–2031
Figure 10: Global Rare Dermatological Disease Treatment Market Revenue (US$ Mn), by Cutaneous Lupus Erythematosus, 2017–2031
Figure 11: Global Rare Dermatological Disease Treatment Market Value Share Analysis, by Treatment, 2020 and 2031
Figure 12: Global Rare Dermatological Disease Treatment Market Attractiveness Analysis, by Treatment, 2021–2031
Figure 13: Global Rare Dermatological Disease Treatment Market Revenue (US$ Mn), by Corticosteroids, 2017–2031
Figure 14: Global Rare Dermatological Disease Treatment Market Revenue (US$ Mn), by Immunosuppressants, 2017–2031
Figure 15: Global Rare Dermatological Disease Treatment Market Revenue (US$ Mn), by Anti-inflammatory Agents, 2017–2031
Figure 16: Global Rare Dermatological Disease Treatment Market Revenue (US$ Mn), by Antibiotics, 2017–2031
Figure 17: Global Rare Dermatological Disease Treatment Market Revenue (US$ Mn), by Analgesics, 2017–2031
Figure 18: Global Rare Dermatological Disease Treatment Market Revenue (US$ Mn), by Others, 2017–2031
Figure 19: Global Rare Dermatological Disease Treatment Market Value Share Analysis, by Distribution Channel, 2020 and 2031
Figure 20: Global Rare Dermatological Disease Treatment Market Attractiveness Analysis, by Distribution Channel, 2021–2031
Figure 21: Global Rare Dermatological Disease Treatment Market Revenue (US$ Mn), by Hospital Pharmacies, 2017–2031
Figure 22: Global Rare Dermatological Disease Treatment Market Revenue (US$ Mn), by Retail Pharmacies, 2017–2031
Figure 23: Global Rare Dermatological Disease Treatment Market Revenue (US$ Mn), by Online Pharmacies, 2017–2031
Figure 24: Global Rare Dermatological Disease Treatment Market Value Share Analysis, by Region, 2020 and 2031
Figure 25: Global Rare Dermatological Disease Treatment Market Attractiveness Analysis, by Region, 2021–2031
Figure 26: North America Rare Dermatological Disease Treatment Market Value (US$ Mn) Forecast and Y-o-Y Growth (%) Projection, 2017–2031
Figure 27: North America Rare Dermatological Disease Treatment Market Value Share, by Country, 2020 & 2031
Figure 28: North America Rare Dermatological Disease Treatment Market Attractiveness, by Country, 2021–2031
Figure 29: North America Rare Dermatological Disease Treatment Market Value Share Analysis, by Major Indication, 2020 and 2031
Figure 30: North America Rare Dermatological Disease Treatment Market Attractiveness Analysis, by Major Indication, 2021–2031
Figure 31: North America Rare Dermatological Disease Treatment Market Value Share (%), by Treatment, 2020 and 2031
Figure 32: North America Rare Dermatological Disease Treatment Market Attractiveness, by Treatment, 2021–2031
Figure 33: North America Rare Dermatological Disease Treatment Market Value Share (%), by Distribution Channel, 2020 and 2031
Figure 34: North America Rare Dermatological Disease Treatment Market Attractiveness, by Distribution Channel, 2021–2031
Figure 35: Europe Rare Dermatological Disease Treatment Market Value (US$ Mn) Forecast and Y-o-Y Growth (%) Projection, 2017–2031
Figure 36: Europe Rare Dermatological Disease Treatment Market Value Share, by Country/Sub-region, 2020 & 2031
Figure 37: Europe Rare Dermatological Disease Treatment Market Attractiveness, by Country/Sub-region, 2021–2031
Figure 38: Europe Rare Dermatological Disease Treatment Market Value Share Analysis, by Major Indication, 2020 and 2031
Figure 39: Europe Rare Dermatological Disease Treatment Market Attractiveness Analysis, by Major Indication, 2021–2031
Figure 40: Europe Rare Dermatological Disease Treatment Market Value Share (%), by Treatment, 2020 and 2031
Figure 41: Europe Rare Dermatological Disease Treatment Market Attractiveness, by Treatment, 2021–2031
Figure 42: Europe Rare Dermatological Disease Treatment Market Value Share (%), by Distribution Channel, 2020 and 2031
Figure 43: Europe Rare Dermatological Disease Treatment Market Attractiveness, by Distribution Channel, 2021–2031
Figure 44: Asia Pacific Rare Dermatological Disease Treatment Market Value (US$ Mn) Forecast and Y-o-Y Growth (%) Projection, 2017–2031
Figure 45: Asia Pacific Rare Dermatological Disease Treatment Market Value Share, by Country/Sub-region, 2020 & 2031
Figure 46: Asia Pacific Rare Dermatological Disease Treatment Market Attractiveness, by Country/Sub-region, 2021–2031
Figure 47: Asia Pacific Rare Dermatological Disease Treatment Market Value Share Analysis, by Major Indication, 2020 and 2031
Figure 48: Asia Pacific Rare Dermatological Disease Treatment Market Attractiveness Analysis, by Major Indication, 2021–2031
Figure 49: Asia Pacific Rare Dermatological Disease Treatment Market Value Share (%), by Treatment, 2020 and 2031
Figure 50: Asia Pacific Rare Dermatological Disease Treatment Market Attractiveness, by Treatment, 2021–2031
Figure 51: Asia Pacific Rare Dermatological Disease Treatment Market Value Share (%), by Distribution Channel, 2020 and 2031
Figure 52: Asia Pacific Rare Dermatological Disease Treatment Market Attractiveness, by Distribution Channel, 2021–2031
Figure 53: Latin America Rare Dermatological Disease Treatment Market Value (US$ Mn) Forecast and Y-o-Y Growth (%) Projection, 2017–2031
Figure 54: Latin America Rare Dermatological Disease Treatment Market Value Share, by Country, 2020 & 2031
Figure 55: Latin America Rare Dermatological Disease Treatment Market Attractiveness, by Country, 2021–2031
Figure 56: Latin America Rare Dermatological Disease Treatment Market Value Share Analysis, by Major Indication, 2020 and 2031
Figure 57: Latin America Rare Dermatological Disease Treatment Market Attractiveness Analysis, by Major Indication, 2021–2031
Figure 58: Latin America Rare Dermatological Disease Treatment Market Value Share (%), by Treatment, 2020 and 2031
Figure 59: Latin America Rare Dermatological Disease Treatment Market Attractiveness, by Treatment, 2021–2031
Figure 60: Latin America Rare Dermatological Disease Treatment Market Value Share (%), by Distribution Channel, 2020 and 2031
Figure 61: Latin America Rare Dermatological Disease Treatment Market Attractiveness, by Distribution Channel, 2021–2031
Figure 62: Middle East Rare Dermatological Disease Treatment Market Value (US$ Mn) Forecast and Y-o-Y Growth (%) Projection, 2017–2031
Figure 63: Middle East Rare Dermatological Disease Treatment Market Value Share, by Country/Sub-region, 2020 & 2031
Figure 64: Middle East Rare Dermatological Disease Treatment Market Attractiveness, by Country/Sub-region, 2021–2031
Figure 65: Middle East & Africa Rare Dermatological Disease Treatment Market Value Share Analysis, by Major Indication, 2020 and 2031
Figure 66: Middle East & Africa Rare Dermatological Disease Treatment Market Attractiveness Analysis, by Major Indication, 2021–2031
Figure 67: Middle East & Africa Rare Dermatological Disease Treatment Market Value Share (%), by Treatment, 2020 and 2031
Figure 68: Middle East & Africa Rare Dermatological Disease Treatment Market Attractiveness, by Treatment, 2021–2031
Figure 69: Middle East & Africa Rare Dermatological Disease Treatment Market Value Share (%), by Distribution Channel, 2020 and 2031
Figure 70: Middle East & Africa Rare Dermatological Disease Treatment Market Attractiveness, by Distribution Channel, 2021–2031
Copyright © Transparency Market Research, Inc. All Rights reserved
Trust Online

Rare Dermatological Disease Treatment Market Forecast Report, 2021-2031