
Reports
Reports
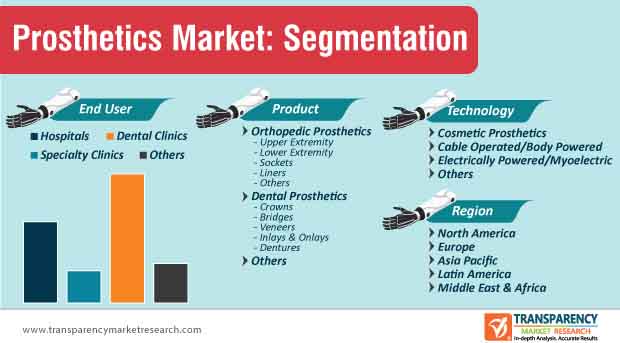
The adoption of electrically powered/myoelectric technology is predicted to grow at an aggressive rate during the forecast period. Hence, companies are increasing R&D in electrically powered technology to meet specific requirements of individuals.
Since powered prosthetic devices require a great deal of electricity to function efficiently, researchers are developing innovative skin that stores electricity. For instance, researchers at the University of Glasgow have developed a combination electronic skin to generate and store electricity for prosthetic devices. Thus, manufacturers in the prosthetics market should collaborate with researchers to gain expertise in electrically powered prosthetics.
Researchers are experimenting with innovative materials such as graphite-polyurethane composite covered by graphene. These materials act as electric supercapacitors capable of storing energy and cater to energy conservation needs of end users. Likewise, the graphene component acts as a solar panel that converts sunlight to electricity in order to charge the supercapacitor. Thus, companies in the prosthetics market landscape should adopt such innovations to make their products eco-friendly.
The computer-aided design/computer-aided manufacturing (CAD/CAM) technology is growing popular in the dental prosthetics segment. The CAD/CAM technology has given rise to rapid prototyping (RP), which has resulted in accuracy of prosthetic restorations, as compared to conventional restoration techniques.
Ongoing innovations in digital technology are revolutionizing the prosthetics market. As such, the dental prosthetics product segment of the prosthetics market is projected for exponential growth during the forecast period. Hence, manufacturers are increasing research in RP to digitize dental treatment.
RP offers promising opportunities in dental fields such as fabrication of surgical implant guides, maxillofacial prosthesis, and the likes. The CAD/CAM technology is being used by companies in the prosthetics market to reduce reliance on human variables and overcome limitations of conventional methods. In order to broaden their scope in incremental opportunities, companies are achieving fabrication of high-precision metal parts using selective laser melting technology.
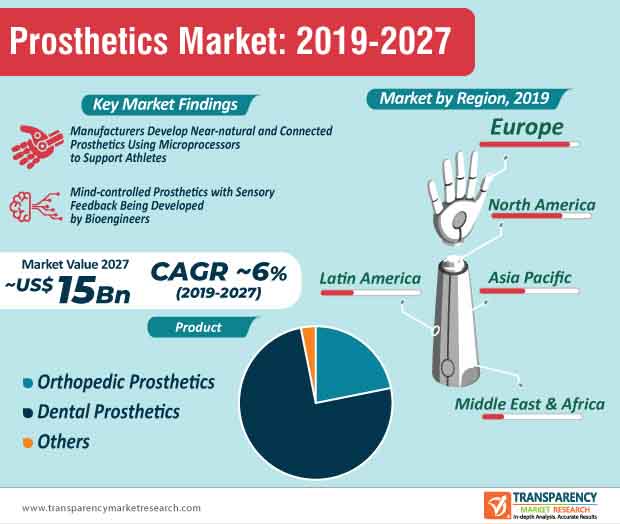
The prosthetics market is undergoing a change with the addition of AI and machine learning to develop mind-controlled prosthetics. Companies are developing prosthetic arms and limbs that are more adaptive and mimic the near-natural function of the human body parts. However, high reimbursement costs associated with these advanced prosthetics are some of the issues that companies need to address in order to sustain in the competitive prosthetics market landscape.
The prosthetics market is highly fragmented with emerging and prominent players accounting for ~80% market share. Thus, it is easier for new players to enter the market, but all companies need to tackle the common problem of high costs and lack of reimbursement policies to sustain in the market. High degree of abandonment by amputees has slowed down innovations and has created a barrier for investment by insurance companies in advanced technologies.
In order to overcome barriers of high costs and inefficient reimbursement policies, companies are increasing awareness and demonstrating the value proposition of prosthetics. This is being achieved by increasing research to develop cutting-edge prosthetics.
Companies are developing user-friendly prosthetics that are improving the quality of life of amputees. They are innovating in novel control systems for 3D-printed prosthetic hand that is capable of performing intricate and natural finger motions with greater accuracy. As such, orthopedic prosthetics product segment of the prosthetics market is estimated to generate second-highest revenue by 2027.
There is a growing demand for user-friendly prosthetics that require minimal training, especially in case of elderly patients. Advantages of user-friendly prosthetics are making them widely accessible for amputees. Companies in the prosthetics market are increasing research in unique control systems using muscle synergy theory to deploy complex movements.
Analysts’ Viewpoint
Researchers are introducing virtual reality programs to help prosthetic limbs feel more connected to the body of amputees. Asia Pacific is projected for exponential growth during the forecast period of the prosthetics market. This is evident as stakeholders in the Indian prosthetics startup, Social Hardware, are aiming to develop prosthetics for low-income rural amputees.
Moreover, the myoelectric prosthetic technology dominates the prosthetics market landscape. However, in order to use these types of prosthetics, amputees need to undergo a lot of training, which is undesirable in individuals. Hence, manufacturers should increase the availability of adaptable 3D-printed prosthetics to overcome the limitations of the myoelectric prosthetic technology.
The global prosthetics market was worth US$ 8.9 Bn and is projected to reach a value of US$ 15 Bn by the end of 2027
Prosthetics market is anticipated to grow at a CAGR of 6% during the forecast period
Europe accounted for a major share of the global prosthetics market
Prosthetics market is driven by rise in prevalence of dental disorders, aging population, growing medical tourism for dental procedures, increase in incidence of diabetes among the population leading to amputations, and surge in accident and trauma cases leading to limb loss
Key players in the global prosthetics market include Straumann AG, Danaher Corporation (Nobel Biocare Services AG), Zimmer Biomet Holdings, Inc., Dentsply Sirona, Inc., BioHorizons, Inc., Hanger, Inc., Össur, Ohio Willow Wood Company, Ottobock SE & Co., GaA, and Blatchford Group
1. Preface
1.1. Market Definition and Scope
1.2. Market Segmentation
1.3. Key Research Objectives
1.4. Research Highlights
2. Assumptions and Acronyms
3. Research Methodology
4. Executive Summary: Global Prosthetics Market
5. Market Overview
5.1. Definition
5.2. Market Indicators
5.3. Market Dynamics
5.3.1. Drivers
5.3.2. Restraints
5.3.3. Opportunities
6. Market Outlook
6.1. Global Prosthetics Market Analysis and Forecast, 2017–2027
6.2. Global Prosthetics Market Outlook
6.3. Regulatory Approval Process
6.4. Key Industry Developments
6.5. Value Chain Analysis
7. Global Prosthetics Market Analysis and Forecast, by Product
7.1. Introduction
7.2. Global Prosthetics Market Value Forecast, by Product, 2017–2027
7.2.1. Orthopedic Prosthetics
7.2.1.1. Upper Extremity
7.2.1.1.1. Shoulder Disarticulation
7.2.1.1.2. Transhumeral
7.2.1.1.3. Elbow Disarticulation
7.2.1.1.4. Transradial
7.2.1.1.5. Wrist Disarticulation and partial hand
7.2.1.2. Lower Extremity
7.2.1.2.1. Foot Amputation
7.2.1.2.2. Transtibial
7.2.1.2.3. Knee Disarticulation
7.2.1.2.4. Transfemoral
7.2.1.2.5. Hip Disarticulation
7.2.1.3. Sockets
7.2.1.4. Liners
7.2.1.5. Others
7.2.2. Dental Prosthetics
7.2.2.1. Crowns
7.2.2.2. Bridges
7.2.2.3. Veneers
7.2.2.4. Inlays & Onlays
7.2.2.5. Dentures
7.2.2.5.1. Partial
7.2.2.5.2. Complete
7.2.3. Others
7.2.4. Market Attractiveness, by Product
8. Global Prosthetics Market Analysis and Forecast, by End-user
8.1. Introduction
8.2. Global Prosthetics Market Value Forecast, by End-user, 2017–2027
8.2.1. Hospitals
8.2.2. Specialty Clinics
8.2.3. Dental Clinics
8.2.4. Others
8.3. Market Attractiveness, by End-user
9. Global Prosthetics Market Analysis and Forecast, by Technology (Orthopedic Prosthetics)
9.1. Introduction
9.2. Global Prosthetics Market Value Forecast, by Technology, 2017–2027
9.2.1. Cosmetic Prosthetics
9.2.2. Cable Operated/Body Powered
9.2.3. Electrically powered/Myoelectric
9.2.4. Others
9.3. Market Attractiveness, by Technology
10. Global Prosthetics Market Analysis and Forecast, by Region
10.1. Regional Outlook
10.2. Global Scenario
10.3. Introduction
10.4. Global Prosthetics Market Value Forecast, by Region
10.4.1. North America
10.4.2. Europe
10.4.3. Asia Pacific
10.4.4. Latin America
10.4.5. Middle East & Africa
10.5. Market Attractiveness, by Region
11. North America Prosthetics Market Analysis and Forecast
11.1. Key Findings
11.2. North America Prosthetics Market Value Forecast, by Product, 2017–2027
11.2.1. Orthopedic Prosthetics
11.2.1.1. Upper Extremity
11.2.1.1.1. Shoulder Disarticulation
11.2.1.1.2. Transhumeral
11.2.1.1.3. Elbow Disarticulation
11.2.1.1.4. Transradial
11.2.1.1.5. Wrist Disarticulation and partial hand
11.2.1.2. Lower Extremity
11.2.1.2.1. Foot Amputation
11.2.1.2.2. Transtibial
11.2.1.2.3. Knee Disarticulation
11.2.1.2.4. Transfemoral
11.2.1.2.5. Hip Disarticulation
11.2.1.3. Sockets
11.2.1.4. Liners
11.2.1.5. Others
11.2.2. Dental Prosthetics
11.2.2.1. Crowns
11.2.2.2. Bridges
11.2.2.3. Veneers
11.2.2.4. Inlays & Onlays
11.2.2.5. Dentures
11.2.2.5.1. Partial
11.2.2.5.2. Complete
11.2.3. Others
11.3. North America Prosthetics Market Value Forecast, by End-user, 2017–2027
11.3.1. Hospitals
11.3.2. Specialty Clinics
11.3.3. Dental Clinics
11.3.4. Others
11.4. North America Prosthetics Market Value Forecast, by Technology (Orthopedic Prosthetics), 2017–2027
11.4.1. Cosmetic Prosthetics
11.4.2. Cable Operated/Body Powered
11.4.3. Electrically powered/Myoelectric
11.4.4. Others
11.5. North America Prosthetics Market Value Forecast, by Country, 2017–2027
11.5.1. U.S.
11.5.2. Canada
11.6. North America Prosthetics Market Attractiveness Analysis
11.6.1. By Product
11.6.2. By Indication
11.6.3. By Technology (orthopedic prosthetics)
11.6.4. By Country
12. Europe Prosthetics Market Analysis and Forecast
12.1. Key Findings
12.2. Europe Prosthetics Market Value Forecast, by Product, 2017–2027
12.2.1. Orthopedic Prosthetics
12.2.1.1. Upper Extremity
12.2.1.1.1. Shoulder Disarticulation
12.2.1.1.2. Transhumeral
12.2.1.1.3. Elbow Disarticulation
12.2.1.1.4. Transradial
12.2.1.1.5. Wrist Disarticulation and partial hand
12.2.1.2. Lower Extremity
12.2.1.2.1. Foot Amputation
12.2.1.2.2. Transtibial
12.2.1.2.3. Knee Disarticulation
12.2.1.2.4. Transfemoral
12.2.1.2.5. Hip Disarticulation
12.2.1.3. Sockets
12.2.1.4. Liners
12.2.1.5. Others
12.2.2. Dental Prosthetics
12.2.2.1. Crowns
12.2.2.2. Bridges
12.2.2.3. Veneers
12.2.2.4. Inlays & Onlays
12.2.2.5. Dentures
12.2.2.5.1. Partial
12.2.2.5.2. Complete
12.2.3. Others
12.3. Europe Prosthetics Market Value Forecast, by End-user, 2017–2027
12.3.1. Hospitals
12.3.2. Specialty Clinics
12.3.3. Dental Clinics
12.3.4. Others
12.4. Europe Prosthetics Market Value Forecast, by Technology (Orthopedic Prosthetics), 2017–2027
12.4.1. Cosmetic Prosthetics
12.4.2. Cable Operated/Body Powered
12.4.3. Electrically powered/Myoelectric
12.4.4. Others
12.5. Europe Prosthetics Market Value Forecast, by Country/Sub-region, 2017–2027
12.5.1. U.K.
12.5.2. Germany
12.5.3. France
12.5.4. Italy
12.5.5. Spain
12.5.6. Rest of Europe
12.6. Europe Prosthetics Market Attractiveness Analysis
12.6.1. By Product
12.6.2. By End-user
12.6.3. By Technology (orthopedic prosthetics)
12.6.4. By Country/Sub-region
13. Asia Pacific Prosthetics Market Analysis and Forecast
13.1. Key Findings
13.2. Asia Pacific Prosthetics Market Value Forecast, by Product, 2017–2027
13.2.1. Orthopedic Prosthetics
14. Upper Extremity
14.1.1.1.1. Shoulder Disarticulation
14.1.1.1.2. Transhumeral
14.1.1.1.3. Elbow Disarticulation
14.1.1.1.4. Transradial
14.1.1.1.5. Wrist Disarticulation and partial hand
14.1.1.2. Lower Extremity
14.1.1.2.1. Foot Amputation
14.1.1.2.2. Transtibial
14.1.1.2.3. Knee Disarticulation
14.1.1.2.4. Transfemoral
14.1.1.2.5. Hip Disarticulation
14.1.1.3. Sockets
14.1.1.4. Liners
14.1.1.5. Others
14.1.2. Dental Prosthetics
14.1.2.1. Crowns
14.1.2.2. Bridges
14.1.2.3. Veneers
14.1.2.4. Inlays & Onlays
14.1.2.5. Dentures
14.1.2.5.1. Partial
14.1.2.5.2. Complete
14.1.3. Others
14.2. Asia Pacific Prosthetics Market Value Forecast, by End-user, 2017–2027
14.2.1. Hospitals
14.2.2. Specialty Clinics
14.2.3. Dental Clinics
14.2.4. Others
14.3. Asia Pacific Prosthetics Market Value Forecast, by Technology (Orthopedic Prosthetics), 2017–2027
14.3.1. Cosmetic Prosthetics
14.3.2. Cable Operated/Body Powered
14.3.3. Electrically powered/Myoelectric
14.3.4. Others
14.4. Asia Pacific Prosthetics Market Value Forecast, by Country/Sub-region, 2017–2027
14.4.1. China
14.4.2. India
14.4.3. Japan
14.4.4. Australia & New Zealand
14.4.5. Rest of Asia Pacific
14.5. Asia Pacific Prosthetics Market Attractiveness Analysis
14.5.1. By Product
14.5.2. By End-user
14.5.3. By Technology (orthopedic prosthetics)
14.5.4. By Country/Sub-region
15. Latin America Prosthetics Market Analysis and Forecast
15.1. Key Findings
15.2. Latin America Prosthetics Market Value Forecast, by Product, 2017–2027
15.2.1. Orthopedic Prosthetics
15.2.1.1. Upper Extremity
15.2.1.1.1. Shoulder Disarticulation
15.2.1.1.2. Transhumeral
15.2.1.1.3. Elbow Disarticulation
15.2.1.1.4. Transradial
15.2.1.1.5. Wrist Disarticulation and partial hand
15.2.1.2. Lower Extremity
15.2.1.2.1. Foot Amputation
15.2.1.2.2. Transtibial
15.2.1.2.3. Knee Disarticulation
15.2.1.2.4. Transfemoral
15.2.1.2.5. Hip Disarticulation
15.2.1.3. Sockets
15.2.1.4. Liners
15.2.1.5. Others
15.2.2. Dental Prosthetics
15.2.2.1. Crowns
15.2.2.2. Bridges
15.2.2.3. Veneers
15.2.2.4. Inlays & Onlays
15.2.2.5. Dentures
15.2.2.5.1. Partial
15.2.2.5.2. Complete
15.2.3. Others
15.3. Latin America Prosthetics Market Value Forecast, by End-user, 2017–2027
15.3.1. Hospitals
15.3.2. Specialty Clinics
15.3.3. Dental Clinics
15.3.4. Others
15.4. Latin America Prosthetics Market Value Forecast, by Technology (Orthopedic Prosthetics), 2017–2027
15.4.1. Cosmetic Prosthetics
15.4.2. Cable Operated/Body Powered
15.4.3. Electrically powered/Myoelectric
15.4.4. Others
15.5. Latin America Prosthetics Market Value Forecast, by Country/Sub-region, 2017–2027
15.5.1. Brazil
15.5.2. Mexico
15.5.3. Rest of Latin America
15.6. Latin America Prosthetics Market Attractiveness Analysis
15.6.1. By Product
15.6.2. By End-user
15.6.3. By Technology (orthopedic prosthetics)
15.6.4. By Country/Sub-region
16. Middle East & Africa Prosthetics Market Analysis and Forecast
16.1. Key Findings
16.2. Middle East & Africa Prosthetics Market Value Forecast, by Product, 2017–2027
16.2.1. Orthopedic Prosthetics
16.2.1.1. Upper Extremity
16.2.1.1.1. Shoulder Disarticulation
16.2.1.1.2. Transhumeral
16.2.1.1.3. Elbow Disarticulation
16.2.1.1.4. Transradial
16.2.1.1.5. Wrist Disarticulation and partial hand
16.2.1.2. Lower Extremity
16.2.1.2.1. Foot Amputation
16.2.1.2.2. Transtibial
16.2.1.2.3. Knee Disarticulation
16.2.1.2.4. Transfemoral
16.2.1.2.5. Hip Disarticulation
16.2.1.3. Sockets
16.2.1.4. Liners
16.2.1.5. Others
16.2.2. Dental Prosthetics
16.2.2.1. Crowns
16.2.2.2. Bridges
16.2.2.3. Veneers
16.2.2.4. Inlays & Onlays
16.2.2.5. Dentures
16.2.2.5.1. Partial
16.2.2.5.2. Complete
16.2.3. Others
16.3. Middle East & Africa Prosthetics Market Value Forecast, by End-user, 2017–2027
16.3.1. Hospitals
16.3.2. Specialty Clinics
16.3.3. Dental Clinics
16.3.4. Others
16.4. Middle East & Africa Prosthetics Market Value Forecast, by Technology (Orthopedic Prosthetics), 2017–2027
16.4.1. Cosmetic Prosthetics
16.4.2. Cable Operated/Body Powered
16.4.3. Electrically powered/Myoelectric
16.1.1. Others
16.5. Middle East & Africa Prosthetics Market Value Forecast, by Country/Sub-region, 2017–2027
16.5.1. GCC Countries
16.5.2. South Africa
16.5.3. Rest of Middle East & Africa
16.6. Middle East & Africa Prosthetics Market Attractiveness Analysis
16.6.1. By Product
16.62. By End-user
16.6.3. By Technology (orthopedic prosthetics)
16.6.4. By Country/Sub-region
17. Competition Landscape
17.1. Competition Matrix
17.2. Market Share Analysis, by Company, 2018
17.3. Company Profiles
17.3.1. Institut Straumann AG
17.3.1.1. Company Overview (HQ, Business Segments, Employee Strength)
17.3.1.2. Financial Overview
17.3.1.3. Product Portfolio
17.3.1.4. Strategic Overview
17.3.1.5. SWOT Analysis
17.3.2. Danaher Corporation (Nobel Biocare Services AG)
17.3.2.1. Company Overview (HQ, Business Segments, Employee Strength)
17.3.2.2. Financial Overview
17.3.2.3. Product Portfolio
17.3.2.4. Strategic Overview
17.3.2.5. SWOT Analysis
17.3.3. Zimmer Biomet Holdings, Inc.
17.3.3.1. Company Overview (HQ, Business Segments, Employee Strength)
17.3.3.2. Financial Overview
17.3.3.3. Product Portfolio
17.3.3.4. Strategic Overview
17.3.3.5. SWOT Analysis
17.3.4. Dentsply Sirona, Inc.
17.3.4.1. Company Overview (HQ, Business Segments, Employee Strength)
17.3.4.2. Financial Overview
17.3.4.3. Product Portfolio
17.3.4.4. Strategic Overview
17.3.4.5. SWOT Analysis
17.3.5. BioHorizons, Inc.
17.3.5.1. Company Overview (HQ, Business Segments, Employee Strength)
17.3.5.2. Financial Overview
17.3.5.3. Product Portfolio
17.3.5.4. Strategic Overview
17.3.5.5. SWOT Analysis
17.3.6. Hanger, Inc.
17.3.6.1. Company Overview (HQ, Business Segments, Employee Strength)
17.3.6.2. Financial Overview
17.3.6.3. Product Portfolio
17.3.6.4. Strategic Overview
17.3.6.5. SWOT Analysis
17.3.7. Össur
17.3.7.1. Company Overview (HQ, Business Segments, Employee Strength)
17.3.7.2. Financial Overview
17.3.7.3. Product Portfolio
17.3.7.4. Strategic Overview
17.3.7.5. SWOT Analysis
17.3.8. Ohio Willow Wood Company
17.3.8.1. Company Overview (HQ, Business Segments, Employee Strength)
17.3.8.2. Financial Overview
17.3.8.3. Product Portfolio
17.3.8.4. Strategic Overview
17.3.8.5. SWOT Analysis
17.3.9. Ottobock SE & Co. KGaA
17.3.9.1. Company Overview (HQ, Business Segments, Employee Strength)
17.3.9.2. Financial Overview
17.3.9.3. Product Portfolio
17.3.9.4. Strategic Overview
17.3.9.5. SWOT Analysis
17.3.10. Blatchford Group (Chas. A. Blatchford & Sons Ltd.)
17.3.10.1. Company Overview (HQ, Business Segments, Employee Strength)
17.3.10.2. Financial Overview
17.3.10.3. Product Portfolio
17.3.10.4. Strategic Overview
17.3.10.5. SWOT Analysis
List of Tables
Table 01: Global Prosthetics Market Value (US$ Mn) Forecast, by Product, 2017–2027
Table 02: Global Prosthetics Market Value (US$ Mn) Forecast, by Orthopedic Prosthetics, 2017–2027
Table 03: Global Prosthetics Market Value (US$ Mn) Forecast, by Upper Extremity, 2017–2027
Table 04: Global Prosthetics Market Value (US$ Mn) Forecast, by Lower Extremity, 2017–2027
Table 05: Global Prosthetics Market Value (US$ Mn) Forecast, by Dental Prosthetics, 2017–2027
Table 06: Global Prosthetics Market Value (US$ Mn) Forecast, by Dentures, 2017–2027
Table 07: Global Prosthetics Market Value (US$ Mn) Forecast, by Technology (Orthopedic Prosthetics), 2017–2027
Table 08: Global Prosthetics Market Value (US$ Mn) Forecast, by End-user, 2017–2027
Table 09: Global Prosthetics Market Value (US$ Mn) Forecast, by Region, 2017–2027
Table 10: North America Prosthetics Market Value (US$ Mn) Forecast, by Country, 2017–2027
Table 11: North America Prosthetics Market Value (US$ Mn) Forecast, by Product, 2017–2027
Table 12: North America Prosthetics Market Value (US$ Mn) Forecast, by Orthopedic Prosthetics, 2017–2027
Table 13: North America Prosthetics Market Value (US$ Mn) Forecast, by Upper Extremity, 2017–2027
Table 14: North America Prosthetics Market Value (US$ Mn) Forecast, by Lower Extremity, 2017–2027
Table 15: North America Prosthetics Market Value (US$ Mn) Forecast, by Dental Prosthetics, 2017–2027
Table 16: North America Prosthetics Market Value (US$ Mn) Forecast, by Dentures, 2017–2027
Table 17: North America Prosthetics Market Value (US$ Mn) Forecast, by Technology (Orthopedic Prosthetics), 2017–2027
Table 18: North America Prosthetics Market Value (US$ Mn) Forecast, by End-user, 2017–2027
Table 19: Europe Prosthetics Market Value (US$ Mn) Forecast, by Country, 2017–2027
Table 20: Europe Prosthetics Market Value (US$ Mn) Forecast, by Product, 2017–2027
Table 21: Europe Prosthetics Market Value (US$ Mn) Forecast, by Orthopedic Prosthetics, 2017–2027
Table 22: Europe Prosthetics Market Value (US$ Mn) Forecast, by Upper Extremity, 2017–2027
Table 23: Europe Prosthetics Market Value (US$ Mn) Forecast, by Lower Extremity, 2017–2027
Table 24: Europe Prosthetics Market Value (US$ Mn) Forecast, by Dental Prosthetics, 2017–2027
Table 25: Europe Prosthetics Market Value (US$ Mn) Forecast, by Dentures, 2017–2027
Table 26: Europe Prosthetics Market Value (US$ Mn) Forecast, by Technology (Orthopedic Prosthetics), 2017–2027
Table 27: Europe Prosthetics Market Value (US$ Mn) Forecast, by End-user, 2017–2027
Table 28: Asia Pacific Prosthetics Market Value (US$ Mn) Forecast, by Country, 2017–2027
Table 29: Asia Pacific Prosthetics Market Value (US$ Mn) Forecast, by Product, 2017–2027
Table 30: Asia Pacific Prosthetics Market Value (US$ Mn) Forecast, by Orthopedic Prosthetics, 2017–2027
Table 31: Asia Pacific Prosthetics Market Value (US$ Mn) Forecast, by Upper Extremity, 2017–2027
Table 32: Asia Pacific Prosthetics Market Value (US$ Mn) Forecast, by Lower Extremity, 2017–2027
Table 33: Asia Pacific Prosthetics Market Value (US$ Mn) Forecast, by Dental Prosthetics, 2017–2027
Table 34: Asia Pacific Prosthetics Market Value (US$ Mn) Forecast, by Dentures, 2017–2027
Table 35: Asia Pacific Prosthetics Market Value (US$ Mn) Forecast, by Technology (Orthopedic Prosthetics), 2017–2027
Table 36: Asia Pacific Prosthetics Market Value (US$ Mn) Forecast, by End-user, 2017–2027
Table 37: Latin America Prosthetics Market Value (US$ Mn) Forecast, by Country, 2017–2027
Table 38: Latin America Prosthetics Market Value (US$ Mn) Forecast, by Product, 2017–2027
Table 39: Latin America Prosthetics Market Value (US$ Mn) Forecast, by Orthopedic Prosthetics, 2017–2027
Table 40: Latin America Prosthetics Market Value (US$ Mn) Forecast, by Upper Extremity, 2017–2027
Table 41: Latin America Prosthetics Market Value (US$ Mn) Forecast, by Lower Extremity, 2017–2027
Table 42: Latin America Prosthetics Market Value (US$ Mn) Forecast, by Dental Prosthetics, 2017–2027
Table 43: Latin America Prosthetics Market Value (US$ Mn) Forecast, by Dentures, 2017–2027
Table 44: Latin America Prosthetics Market Value (US$ Mn) Forecast, by Technology (Orthopedic Prosthetics), 2017–2027
Table 45: Latin America Prosthetics Market Value (US$ Mn) Forecast, by End-user, 2017–2027
Table 46: Middle East & Africa Prosthetics Market Value (US$ Mn) Forecast, by Country, 2017–2027
Table 47: Middle East & Africa Prosthetics Market Value (US$ Mn) Forecast, by Product, 2017–2027
Table 48: Middle East & Africa Prosthetics Market Value (US$ Mn) Forecast, by Orthopedic Prosthetics, 2017–2027
Table 49: Middle East & Africa Prosthetics Market Value (US$ Mn) Forecast, by Upper Extremity, 2017–2027
Table 50: Middle East & Africa Prosthetics Market Value (US$ Mn) Forecast, by Lower Extremity, 2017–2027
Table 51: Middle East & Africa Prosthetics Market Value (US$ Mn) Forecast, by Dental Prosthetics, 2017–2027
Table 52: Middle East & Africa Prosthetics Market Value (US$ Mn) Forecast, by Dentures, 2017–2027
Table 53: Middle East & Africa Prosthetics Market Value (US$ Mn) Forecast, by Technology (Orthopedic Prosthetics), 2017–2027
Table 54: Middle East & Africa Prosthetics Market Value (US$ Mn) Forecast, by End-user, 2017–2027
List of Figures
Figure 01: Global Prosthetics Market Snapshot
Figure 02: Global Prosthetics Market Value (US$ Mn) and Distribution (%), by Region, 2019 and 2027
Figure 03: Global Prosthetics Market Value (US$ Mn) Forecast, 2017–2027
Figure 04: Global Prosthetics Market Value Share (%), by Product, 2019
Figure 05: Global Prosthetics Market Value Share (%), by Orthopedic Prosthetics, 2019
Figure 06: Global Prosthetics Market Value Share (%), by Dental Prosthetics, 2019
Figure 07: Global Prosthetics Market Value Share (%), by End-user, 2019
Figure 08: U.S. Medical Device Approval Process
Figure 09: Europe Medical Device Approval Process
Figure 10: Japan Medical Device Approval Process
Figure 11: Prosthetics Market - Key Industry Developments
Figure 12: Value Chain Analysis: Global Dental Prosthetics Market
Figure 13: Value Chain Analysis: Global Orthopedic Prosthetics Market
Figure 14: Global Prosthetics Market Value Share (%), by Product, 2018 and 2027
Figure 15: Global Prosthetics Market Value Share (%), by Orthopedic Prosthetics, 2018 and 2027
Figure 16: Global Prosthetics Market Value Share (%), by Dental Prosthetics, 2018 and 2027
Figure 17: Global Prosthetics Market Value (US$ Mn), by Orthopedic Prosthetics, 2017–2027
Figure 18: Global Prosthetics Market Value (US$ Mn), by Dental Prosthetics, 2017–2027
Figure 19: Global Prosthetics Market Value (US$ Mn), by Others, 2017–2027
Figure 20: Global Prosthetics Market Value (US$ Mn), by Upper Extremity, 2017–2027
Figure 21: Global Prosthetics Market Value (US$ Mn), by Lower Extremity, 2017–2027
Figure 22: Global Prosthetics Market Value (US$ Mn), by Sockets, 2017–2027
Figure 23: Global Prosthetics Market Value (US$ Mn), by Liners, 2017–2027
Figure 24: Global Prosthetics Market Value (US$ Mn), by Others, 2017–2027
Figure 25: Global Prosthetics Market Value (US$ Mn), by Crowns, 2017–2027
Figure 26: Global Prosthetics Market Value (US$ Mn), by Bridges, 2017–2027
Figure 27: Global Prosthetics Market Value (US$ Mn), by Veneers, 2017–2027
Figure 28: Global Prosthetics Market Value (US$ Mn), by Inlays & Onlays, 2017–2027
Figure 29: Global Prosthetics Market Value (US$ Mn), by Dentures, 2017–2027
Figure 30: Global Prosthetics Market Attractiveness Analysis, by Product, 2019–2027
Figure 31: Global Prosthetics Market Attractiveness Analysis, by Orthopedic Prosthetics, 2019–2027
Figure 32: Global Prosthetics Market Attractiveness Analysis, by Dental Prosthetics, 2019–2027
Figure 33: Global Prosthetics Market Value Share (%), by End-user, 2018 and 2027
Figure 34: Global Prosthetics Market Attractiveness Analysis, by Technology (Orthopedic Prosthetics), 2019–2027
Figure 35: Global Prosthetics Market Value (US$ Mn), by Cosmetic Prosthetics, 2017–2027
Figure 36: Global Prosthetics Market Value (US$ Mn), by Cable Operated/Body Powered, 2017–2027
Figure 37: Global Prosthetics Market Value (US$ Mn), by Electrically Powered/Myoelectric, 2017–2027
Figure 38: Global Prosthetics Market Value (US$ Mn), by Others, 2017–2027
Figure 39: Global Prosthetics Market Value Share (%), by End-user, 2018 and 2027
Figure 40: Global Prosthetics Market Value (US$ Mn), by Hospitals, 2017–2027
Figure 41: Global Prosthetics Market Value (US$ Mn), by Specialty Clinics, 2017–2027
Figure 42: Global Prosthetics Market Value (US$ Mn), by Dental Clinics, 2017–2027
Figure 43: Global Prosthetics Market Value (US$ Mn), by Others, 2017–2027
Figure 44: Global Prosthetics Market Attractiveness Analysis, by End-user, 2019–2027
Figure 45: Global Prosthetics Market Value Share Analysis, by Region, 2018 and 2027
Figure 46: Global Prosthetics Market Attractiveness Analysis, by Region, 2019–2027
Figure 47: North America Prosthetics Market Value (US$ Mn) and Y-o-Y Growth (%) Forecast, 2017–2027
Figure 48: North America Prosthetics Market Attractiveness Analysis, by Country, 2019–2027
Figure 49: North America Prosthetics Market Value Share Analysis, by Country, 2018 and 2027
Figure 50: North America Prosthetics Market Value Share Analysis, by Product, 2018 and 2027
Figure 51: North America Prosthetics Market Value Share Analysis, by Orthopedic Prosthetics, 2018 and 2027
Figure 52: North America Prosthetics Market Value Share Analysis, by Dental Prosthetics, 2018 and 2027
Figure 53: North America Prosthetics Market Value Share (%), by Technology (Orthopedic Prosthetics), 2018 and 2027
Figure 54: North America Prosthetics Market Value Attractiveness Analysis, by Technology (Orthopedic Prosthetics), 2019–2027
Figure 55: North America Prosthetics Market Value Share Analysis, by End-user, 2018 and 2027
Figure 56: North America Prosthetics Market Attractiveness, by Product, 2019?2027
Figure 57: North America Prosthetics Market Attractiveness, by Orthopedic Prosthetics, 2019?2027
Figure 58: North America Prosthetics Market Attractiveness, by Dental Prosthetics, 2019?2027
Figure 59: North America Prosthetics Market Attractiveness, by End-user, 2019?2027
Figure 60: Europe Prosthetics Market Value (US$ Mn) and Y-o-Y Growth (%) Forecast, 2017–2027
Figure 61: Europe Prosthetics Market Attractiveness Analysis, by Country, 2019–2027
Figure 62: Europe Prosthetics Market Value Share Analysis, by Country, 2018 and 2027
Figure 63: Europe Prosthetics Market Value Share Analysis, by Product, 2018 and 2027
Figure 64: Europe Prosthetics Market Value Share Analysis, by Orthopedic Prosthetics, 2018 and 2027
Figure 65: Europe Prosthetics Market Value Share Analysis, by Dental Prosthetics, 2018 and 2027
Figure 66: Europe Prosthetics Market Value Share (%), by Technology (Orthopedic Prosthetics), 2018 and 2027
Figure 67: Europe Prosthetics Market Value Attractiveness Analysis, by Technology (Orthopedic Prosthetics), 2019?2027
Figure 68: Europe Prosthetics Market Value Share Analysis, by End-user, 2018 and 2027
Figure 69: Europe Prosthetics Market Attractiveness, by Product, 2019?2027
Figure 70: Europe Prosthetics Market Attractiveness, by Orthopedic Prosthetics, 2019?2027
Figure 71: Europe Prosthetics Market Attractiveness, by Dental Prosthetics, 2019?2027
Figure 72: Europe Prosthetics Market Attractiveness, by End-user, 2019?2027
Figure 73: Asia Pacific Prosthetics Market Value (US$ Mn) and Y-o-Y Growth (%) Forecast, 2017–2027
Figure 74: Asia Pacific Prosthetics Market Attractiveness Analysis, by Country, 2019–2027
Figure 75: Asia Pacific Prosthetics Market Value Share Analysis, by Country, 2018 and 2027
Figure 76: Asia Pacific Prosthetics Market Value Share Analysis, by Product, 2018 and 2027
Figure 77: Asia Pacific Prosthetics Market Value Share Analysis, by Orthopedic Prosthetics, 2018 and 2027
Figure 78: Asia Pacific Prosthetics Market Value Share Analysis, by Dental Prosthetics, 2018 and 2027
Figure 79: Asia Pacific Prosthetics Market Value Share (%), by Technology (Orthopedic Prosthetics), 2018 and 2027
Figure 80: Asia Pacific Prosthetics Market Value Attractiveness Analysis, by Technology (Orthopedic Prosthetics), 2019–2027
Figure 81: Asia Pacific Prosthetics Market Value Share Analysis, by End-user, 2018 and 2027
Figure 82: Asia Pacific Prosthetics Market Attractiveness, by Product, 2019?2027
Figure 83: Asia Pacific Prosthetics Market Attractiveness, by Orthopedic Prosthetics, 2019?2027
Figure 84: Asia Pacific Prosthetics Market Attractiveness, by Dental Prosthetics, 2019?2027
Figure 85: Asia Pacific Prosthetics Market Attractiveness, by End-user, 2019?2027
Figure 86: Latin America Prosthetics Market Value (US$ Mn) and Y-o-Y Growth (%) Forecast, 2017–2027
Figure 87: Latin America Prosthetics Market Attractiveness Analysis, by Country, 2019–2027
Figure 88: Latin America Prosthetics Market Value Share Analysis, by Country, 2018 and 2027
Figure 89: Latin America Prosthetics Market Value Share Analysis, by Product, 2018 and 2027
Figure 90: Latin America Prosthetics Market Value Share Analysis, by Orthopedic Prosthetics, 2018 and 2027
Figure 91: Latin America Prosthetics Market Value Share Analysis, by Dental Prosthetics, 2018 and 2027
Figure 92: Latin America Prosthetics Market Value Share (%), by Technology (Orthopedic Prosthetics), 2018 and 2027
Figure 93: Latin America Prosthetics Market Value Attractiveness Analysis, by Technology (Orthopedic Prosthetics), 2019?2027
Figure 94: Latin America Prosthetics Market Value Share Analysis, by End-user, 2018 and 2027
Figure 95: Latin America Prosthetics Market Attractiveness, by Product, 2019?2027
Figure 96: Latin America Prosthetics Market Attractiveness, by Orthopedic Prosthetics, 2019?2027
Figure 97: Latin America Prosthetics Market Attractiveness, by Dental Prosthetics, 2019?2027
Figure 98: Latin America Prosthetics Market Attractiveness, by End-user, 2019?2027
Figure 99: Middle East & Africa Prosthetics Market Value (US$ Mn) and Y-o-Y Growth (%) Forecast, 2017–2027
Figure 100: Middle East & Africa Prosthetics Market Attractiveness Analysis, by Country, 2019–2027
Figure 101: Middle East & Africa Prosthetics Market Value Share Analysis, by Country, 2018 and 2027
Figure 102: Middle East & Africa Prosthetics Market Value Share Analysis, by Product, 2018 and 2027
Figure 103: Middle East & Africa Prosthetics Market Value Share Analysis, by Orthopedic Prosthetics, 2018 and 2027
Figure 104: Middle East & Africa Prosthetics Market Value Share Analysis, by Dental Prosthetics, 2018 and 2027
Figure 105: Middle East & Africa Prosthetics Market Value Share (%), by Technology (Orthopedic Prosthetics), 2018 and 2027
Figure 106: Middle East & Africa Prosthetics Market Value Attractiveness Analysis, by Technology (Orthopedic Prosthetics), 2019–2027
Figure 107: Middle East & Africa Prosthetics Market Value Share Analysis, by End-user, 2018 and 2027
Figure 108: Middle East & Africa Prosthetics Market Attractiveness, by Product, 2019?2027
Figure 109: Middle East & Africa Prosthetics Market Attractiveness, by Orthopedic Prosthetics, 2019?2027
Figure 110: Middle East & Africa Prosthetics Market Attractiveness, by Dental Prosthetics, 2019?2027
Figure 111: Middle East & Africa Prosthetics Market Attractiveness, by End-user, 2019?2027
Figure 112: Global Prosthetics Market Share, by Company, 2018
Copyright © Transparency Market Research, Inc. All Rights reserved
Trust Online

Prosthetics Market