
Reports
Reports
The most challenging vascular injuries involve trauma caused to the abdomen, pelvis, and retroperitoneal structures of the body. Complications such as difficulty in acquiring immediate proximal control & appropriate exposure, treatment of injury in face of contamination, and provisions for prolonged surveillance & follow-up have increased the need for vascular injury treatment.
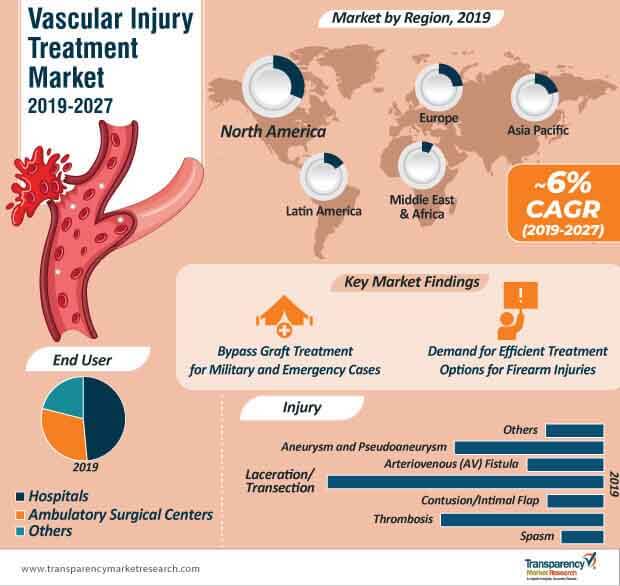
Vascular injuries can occur in civilian as well as military setting. Traumatic vascular injury caused due to explosions and projectiles such as bullets and shrapnel severely affect the arteries and veins of the limbs, and trigger excessive blood loss and ischemia. Thus, there is the constant need for instant relief and effective treatment solutions for vascular injuries in military and emergency cases.
As such, healthcare providers in the vascular injury treatment landscape are adopting the extra-anatomical aortic bypass graft to solve grave vascular injuries in military and emergency cases. Adequately-sized interposition grafts help in the successful management and repair of damaged tissues and other serious vascular injuries.
Growing incidences of anticancer drug induced arterial injuries are surfacing in the vascular injury treatment ecosystem. The side effects of chemotherapeutic drugs and anti-tumor medicines complicate treatment cycles. These side effects are some of the causes for the increase in non-cancer-related mortality rates, and affect the quality of life of cancer survivors. Growing incidences of arterial thromboembolic events (ATEE) are also associated with the consumption of anti-cancer drugs.
As such, stakeholders need to develop treatment solutions to assess the high risks of vascular complications, and innovate on antithrombotic therapies that keep a tab on thromboembolic and bleeding risks. Preventive measures and individualized chemotherapy serve as viable treatment steps to reduce the incidences of anti-tumor treatment-related vascular events. As such, ongoing research and development is being carried out to address ATEE risk stratification, which helps in early prediction and reduced complications in cancer survivors.
A recent study on vascular injury treatment, conducted by researchers from the Boston University School of Medicine (BUSM), stated that, individuals who suffered firearm injuries and underwent surgical repair of major blood vessels were more susceptible to the high injury severity score (a scale made to predict in-hospital deaths).
In many cases, individuals that suffer firearm injuries due to gunshots undergo vascular injury treatment to repair the damage caused by bullets to major blood vessels. After several cross-validations, it found that, individuals who underwent surgical repair of their major blood vessels accounted for a high injury severity score as compared to those who didn’t undergo surgical repair treatment. Further studies showed that, the risk of death increased by five times, and complications increased three times, due to surgical repair treatment.
Complications such as venous thromboembolism, kidney failure, sepsis, and heart and neurologic-related complexes were greater in patients who underwent repair of their major blood vessels. Thus, stakeholders in the vascular injury treatment landscape need to carry out clinical trials to better understand firearm injuries and the impact of surgical repair on major blood vessels. Improvements in trauma care can help emergency medicine physicians and vascular injury treatment surgeons develop efficient treatment solutions for gun violence survivors.
Analysts’ Viewpoint
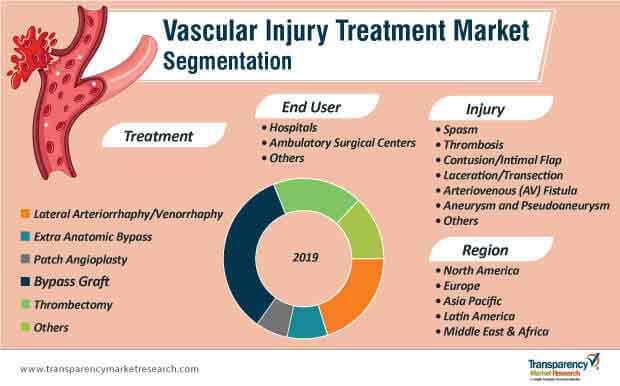
Analysts of the vascular injury treatment market have a promising outlook for its growth potential during the forecast period of 2019-2027. Stakeholders in the landscape are developing innovative offerings for bypass graft and lateral arteriorrhaphy treatment solutions. Increasing incidences of firearm injuries and arterial thromboembolic events in cancer patients have influenced the need for efficacious vascular injury treatment solutions. However, there is the need to improvise on the surgical repair treatment of major blood vessels for firearm injuries to avoid complications. Stakeholders in the vascular injury treatment landscape are developing preventive measures to reduce incidences of arterial thromboembolic events and improving trauma care for firearm injuries. Since bypass graft treatment accounts for a market share of ~34% in the vascular injury treatment landscape, stakeholders need to innovate on allograft repair treatment, as adequate frequency of follow-ups have resulted in excellent outcomes for patients.
Vascular Injury Treatment Market: Overview
Rise in Prevalence of Vascular Injuries: Key Driver of Vascular Injury Treatment Market
Focus on Collaborations, Agreements, Partnerships, and Technological Advancements
Vascular Injury Treatment Market: High Cost of Treatment
Global Vascular Injury Treatment Market: Competitive Landscape
Global Vascular Injury Treatment Market: Key Developments
Key manufacturers in the global vascular injury treatment market are strengthening their overseas sales structure by expanding their production capacities. Other developments in the global vascular injury treatment market are listed below.
Vascular injury treatment market to reach a value of ~US$ 4.8 Bn by 2027
Vascular injury treatment market is anticipated to expand at a CAGR of ~6% from 2019 to 2027
Vascular injury treatment market is driven by rise in the prevalence of vascular injuries
The laceration/transection segment dominated the global urinary incontinence treatment market during the forecast period
Key players in the global vascular injury treatment market include Cleveland Clinic, Apollo Hospitals Enterprise Ltd., Massachusetts General Hospital, Heidelberg University Hospital, Royal Berkshire NHS Foundation Trust
1. Preface
1.1. Market Definition and Scope
1.2. Market Segmentation
1.3. Key Research Objectives
1.4. Research Highlights
2. Assumptions and Research Methodology
3. Executive Summary: Global Vascular Injury Treatment Market
4. Market Overview
4.1. Introduction
4.1.1. Definition
4.1.2. Industry Evolution / Developments
4.2. Overview
4.3. Market Dynamics
4.3.1. Drivers
4.3.2. Restraints
4.3.3. Opportunities
4.4. Global Vascular Injury Treatment Market Analysis and Forecast, 2017–2027
4.4.1. Market Revenue Projections (US$ Mn)
5. Market Outlook
5.1. Reimbursement Scenario
5.2. Regulatory Scenario
5.3. Technological Advancements
5.4. Number of Vascular Injury Incidences, by Region, (2018)
5.4.1. Penetrating Wounds
5.4.2. Blunt Trauma
5.4.3. Invasive Procedures
6. Global Vascular Injury Treatment Market Analysis and Forecast, by Injury
6.1. Introduction & Definition
6.2. Key Findings / Developments
6.3. Market Value Forecast, by Injury, 2017–2027
6.3.1. Spasm
6.3.2. Thrombosis
6.3.3. Contusion/Intimal Flap
6.3.4. Laceration/Transection
6.3.5. Arteriovenous (AV) Fistula
6.3.6. Aneurysm and Pseudoaneurysm
6.3.7. Others
6.4. Market Attractiveness, by Injury
7. Global Vascular Injury Treatment Market Analysis and Forecast, by Treatment
7.1. Introduction & Definition
7.2. Key Findings / Developments
7.3. Market Value Forecast, by Treatment, 2017–2027
7.3.1. Lateral Arteriorrhaphy/ Venorrhaphy
7.3.2. Patch Angioplasty
7.3.3. Bypass Graft
7.3.4. Extraanatomic Bypass
7.3.5. Thrombectomy
7.3.6. Others
7.4. Market Attractiveness, by Treatment
8. Global Vascular Injury Treatment Market Analysis and Forecast, by End User
8.1. Introduction & Definition
8.2. Key Findings / Developments
8.3. Market Value Forecast, by End User, 2017–2027
8.3.1. Hospitals
8.3.2. Ambulatory Surgical Centers
8.3.3. Others
8.4. Market Attractiveness, by End User
9. Global Vascular Injury Treatment Market Analysis and Forecast, by Region
9.1. Key Findings
9.2. Market Value Forecast, by Region
9.2.1. North America
9.2.2. Europe
9.2.3. Asia Pacific
9.2.4. Latin America
9.2.5. Middle East & Africa
9.3. Market Attractiveness, by Country/Region
10. North America Vascular Injury Treatment Market Analysis and Forecast
10.1. Introduction
10.1.1. Key Findings
10.2. Market Value Forecast, by Injury, 2017–2027
10.2.1. Spasm
10.2.2. Thrombosis
10.2.3. Contusion/Intimal Flap
10.2.4. Laceration/Transection
10.2.5. Arteriovenous (AV) Fistula
10.2.6. Aneurysm and Pseudoaneurysm
10.2.7. Others
10.3. Market Value Forecast, by Treatment, 2017–2027
10.3.1. Lateral Arteriorrhaphy/ Venorrhaphy
10.3.2. Patch Angioplasty
10.3.3. Bypass Graft
10.3.4. Extraanatomic Bypass
10.3.5. Thrombectomy
10.3.6. Others
10.4. Market Value Forecast, by End User, 2017–2027
10.4.1. Hospitals
10.4.2. Ambulatory Surgical Centers
10.4.3. Others
10.5. Market Value Forecast, by Country, 2017–2027
10.5.1. U.S.
10.5.2. Canada
10.6. Market Attractiveness Analysis
10.6.1. By Injury
10.6.2. By Treatment
10.6.3. By End User
10.6.4. By Country
11. Europe Vascular Injury Treatment Market Analysis and Forecast
11.1. Introduction
11.1.1. Key Findings
11.2. Market Value Forecast, by Injury, 2017–2027
11.2.1. Spasm
11.2.2. Thrombosis
11.2.3. Contusion/Intimal Flap
11.2.4. Laceration/Transection
11.2.5. Arteriovenous (AV) Fistula
11.2.6. Aneurysm and Pseudoaneurysm
11.2.7. Others
11.3. Market Value Forecast, by Treatment, 2017–2027
11.3.1. Lateral Arteriorrhaphy/ Venorrhaphy
11.3.2. Patch Angioplasty
11.3.3. Bypass Graft
11.3.4. Extraanatomic Bypass
11.3.5. Thrombectomy
11.3.6. Others
11.4. Market Value Forecast, by End User, 2017–2027
11.4.1. Hospitals
11.4.2. Ambulatory Surgical Centers
11.4.3. Others
11.5. Market Value Forecast, by Country/Sub-region, 2017–2027
11.5.1. Germany
11.5.2. U.K.
11.5.3. France
11.5.4. Spain
11.5.5. Italy
11.5.6. Rest of Europe
11.6. Market Attractiveness Analysis
11.6.1. By Injury
11.6.2. By Treatment
11.6.3. By End User
11.6.4. By Country/Sub-region
12. Asia Pacific Vascular Injury Treatment Market Analysis and Forecast
12.1. Introduction
12.1.1. Key Findings
12.2. Market Value Forecast, by Injury, 2017–2027
12.2.1. Spasm
12.2.2. Thrombosis
12.2.3. Contusion/Intimal Flap
12.2.4. Laceration/Transection
12.2.5. Arteriovenous (AV) Fistula
12.2.6. Aneurysm and Pseudoaneurysm
12.2.7. Others
12.3. Market Value Forecast, by Treatment, 2017–2027
12.3.1. Lateral Arteriorrhaphy/ Venorrhaphy
12.3.2. Patch Angioplasty
12.3.3. Bypass Graft
12.3.4. Extraanatomic Bypass
12.3.5. Thrombectomy
12.3.6. Others
12.4. Market Value Forecast, by End User, 2017–2027
12.4.1. Hospitals
12.4.2. Ambulatory Surgical Centers
12.4.3. Others
12.5. Market Value Forecast, by Country/Sub-region, 2017–2027
12.5.1. China
12.5.2. Japan
12.5.3. India
12.5.4. Australia & New Zealand
12.5.5. Rest of Asia Pacific
12.6. Market Attractiveness Analysis
12.6.1. By Injury
12.6.2. By Treatment
12.6.3. By End User
12.6.4. By Country/Sub-region
13. Latin America Vascular Injury Treatment Market Analysis and Forecast
13.1. Introduction
13.1.1. Key Findings
13.2. Market Value Forecast, by Injury, 2017–2027
13.2.1. Spasm
13.2.2. Thrombosis
13.2.3. Contusion/Intimal Flap
13.2.4. Laceration/Transection
13.2.5. Arteriovenous (AV) Fistula
13.2.6. Aneurysm and Pseudoaneurysm
13.2.7. Others
13.3. Market Value Forecast, by Treatment, 2017–2027
13.3.1. Lateral Arteriorrhaphy/ Venorrhaphy
13.3.2. Patch Angioplasty
13.3.3. Bypass Graft
13.3.4. Extraanatomic Bypass
13.3.5. Thrombectomy
13.3.6. Others
13.4. Market Value Forecast, by End User, 2017–2027
13.4.1. Hospitals
13.4.2. Ambulatory Surgical Centers
13.4.3. Others
13.5. Market Value Forecast, by Country/Sub-region, 2017–2027
13.5.1. Brazil
13.5.2. Mexico
13.5.3. Rest of Latin America
13.6. Market Attractiveness Analysis
13.6.1. By Injury
13.6.2. By Treatment
13.6.3. By End User
13.6.4. By Country/Sub-region
14. Middle East & Africa Vascular Injury Treatment Market Analysis and Forecast
14.1. Introduction
14.1.1. Key Findings
14.2. Market Value Forecast, by Injury, 2017–2027
14.2.1. Spasm
14.2.2. Thrombosis
14.2.3. Contusion/Intimal Flap
14.2.4. Laceration/Transection
14.2.5. Arteriovenous (AV) Fistula
14.2.6. Aneurysm and Pseudoaneurysm
14.2.7. Others
14.3. Market Value Forecast, by Treatment, 2017–2027
14.3.1. Lateral Arteriorrhaphy/ Venorrhaphy
14.3.2. Patch Angioplasty
14.3.3. Bypass Graft
14.3.4. Extraanatomic Bypass
14.3.5. Thrombectomy
14.3.6. Others
14.4. Market Value Forecast, by End User, 2017–2027
14.4.1. Hospitals
14.4.2. Ambulatory Surgical Centers
14.4.3. Others
14.5. Market Value Forecast, by Country/Sub-region, 2017–2027
14.5.1. GCC Countries
14.5.2. South Africa
14.5.3. Rest of Middle East & Africa
14.6. Market Attractiveness Analysis
14.6.1. By Injury
14.6.2. By Treatment
14.6.3. By End User
14.6.4. By Country/Sub-region
15. Competition Landscape
15.1. Company Profiles
15.1.1. Cleveland Clinic
15.1.1.1. Company Overview (HQ, Business Segments, Employee Strength)
15.1.1.2. Company Financials
15.1.1.3. Growth Strategies
15.1.1.4. SWOT Analysis
15.1.2. Apollo Hospitals Enterprise Ltd.
15.1.2.1. Company Overview (HQ, Business Segments, Employee Strength)
15.1.2.2. Company Financials
15.1.2.3. Growth Strategies
15.1.2.4. SWOT Analysis
15.1.3. Massachusetts General Hospital
15.1.3.1. Company Overview (HQ, Business Segments, Employee Strength)
15.1.3.2. Company Financials
15.1.3.3. Growth Strategies
15.1.3.4. SWOT Analysis
15.1.4. Heidelberg University Hospital
15.1.4.1. Company Overview (HQ, Business Segments, Employee Strength)
15.1.4.2. Company Financials
15.1.4.3. Growth Strategies
15.1.4.4. SWOT Analysis
15.1.5. Royal Berkshire NHS Foundation Trust
15.1.5.1. Company Overview (HQ, Business Segments, Employee Strength)
15.1.5.2. Company Financials
15.1.5.3. Growth Strategies
15.1.5.4. SWOT Analysis
15.1.6. Universal Health Services, Inc.
15.1.6.1. Company Overview (HQ, Business Segments, Employee Strength)
15.1.6.2. Company Financials
15.1.6.3. Growth Strategies
15.1.6.4. SWOT Analysis
15.1.7. Tenet Healthcare
15.1.7.1. Company Overview (HQ, Business Segments, Employee Strength)
15.1.7.2. Company Financials
15.1.7.3. Growth Strategies
15.1.7.4. SWOT Analysis
15.1.8. Mayo Clinic Health System
15.1.8.1. Company Overview (HQ, Business Segments, Employee Strength)
15.1.8.2. Company Financials
15.1.8.3. Growth Strategies
15.1.8.4. SWOT Analysis
15.1.9. Mediclinic International
15.1.9.1. Company Overview (HQ, Business Segments, Employee Strength)
15.1.9.2. Company Financials
15.1.9.3. Growth Strategies
15.1.9.4. SWOT Analysis
15.1.10. CHSPSC, LLC
15.1.10.1. Company Overview (HQ, Business Segments, Employee Strength)
15.1.10.2. Company Financials
15.1.10.3. Growth Strategies
15.1.10.4. SWOT Analysis
15.1.11. IHH Healthcare Berhad
15.1.11.1. Company Overview (HQ, Business Segments, Employee Strength)
15.1.11.2. Company Financials
15.1.11.3. Growth Strategies
15.1.11.4. SWOT Analysis
*Note: Financial details for companies that do not report this information in public domain might not be captured
List of Tables
Table 01: Number of Vascular Injury Incidences, by Region, 2018
Table 02: North America Number of Vascular Injury Incidences, 2018
Table 03: Europe America Number of Vascular Injury Incidences, 2018
Table 04: Asia Pacific Number of Vascular Injury Incidences, 2018
Table 05: Latin America Number of Vascular Injury Incidences, 2018
Table 06: Middle East & Africa Number of Vascular Injury Incidences, 2018
Table 07: Global Vascular Injury Treatment Market Value (US$ Mn) Forecast, by Injury, 2017–2027
Table 08: Global Vascular Injury Treatment Market Value (US$ Mn) Forecast, by Treatment, 2017–2027
Table 09: Global Vascular Injury Treatment Market Value (US$ Mn) Forecast, by End User, 2017–2027
Table 10: Global Vascular Injury Treatment Market Value (US$ Mn) Forecast, by Region, 2017–2027
Table 11: North America Vascular Injury Treatment Market Value (US$ Mn) Forecast, by Country, 2017–2027
Table 12: North America Vascular Injury Treatment Market Value (US$ Mn) Forecast, by Injury, 2017–2027
Table 13: North America Vascular Injury Treatment Market Value (US$ Mn) Forecast, by Treatment, 2017–2027
Table 14: North America Vascular Injury Treatment Market Value (US$ Mn) Forecast, by End User, 2017?2027
Table 15: Europe Vascular Injury Treatment Market Value (US$ Mn) Forecast, by Country/Sub-region, 2017–2027
Table 16: Europe Vascular Injury Treatment Market Value (US$ Mn) Forecast, by Injury, 2017–2027
Table 17: Europe Vascular Injury Treatment Market Value (US$ Mn) Forecast, by Treatment, 2017–2027
Table 18: Europe Vascular Injury Treatment Market Value (US$ Mn) Forecast, by End User, 2017?2027
Table 19: Asia Pacific Vascular Injury Treatment Market Value (US$ Mn) Forecast, by Country/Sub-region, 2017-2027
Table 20: Asia Pacific Vascular Injury Treatment Market Value (US$ Mn) Forecast, by Injury, 2017–2027
Table 21: Asia Pacific Vascular Injury Treatment Market Value (US$ Mn) Forecast, by Treatment, 2017–2027
Table 22: Asia Pacific Vascular Injury Treatment Market Value (US$ Mn) Forecast, by End User, 2017?2027
Table 23: Latin America Vascular Injury Treatment Market Value (US$ Mn) Forecast, by Country/Sub-region, 2017–2027
Table 24: Latin America Vascular Injury Treatment Market Value (US$ Mn) Forecast, by Injury, 2017–2027
Table 25: Latin America Vascular Injury Treatment Market Value (US$ Mn) Forecast, by Treatment, 2017–2027
Table 26: Latin America Vascular Injury Treatment Market Value (US$ Mn) Forecast, by End User, 2017?2027
Table 27: Middle East & Africa Vascular Injury Treatment Market Value (US$ Mn) Forecast, by Country/Sub-region, 2017-2027
Table 28: Middle East & Africa Vascular Injury Treatment Market Value (US$ Mn) Forecast, by Injury, 2017–2027
Table 29: Middle East & Africa Vascular Injury Treatment Market Value (US$ Mn) Forecast, by Treatment, 2017–2027
Table 30: Middle East & Africa Vascular Injury Treatment Market Value (US$ Mn) Forecast, by End User, 2017?2027
List of Figures
Figure 01: Global Vascular Injury Treatment Market Value (US$ Mn) and Distribution (%), by Region, 2019 and 2027
Figure 02: Global Vascular Injury Treatment Market Value (US$ Mn) Forecast, 2017–2027
Figure 03: Global Vascular Injury Treatment Market Value Share (%), by Injury, 2018
Figure 04: Global Vascular Injury Treatment Market Value Share (%), by Treatment, 2018
Figure 05: Global Vascular Injury Treatment Market Value Share (%), by End User, 2018
Figure 06: Global Vascular Injury Treatment Market Value Share (%), by Region, 2018
Figure 07: Global Vascular Injury Treatment Market Value Share (%), by Injury, 2018 and 2027
Figure 08: Global Vascular Injury Treatment Market Value (US$ Mn), by Spasm, 2017–2027
Figure 09: Global Vascular Injury Treatment Market Value (US$ Mn), by Thrombosis, 2017–2027
Figure 10: Global Vascular Injury Treatment Market Value (US$ Mn), by Contusion/Intimal Flap, 2017–2027
Figure 11: Global Vascular Injury Treatment Market Value (US$ Mn), by Laceration/Transection, 2017–2027
Figure 12: Global Vascular Injury Treatment Market Value (US$ Mn), by Arteriovenous (AV) Fistula, 2017–2027
Figure 13: Global Vascular Injury Treatment Market Value (US$ Mn), by Aneurysm & Pseudoaneurysm, 2017–2027
Figure 14: Global Vascular Injury Treatment Market Value (US$ Mn), by Others, 2017–2027
Figure 15: Global Vascular Injury Treatment Market Attractiveness, by Injury, 2019?2027
Figure 16: Global Vascular Injury Treatment Market Value Share (%), by Treatment, 2018 and 2027
Figure 17: Global Vascular Injury Treatment Market Attractiveness, by Treatment, 2019–2027
Figure 18: Global Vascular Injury Treatment Market Value (US$ Mn), by Lateral Arteriorrhaphy/Venorrhaphy, 2017–2027
Figure 19: Global Vascular Injury Treatment Market Value (US$ Mn), by Patch Angioplasty, 2017–2027
Figure 20: Global Vascular Injury Treatment Market Value (US$ Mn), by Bypass Graft, 2017–2027
Figure 21: Global Vascular Injury Treatment Market Value (US$ Mn), by Extraanatomic Bypass, 2017–2027
Figure 22: Global Vascular Injury Treatment Market Value (US$ Mn), by Thrombectomy, 2017–2027
Figure 23: Global Vascular Injury Treatment Market Value (US$ Mn), by Others, 2017–2027
Figure 24: Global Vascular Injury Treatment Market Value Share (%), by End User, 2018 and 2027
Figure 25: Global Vascular Injury Treatment Market Attractiveness, by End User, 2019–2027
Figure 26: Global Vascular Injury Treatment Market Value (US$ Mn), by Hospitals, 2017–2027
Figure 27: Global Vascular Injury Treatment Market Value (US$ Mn), by Ambulatory Surgical Centers, 2017–2027
Figure 28: Global Vascular Injury Treatment Market Value (US$ Mn), by Others, 2017–2027
Figure 29: Global Vascular Injury Treatment Market Value Share Analysis, by Region, 2018 and 2027
Figure 30: Global Vascular Injury Treatment Market Attractiveness Analysis, by Region, 2019–2027
Figure 31: North America Vascular Injury Treatment Market Value (US$ Mn), 2017–2027
Figure 32: North America Vascular Injury Treatment Market Value Share Analysis, by Country, 2018 and 2027
Figure 33: North America Vascular Injury Treatment Market Attractiveness Analysis, by Country, 2019–2027
Figure 34: North America Vascular Injury Treatment Market Value Share (%), by Injury, 2018 and 2027
Figure 35: North America Vascular Injury Treatment Market Attractiveness, by Injury, 2019–2027
Figure 36: North America Vascular Injury Treatment Market Value Share Analysis, by Treatment, 2018 and 2027
Figure 37: North America Vascular Injury Treatment Market Attractiveness Analysis, by Treatment, 2019–2027
Figure 38: North America Vascular Injury Treatment Market Value Share (%), by End User, 2018 and 2027
Figure 39: North America Vascular Injury Treatment Market Attractiveness, by End User, 2019–2027
Figure 40: Europe Vascular Injury Treatment Market Value (US$ Mn) Forecast, 2017–2027
Figure 41: Europe Vascular Injury Treatment Market Value Share Analysis, by Country/Sub-region, 2018 and 2027
Figure 42: Europe Vascular Injury Treatment Market Attractiveness Analysis, by Country/Sub-region, 2019–2027
Figure 43: Europe Vascular Injury Treatment Market Value Share (%), by Injury, 2018 and 2027
Figure 44: Europe Vascular Injury Treatment Market Attractiveness, by Injury, 2019–2027
Figure 45: Europe Vascular Injury Treatment Market Value Share Analysis, by Treatment, 2018 and 2027
Figure 46: Europe Vascular Injury Treatment Market Attractiveness Analysis, by Treatment, 2019–2027
Figure 47: Europe Vascular Injury Treatment Market Value Share (%), by End User, 2018 and 2027
Figure 48: Europe Vascular Injury Treatment Market Attractiveness, by End User, 2019–2027
Figure 49: Asia Pacific Vascular Injury Treatment Market Value (US$ Mn), 2017–2027
Figure 50: Asia Pacific Vascular Injury Treatment Market Value Share Analysis, by Country/Sub-region, 2018 and 2027
Figure 51: Asia Pacific Vascular Injury Treatment Market Attractiveness Analysis, by Country/Sub-region, 2019–2027
Figure 52: Asia Pacific Vascular Injury Treatment Market Value Share (%), by Injury, 2018 and 2027
Figure 53: Asia Pacific Vascular Injury Treatment Market Attractiveness, by Injury, 2019–2027
Figure 54: Asia Pacific Vascular Injury Treatment Market Value Share Analysis, by Treatment, 2018 and 2027
Figure 55: Asia Pacific Vascular Injury Treatment Market Attractiveness Analysis, by Treatment, 2019–2027
Figure 56: Asia Pacific Vascular Injury Treatment Market Value Share (%), by End User, 2018 and 2027
Figure 57: Asia Pacific Vascular Injury Treatment Market Attractiveness, by End User, 2019–2027
Figure 58: Latin America Vascular Injury Treatment Market Value (US$ Mn), 2017–2027
Figure 59: Latin America Vascular Injury Treatment Market Value Share Analysis, by Country/Sub-region, 2018 and 2027
Figure 60: Latin America Vascular Injury Treatment Market Attractiveness Analysis, by Country/Sub-region, 2019–2027
Figure 61: Latin America Vascular Injury Treatment Market Value Share (%), by Injury, 2018 and 2027
Figure 62: Latin America Vascular Injury Treatment Market Attractiveness, by Injury, 2019–2027
Figure 63: Latin America Vascular Injury Treatment Market Value Share Analysis, by Treatment, 2018 and 2027
Figure 64: Latin America Vascular Injury Treatment Market Attractiveness Analysis, by Treatment, 2019–2027
Figure 65: Latin America Vascular Injury Treatment Market Value Share (%), by End User, 2018 and 2027
Figure 66: Latin America Vascular Injury Treatment Market Attractiveness, by End User, 2019–2027
Figure 67: Middle East & Africa Vascular Injury Treatment Market Value (US$ Mn), 2017–2027
Figure 68: Middle East & Africa Vascular Injury Treatment Market Value Share Analysis, by Country/Sub-region, 2018 and 2027
Figure 69: Middle East & Africa Vascular Injury Treatment Market Attractiveness Analysis, by Country/Sub-region, 2019–2027
Figure 70: Middle East & Africa Vascular Injury Treatment Market Value Share (%), by Injury, 2018 and 2027
Figure 71: Middle East & Africa Vascular Injury Treatment Market Attractiveness, by Injury, 2019–2027
Figure 72: Middle East & Africa Vascular Injury Treatment Market Value Share Analysis, by Treatment, 2018 and 2027
Figure 73: Middle East & Africa Vascular Injury Treatment Market Attractiveness Analysis, by Treatment, 2019–2027
Figure 74: Middle East & Africa Vascular Injury Treatment Market Value Share (%), by End User, 2018 and 2027
Figure 75: Middle East & Africa Vascular Injury Treatment Market Attractiveness, by End User, 2019–2027
Copyright © Transparency Market Research, Inc. All Rights reserved
Trust Online

Vascular Injury Treatment Market