
Reports
Reports
Degenerative retinal diseases are one of the major causes of irreversible vision loss across the world. Multiple studies pertaining to retinal disorders have revealed that diabetic retinopathy and age-related degeneration (AMD) accounts for over 80% of the reported cases of bilateral blindness worldwide. According to the National Eye Institute of the U.S., nearly 7.7 million individuals suffer from diabetic retinopathy across the U.S. and the number is estimated to reach around 11.3 million by 2030. On a global scale, nearly 36 million individuals suffer from complete vision loss and in most cases, the blindness stems from a range of retinal disorders.
The prevalence of retinal disorders is notably higher in low to medium income countries wherein access to efficient and effective healthcare is a major issue. While developed countries, such as the U.S., Canada, Germany, and the U.K., among others, have laid down the groundwork to address retinal disorders, developing countries continue to make gradual improvements in that regard. Within the retinal disorders treatment market, research and development activities have gained significant momentum, especially over the last decade. Due to the growing demand for cutting-edge retinal disorders treatment and noteworthy investments in research, the retinal disorder treatment market is expected to reach a value of ~US$ 17.6 Bn by the end of 2027.
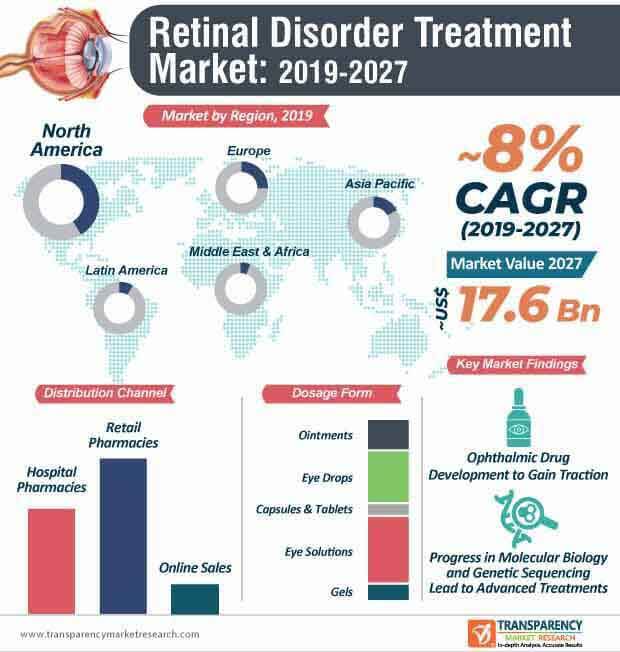
In recent times, the development and discovery of new ophthalmic drugs has gained significant momentum. Within the retinal disorders treatment market, drug manufacturers are shifting from traditional drug formulations toward the discovery of new and improved drugs to treat a range of retinal disorders. This factor, along with notable progress in genetic sequencing and molecular biology has paved the way for improved retinal disorders treatment.
Government, as well as several nonprofit organizations, are increasingly spending on the development of new retinal disorders treatment. Within the retinal disorders treatment market, collaborations between nonprofit organizations and the government are on the rise particularly in developed regions such as North America. For instance, The Foundation Fighting Blindness, a nonprofit organization, is aiding in research pertaining to ophthalmic drug development by funding over 90 researchers around the world. The research activities are largely focusing on the development of new drugs to treat retinal disorders, including inherited retinal degenerative diseases and age-related macular degeneration diseases. Moreover, swift and cost-efficient genetic testing is likely to offer lucrative opportunities for drug developers in the retinal disorder treatment market during the forecast period. Within the retinal disorders treatment market, macular degeneration and diabetic retinopathy disease indication segments are expected to collectively account for over 85% of the total market share, in terms of value– a major factor why researches and studies pertaining to retinal disorders are largely focusing on these disease indications. The macular degeneration disease indication segment is expected to reach a market value of ~US$ 5.3 Bn by 2020 from ~US$ 5.1 Bn in 2019.
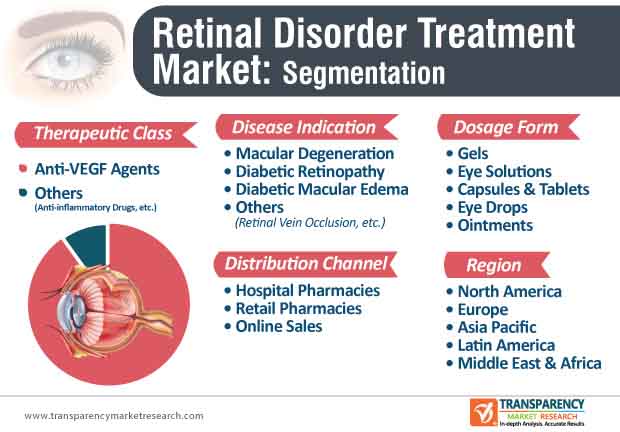
Age-related macular degeneration (AMD), diabetic retinopathy, inherited retinal dystrophies, and diabetic macular degeneration diseases are some of the major retinal disorders that require efficient, reliable, and cost-effective retinal disorder treatments. The advent of anti-vascular endothelial growth factor (VEGF) agents has redefined retinal disorder treatments, such as neovascular (wet) AMD and diabetic macular edema, among others. The adoption of anti-VEGF injections in the retinal disorder treatment market is expected to scale new heights, as these injections have, repeatedly, proved their efficacy in providing relief from a range of retinal disorders. Despite ongoing research pertaining to alternative drug delivery techniques and drugs, anti-VEGF agents therapeutic class segment is expected to account for a share of over 88% of the retinal disorder treatment market during the forecast period. Anti-VEGF agents segment is likely to reach a market value of ~9.4 Bn by 2020.
Analysts’ Viewpoint
The retinal disorder treatment market is expected to grow at an impressive CAGR of ~8% during the forecast period. Strides taken by genetic sequencing and molecular biology have paved the way for the development of a range of retinal disorders treatment in recent times. Moreover, research and development activities funded by governments as well as nonprofit organizations pertaining to the development of novel therapeutic strategies for retinal treatment will provide a significant impetus for growth of the retinal disorder treatment market during the forecast period. North America and Europe are expected to be at the helm, in terms of innovation, owing to robust healthcare systems and favorable government policies.
Retinal disorder treatment market is expected to reach a value of ~US$ 17.6 Bn by 2027
Retinal disorder treatment market is projected to expand at a CAGR of ~8% from 2019 to 2027
Retinal disorder treatment market is driven by rise in prevalence of retinal disorders due to increase in geriatric patient population
The retail pharmacies segment dominated the retinal disorder treatment market, and the trend is expected to continue during the forecast period
Key players in the retinal disorder treatment market include Santen Pharmaceutical Co., Ltd., Regeneron Pharmaceuticals, Inc., F. Hoffmann-La Roche Ltd., Pfizer, Inc., Allergan plc
1. Preface
1.1. Report Scope and Market Segmentation
1.2. Research Highlights
2. Assumptions and Research Methodology
2.1. Assumptions
2.2. Research Methodology
3. Executive Summary
3.1. Global Retinal Disorder Treatment Market Snapshot
4. Market Overview
4.1. Product Overview
4.2. Key Industry Events
4.3. Market Dynamics
4.3.1. Drivers and Restraints Snapshot Analysis
4.3.2. Drivers
4.3.3. Restraints
4.3.4. Opportunities
4.4. Global Retinal Disorder Treatment Market Revenue Projection
4.5. Global Retinal Disorder Treatment Market Outlook
5. Market Outlook
5.1. Clinical Trial Analysis
5.2. Regulatory Scenario
5.3. Pipeline Analysis
5.4. Key Mergers & Acquisitions
5.5. Reimbursement Scenario
6. Global Retinal Disorder Treatment Market Analysis, by Disease Indication
6.1. Introduction
6.2. Global Retinal Disorder Treatment Market Value Share and Attractiveness Analysis, by Disease Indication
6.3. Global Retinal Disorder Treatment Market Forecast, by Disease Indication
6.3.1. Macular Degeneration
6.3.1.1. Dry Macular Degeneration
6.3.1.2. Wet Macular Degeneration
6.3.2. Diabetic Retinopathy
6.3.3. Diabetic Macular Edema
6.3.4. Others (Retinal Vein Occlusion, etc.)
7. Global Retinal Disorder Treatment Market Analysis, by Therapeutic Class
7.1. Introduction
7.2. North America Retinal Disorder Treatment Market Value Share and Attractiveness Analysis, by Therapeutic Class
7.3. North America Retinal Disorder Treatment Market Forecast, by Therapeutic Class
7.3.1. Anti-VEGF Agents
7.3.2. Others (Anti-inflammatory Drugs, etc.)
8. Global Retinal Disorder Treatment Market Analysis, by Dosage Form
8.1. Introduction
8.2. Global Retinal Disorder Treatment Market Value Share and Attractiveness Analysis, by Dosage Form
8.3. Global Retinal Disorder Treatment Market Forecast, by Dosage Form
8.3.1. Gels
8.3.2. Eye Solutions
8.3.3. Capsules & Tablets
8.3.4. Eye Drops
8.3.5. Ointments
8.4. Global Retinal Disorder Treatment Market Analysis, by Dosage Form
9. Global Retinal Disorder Treatment Market Analysis, by Distribution Channel
9.1. Introduction
9.2. Global Retinal Disorder Treatment Market Value Share and Attractiveness Analysis, by Distribution Channel
9.3. Global Retinal Disorder Treatment Market Forecast, by Distribution Channel
9.3.1. Hospital Pharmacies
9.3.2. Retail Pharmacies
9.3.3. Online Sales
9.4. Global Retinal Disorder Treatment Market Analysis, by Distribution Channel
10. Global Retinal Disorder Treatment Market Analysis, by Region
10.1. Global Retinal Disorder Treatment Market Scenario, by Country
10.2. Global Retinal Disorder Treatment Market Value Share and Attractiveness Analysis, by Region
10.3. Global Retinal Disorder Treatment Market Forecast, by Region
10.3.1. North America
10.3.2. Europe
10.3.3. Asia Pacific
10.3.4. Latin America
10.3.5. Middle East & Africa
11. North America Retinal Disorder Treatment Market Analysis
11.1. Key Findings
11.2. North America Retinal Disorder Treatment Market Overview
11.3. North America Retinal Disorder Treatment Market Value Share and Attractiveness Analysis, by Country
11.4. North America Retinal Disorder Treatment Market Forecast, by Country
11.4.1. U.S.
11.4.2. Canada
11.5. North America Retinal Disorder Treatment Market Value Share and Attractiveness Analysis, by Disease Indication
11.6. North America Retinal Disorder Treatment Market Forecast, by Disease Indication
11.6.1. Macular Degeneration
11.6.1.1. Dry Macular Degeneration
11.6.1.2. Wet Macular Degeneration
11.6.2. Diabetic Retinopathy
11.6.3. Diabetic Macular Edema
11.6.4. Others (Retinal Vein Occlusion, etc.)
11.7. North America Retinal Disorder Treatment Market Value Share and Attractiveness Analysis, by Therapeutic Class
11.8. North America Retinal Disorder Treatment Market Forecast, by Therapeutic Class
11.8.1. Anti-VEGF Agents
11.8.2. Others (Anti-inflammatory Drugs, etc.)
11.9. North America Retinal Disorder Treatment Market Value Share and Attractiveness Analysis, by Dosage Form
11.10. North America Retinal Disorder Treatment Market Forecast, by Dosage Form
11.10.1. Gels
11.10.2. Eye Solutions
11.10.3. Capsules & Tablets
11.10.4. Eye Drops
11.10.5. Ointments
11.11. North America Retinal Disorder Treatment Market Value Share and Attractiveness Analysis, by Distribution Channel
11.12. North America Retinal Disorder Treatment Market Forecast, by Distribution Channel
11.12.1. Hospital Pharmacies
11.12.2. Retail Pharmacies
11.12.3. Online Sales
12. Europe Retinal Disorder Treatment Market Analysis
12.1. Key Findings
12.2. Europe Retinal Disorder Treatment Market Overview
12.3. Europe Retinal Disorder Treatment Market Value Share and Attractiveness Analysis, by Country/Sub-region
12.4. Europe Retinal Disorder Treatment Market Forecast, by Country/Sub-region
12.4.1. Germany
12.4.2. France
12.4.3. U.K.
12.4.4. Italy
12.4.5. Spain
12.4.6. Rest of Europe
12.5. Europe Retinal Disorder Treatment Market Value Share and Attractiveness Analysis, by Disease Indication
12.6. Europe Retinal Disorder Treatment Market Forecast, by Disease Indication
12.6.1. Macular Degeneration
12.6.1.1. Dry Macular Degeneration
12.6.1.2. Wet Macular Degeneration
12.6.2. Diabetic Retinopathy
12.6.3. Diabetic Macular Edema
12.6.4. Others (Retinal Vein Occlusion, etc.)
12.7. Europe Retinal Disorder Treatment Market Value Share and Attractiveness Analysis, by Therapeutic Class
12.8. Europe Retinal Disorder Treatment Market Forecast, by Therapeutic Class
12.8.1. Anti-VEGF Agents
12.8.2. Others (Anti-inflammatory Drugs, etc.)
12.9. Europe Retinal Disorder Treatment Market Value Share and Attractiveness Analysis, by Dosage Form
12.10. Europe Retinal Disorder Treatment Market Forecast, by Dosage Form
12.10.1. Gels
12.10.2. Eye Solutions
12.10.3. Capsules & Tablets
12.10.4. Eye Drops
12.10.5. Ointments
12.11. Europe Retinal Disorder Treatment Market Value Share and Attractiveness Analysis, by Distribution Channel
12.12. Europe Retinal Disorder Treatment Market Forecast, by Distribution Channel
12.12.1. Hospital Pharmacies
12.12.2. Retail Pharmacies
12.12.3. Online Sales
13. Asia Pacific Retinal Disorder Treatment Market Analysis
13.1. Key Findings
13.2. Asia Pacific Retinal Disorder Treatment Market Overview
13.3. Asia Pacific Retinal Disorder Treatment Market Value Share and Attractiveness Analysis, by Country/Sub-region
13.4. Asia Pacific Retinal Disorder Treatment Market Forecast, by Country/Sub-region
13.4.1. Japan
13.4.2. China
13.4.3. India
13.4.4. Australia & New Zealand
13.4.5. Rest of Asia Pacific
13.5. Asia Pacific Retinal Disorder Treatment Market Value Share and Attractiveness Analysis, by Disease Indication
13.6. Asia Pacific Retinal Disorder Treatment Market Forecast, by Disease Indication
13.6.1. Macular Degeneration
13.6.1.1. Dry Macular Degeneration
13.6.1.2. Wet Macular Degeneration
13.6.2. Diabetic Retinopathy
13.6.3. Diabetic Macular Edema
13.6.4. Others (Retinal Vein Occlusion, etc.)
13.7. Asia Pacific Retinal Disorder Treatment Market Value Share and Attractiveness Analysis, by Therapeutic Class
13.8. Asia Pacific Retinal Disorder Treatment Market Forecast, by Therapeutic Class
13.8.1. Anti-VEGF Agents
13.8.2. Others (Anti-inflammatory Drugs, etc.)
13.9. Asia Pacific Retinal Disorder Treatment Market Value Share and Attractiveness Analysis, by Dosage Form
13.10. Asia Pacific Retinal Disorder Treatment Market Forecast, by Dosage Form
13.10.1. Gels
13.10.2. Eye Solutions
13.10.3. Capsules & Tablets
13.10.4. Eye Drops
13.10.5. Ointments
13.11. Asia Pacific Retinal Disorder Treatment Market Value Share and Attractiveness Analysis, by Distribution Channel
13.12. Asia Pacific Retinal Disorder Treatment Market Forecast, by Distribution Channel
13.12.1. Hospital Pharmacies
13.12.2. Retail Pharmacies
13.12.3. Online Sales
14. Latin America Retinal Disorder Treatment Market Analysis
14.1. Key Findings
14.2. Latin America Retinal Disorder Treatment Market Overview
14.3. Latin America Retinal Disorder Treatment Market Value Share and Attractiveness Analysis, by Country/Sub-region
14.4. Latin America Retinal Disorder Treatment Market Forecast, by Country/Sub-region
14.4.1. Brazil
14.4.2. Mexico
14.4.3. Rest of Latin America
14.5. Latin America Retinal Disorder Treatment Market Value Share and Attractiveness Analysis, by Disease Indication
14.6. Latin America Retinal Disorder Treatment Market Forecast, by Disease Indication
14.6.1. Macular Degeneration
14.6.1.1. Dry Macular Degeneration
14.6.1.2. Wet Macular Degeneration
14.6.2. Diabetic Retinopathy
14.6.3. Diabetic Macular Edema
14.6.4. Others (Retinal Vein Occlusion, etc.)
14.7. Latin America Retinal Disorder Treatment Market Value Share and Attractiveness Analysis, by Therapeutic Class
14.8. Latin America Retinal Disorder Treatment Market Forecast, by Therapeutic Class
14.8.1. Anti-VEGF Agents
14.8.2. Others (Anti-inflammatory Drugs, etc.)
14.9. Latin America Retinal Disorder Treatment Market Value Share and Attractiveness Analysis, by Dosage Form
14.10. Latin America Retinal Disorder Treatment Market Forecast, by Dosage Form
14.10.1. Gels
14.10.2. Eye Solutions
14.10.3. Capsules & Tablets
14.10.4. Eye Drops
14.10.5. Ointments
14.11. Latin America Retinal Disorder Treatment Market Value Share and Attractiveness Analysis, by Distribution Channel
14.12. Latin America Retinal Disorder Treatment Market Forecast, by Distribution Channel
14.12.1. Hospital Pharmacies
14.12.2. Retail Pharmacies
14.12.3. Online Sales
15. Middle East & Africa Retinal Disorder Treatment Market Analysis
15.1. Key Findings
15.2. Middle East & Africa Retinal Disorder Treatment Market Overview
15.3. Middle East & Africa Retinal Disorder Treatment Market Value Share and Attractiveness Analysis, by Country/Sub-region
15.4. Middle East & Africa Retinal Disorder Treatment Market Forecast, by Country/Sub-region
15.4.1. GCC Countries
15.4.2. South Africa
15.4.3. Rest of Middle East & Africa
15.5. Middle East & Africa Retinal Disorder Treatment Market Value Share and Attractiveness Analysis, by Disease Indication
15.6. Middle East & Africa Retinal Disorder Treatment Market Forecast, by Disease Indication
15.6.1. Macular Degeneration
15.6.1.1. Dry Macular Degeneration
15.6.1.2. Wet Macular Degeneration
15.6.2. Diabetic Retinopathy
15.6.3. Diabetic Macular Edema
15.6.4. Others (Retinal Vein Occlusion, etc.)
15.7. Middle East & Africa Retinal Disorder Treatment Market Value Share and Attractiveness Analysis, by Therapeutic Class
15.8. Middle East & Africa Retinal Disorder Treatment Market Forecast, by Therapeutic Class
15.8.1. Anti-VEGF Agents
15.8.2. Others (Anti-inflammatory Drugs, etc.)
15.9. Middle East & Africa Retinal Disorder Treatment Market Value Share and Attractiveness Analysis, by Dosage Form
15.10. Middle East & Africa Retinal Disorder Treatment Market Forecast, by Dosage Form
15.10.1. Gels
15.10.2. Eye Solutions
15.10.3. Capsules & Tablets
15.10.4. Eye Drops
15.10.5. Ointments
15.11. Middle East & Africa Retinal Disorder Treatment Market Value Share and Attractiveness Analysis, by Distribution Channel
15.12. Middle East & Africa Retinal Disorder Treatment Market Forecast, by Distribution Channel
15.12.1. Hospital Pharmacies
15.12.2. Retail Pharmacies
15.12.3. Online Sales
16. Competition Analysis
16.1. Global Retinal Disorder Treatment Market Share Analysis, by Company
16.2. Competition Matrix
16.3. Company Profile
16.3.1. Santen Pharmaceutical Co., Ltd.
16.3.1.1. Company Overview (HQ, Business Segments, Employee Strength)
16.3.1.2. Financial Overview
16.3.1.3. Product Portfolio
16.3.1.4. SWOT Analysis
16.3.1.5. Strategic Overview
16.3.2. Regeneron Pharmaceuticals, Inc.
16.3.2.1. Company Overview (HQ, Business Segments, Employee Strength)
16.3.2.2. Financial Overview
16.3.2.3. Product Portfolio
16.3.2.4. SWOT Analysis
16.3.2.5. Strategic Overview
16.3.3. F. Hoffmann-La Roche Ltd.
16.3.3.1. Company Overview (HQ, Business Segments, Employee Strength)
16.3.3.2. Financial Overview
16.3.3.3. Product Portfolio
16.3.3.4. SWOT Analysis
16.3.3.5. Strategic Overview
16.3.4. Pfizer, Inc.
16.3.4.1. Company Overview (HQ, Business Segments, Employee Strength)
16.3.4.2. Financial Overview
16.3.4.3. Product Portfolio
16.3.4.4. SWOT Analysis
16.3.4.5. Strategic Overview
16.3.5. Allergan plc
16.3.5.1. Company Overview (HQ, Business Segments, Employee Strength)
16.3.5.2. Financial Overview
16.3.5.3. Product Portfolio
16.3.5.4. SWOT Analysis
16.3.5.5. Strategic Overview
16.3.6. Shire (Takeda Pharmaceutical Company Limited)
16.3.6.1. Company Overview (HQ, Business Segments, Employee Strength)
16.3.6.2. Financial Overview
16.3.6.3. Product Portfolio
16.3.6.4. SWOT Analysis
16.3.6.5. Strategic Overview
16.3.7. Bayer AG
16.3.7.1. Company Overview (HQ, Business Segments, Employee Strength)
16.3.7.2. Financial Overview
16.3.7.3. Product Portfolio
16.3.7.4. SWOT Analysis
16.3.7.5. Strategic Overview
16.3.8. Graybug Vision, Inc.
16.3.8.1. Company Overview (HQ, Business Segments, Employee Strength)
16.3.8.2. Financial Overview
16.3.8.3. Product Portfolio
16.3.8.4. SWOT Analysis
16.3.8.5. Strategic Overview
16.3.9. Novartis AG
16.3.9.1. Company Overview (HQ, Business Segments, Employee Strength)
16.3.9.2. Financial Overview
16.3.9.3. Product Portfolio
16.3.9.4. SWOT Analysis
16.3.9.5. Strategic Overview
16.3.10. Acucela Inc. (Kubota Pharmaceutical Holdings Co., Ltd.)
16.3.10.1. Company Overview (HQ, Business Segments, Employee Strength)
16.3.10.2. Financial Overview
16.3.10.3. Product Portfolio
16.3.10.4. SWOT Analysis
16.3.10.5. Strategic Overview
List of Tables
Table 01: Global Retinal Disorder Treatment Market Value (US$ Mn) Forecast, by Disease Indication, 2017–2027
Table 02: Global Retinal Disorder Treatment Market Value (US$ Mn) Forecast, by Macular Degeneration, 2017–2027
Table 03: North America Retinal Disorder Treatment Market Value (US$ Mn) Forecast, by Therapeutic Class, 2017–2027
Table 04: Global Retinal Disorder Treatment Market Value (US$ Mn) Forecast, by Distribution Channel, 2017–2027
Table 05: Global Retinal Disorder Treatment Market Value (US$ Mn) Forecast, by Region, 2017–2027
Table 06: North America Retinal Disorder Treatment Market Value (US$ Mn) Forecast, by Country, 2017–2027
Table 07: North America Retinal Disorder Treatment Market Value (US$ Mn) Forecast, by Disease Indication, 2017–2027
Table 08: North America Retinal Disorder Treatment Market Value (US$ Mn) Forecast, by Macular Degeneration, 2017–2027
Table 09: North America Retinal Disorder Treatment Market Value (US$ Mn) Forecast, by Therapeutic Class, 2017–2027
Table 10: North America Retinal Disorder Treatment Market Value (US$ Mn) Forecast, by Dosage Form, 2017–2027
Table 11: North America Retinal Disorder Treatment Market Value (US$ Mn) Forecast, by Distribution Channel, 2017–2027
Table 12: Europe Retinal Disorder Treatment Market Value (US$ Mn) Forecast, by Country/Sub-region, 2017–2027
Table 13: Europe Retinal Disorder Treatment Market Value (US$ Mn) Forecast, by Disease Indication, 2017–2027
Table 14: Europe Retinal Disorder Treatment Market Value (US$ Mn) Forecast, by Macular Degeneration, 2017–2027
Table 15: Europe Retinal Disorder Treatment Market Value (US$ Mn) Forecast, by Therapeutic Class, 2017–2027
Table 16: Europe Retinal Disorder Treatment Market Value (US$ Mn) Forecast, by Dosage Form, 2017–2027
Table 17: Europe Retinal Disorder Treatment Market Value (US$ Mn) Forecast, by Distribution Channel, 2017–2027
Table 18: Asia Pacific Retinal Disorder Treatment Market Value (US$ Mn) Forecast, by Country/Sub-region, 2017–2027
Table 19: Asia Pacific Retinal Disorder Treatment Market Value (US$ Mn) Forecast, by Disease Indication, 2017–2027
Table 20: Asia Pacific Retinal Disorder Treatment Market Value (US$ Mn) Forecast, by Macular Degeneration, 2017–2027
Table 21: Asia Pacific Retinal Disorder Treatment Market Value (US$ Mn) Forecast, by Therapeutic Class, 2017–2027
Table 22: Asia Pacific Retinal Disorder Treatment Market Value (US$ Mn) Forecast, by Dosage Form, 2017–2027
Table 23: Asia Pacific Retinal Disorder Treatment Market Value (US$ Mn) Forecast, by Distribution Channel, 2017–2027
Table 24: Latin America Retinal Disorder Treatment Market Value (US$ Mn) Forecast, by Country/Sub-region, 2017–2027
Table 25: Latin America Retinal Disorder Treatment Market Value (US$ Mn) Forecast, by Disease Indication, 2017–2027
Table 26: Latin America Retinal Disorder Treatment Market Value (US$ Mn) Forecast, by Macular Degeneration, 2017–2027
Table 27: Latin America Retinal Disorder Treatment Market Value (US$ Mn) Forecast, by Therapeutic Class, 2017–2027
Table 28: Latin America Retinal Disorder Treatment Market Value (US$ Mn) Forecast, by Dosage Form, 2017–2027
Table 29: Latin America Retinal Disorder Treatment Market Value (US$ Mn) Forecast, by Distribution Channel, 2017–2027
Table 30: Middle East & Africa Retinal Disorder Treatment Market Value (US$ Mn) Forecast, by Country/Sub-region, 2017–2027
Table 31: Middle East & Africa Retinal Disorder Treatment Market Value (US$ Mn) Forecast, by Disease Indication, 2017–2027
Table 32: Middle East & Africa Retinal Disorder Treatment Market Value (US$ Mn) Forecast, by Macular Degeneration, 2017–2027
Table 33: Middle East & Africa Retinal Disorder Treatment Market Value (US$ Mn) Forecast, by Therapeutic Class, 2017–2027
Table 34: Middle East & Africa Retinal Disorder Treatment Market Value (US$ Mn) Forecast, by Dosage Form, 2017–2027
Table 35: Middle East & Africa Retinal Disorder Treatment Market Value (US$ Mn) Forecast, by Distribution Channel, 2017–2027
List of Figures
Figure 01: Global retinal disorder treatment Market Value (US$ Mn) and Distribution (%), by Region, 2018 and 2027
Figure 02: Global Retinal Disorder Treatment Market Value (US$ Mn) and Forecast, 2019–2027
Figure 03: Global Retinal Disorder Treatment Market Value Share (%), by Disease Indication, 2018
Figure 04: Global Retinal Disorder Treatment Market Value Share (%), by Therapeutic Class, 2018
Figure 05: Global Retinal Disorder Treatment Market Value Share (%), by Dosage Form, 2018
Figure 06: Global Retinal Disorder Treatment Market Value Share (%), by Region, 2018
Figure 07: Global Retinal Disorder Treatment Market Value Share (%), by Distribution Channel, 2018
Figure 08: Clinical Trial Analysis by Phase
Figure 09: Clinical Trial Analysis by Status
Figure 10: Clinical Trial Analysis by Completion and Termination Rate
Figure 11: Clinical Trial Analysis by Region
Figure 12: Global Retinal Disorder Treatment Market Value Share Analysis, by Disease Indication, 2018 and 2027
Figure 13: Global Retinal Disorder Treatment Market Attractiveness, by Disease Indication, 2019–2027
Figure 14: Global Retinal Disorder Treatment Market Revenue (US$ Mn) and Y-o-Y Growth (%), by Macular Degeneration, 2017–2027
Figure 15: Global Retinal Disorder Treatment Market Revenue (US$ Mn) and Y-o-Y Growth (%), by Diabetes Retinopathy, 2017–2027
Figure 16: Global Retinal Disorder Treatment Market Revenue (US$ Mn) and Y-o-Y Growth (%), by Diabetic Macular Edema, 2017–2027
Figure 17: Global Retinal Disorder Treatment Market Revenue (US$ Mn) and Y-o-Y Growth (%), by Others (Retinal Vein Occlusion, etc.), 2017–2027
Figure 18: North America Retinal Disorder Treatment Market Value Share Analysis, by Therapeutic Class, 2018 and 2027
Figure 19: North America Retinal Disorder Treatment Market Attractiveness, by Therapeutic Class, 2019–2027
Figure 20: Global Retinal Disorder Treatment Market Revenue (US$ Mn) and Y-o-Y Growth (%), by Anti-VEGF Agents, 2017–2027
Figure 21: Global Retinal Disorder Treatment Market Revenue (US$ Mn) and Y-o-Y Growth (%), by Others (Anti-inflammatory Drugs, etc.), 2017–2027
Figure 22: Global Retinal Disorder Treatment Market Revenue (US$ Mn) and Y-o-Y Growth (%), by Gels, 2017–2027
Figure 23: Global Retinal Disorder Treatment Market Revenue (US$ Mn) and Y-o-Y Growth (%), by Eye Solutions, 2017–2027
Figure 24: Global Retinal Disorder Treatment Market Revenue (US$ Mn) and Y-o-Y Growth (%), by Capsules & Tablets, 2017–2027
Figure 25: Global Retinal Disorder Treatment Market Revenue (US$ Mn) and Y-o-Y Growth (%), by Eye Drops, 2017–2027
Figure 26: Global Retinal Disorder Treatment Market Revenue (US$ Mn) and Y-o-Y Growth (%), by Ointments, 2017–2027
Figure 27: Global Retinal Disorder Treatment Market Value Share, by Distribution Channel, 2018 and 2027
Figure 28: Global Retinal Disorder Treatment Market Attractiveness, by Distribution Channel, 2019–2027
Figure 29: Global Retinal Disorder Treatment Market Revenue (US$ Mn) and Y-o-Y Growth (%), by Hospital Pharmacies, 2017–2027
Figure 30: Global Retinal Disorder Treatment Market Revenue (US$ Mn) and Y-o-Y Growth (%), by Retail Pharmacies, 2017–2027
Figure 31: Global Retinal Disorder Treatment Market Revenue (US$ Mn) and Y-o-Y Growth (%), by Online Sales, 2017–2027
Figure 32: Global Retinal Disorder Treatment Market Value Share, by Region, 2018 and 2027
Figure 33: Global Retinal Disorder Treatment Market Attractiveness, by Region, 2019–2027
Figure 34: North America Retinal Disorder Treatment Market Value (US$ Mn) Forecast and Y-o-Y Growth (%) Projection, 2017–2027
Figure 35: North America Retinal Disorder Treatment Market Value Share Analysis, by Country, 2018 and 2027
Figure 36: North America Retinal Disorder Treatment Market Attractiveness, by Country, 2019–2027
Figure 37: North America Retinal Disorder Treatment Market Value Share Analysis, by Disease Indication, 2018 and 2027
Figure 38: North America Retinal Disorder Treatment Market Attractiveness, by Disease Indication, 2019–2027
Figure 39: North America Retinal Disorder Treatment Market Value Share Analysis, by Therapeutic Class, 2018 and 2027
Figure 40: North America Retinal Disorder Treatment Market Attractiveness, by Therapeutic Class, 2019–2027
Figure 41: North America Retinal Disorder Treatment Market Value Share, by Dosage Form, 2018 and 2027
Figure 42: North America Retinal Disorder Treatment Market Attractiveness, by Dosage Form, 2019–2027
Figure 43: North America Retinal Disorder Treatment Market Value Share, by Distribution Channel, 2018 and 2027
Figure 44: North America Retinal Disorder Treatment Market Attractiveness, by Distribution Channel, 2019–2027
Figure 45: Europe Retinal Disorder Treatment Market Value (US$ Mn) Forecast and Y-o-Y Growth (%) Projection, 2017–2027
Figure 46: Europe Retinal Disorder Treatment Market Value Share Analysis, by Country/Sub-region, 2018 and 2027
Figure 47: Europe Retinal Disorder Treatment Market Attractiveness, by Country/Sub-region, 2019–2027
Figure 48: Europe Retinal Disorder Treatment Market Value Share Analysis, by Disease Indication, 2018 and 2027
Figure 49: Europe Retinal Disorder Treatment Market Attractiveness, by Disease Indication, 2019–2027
Figure 50: Europe Retinal Disorder Treatment Market Value Share Analysis, by Therapeutic Class, 2018 and 2027
Figure 51: Europe Retinal Disorder Treatment Market Attractiveness, by Therapeutic Class, 2019–2027
Figure 52: Europe Retinal Disorder Treatment Market Value Share, by Dosage Form, 2018 and 2027
Figure 53: Europe Retinal Disorder Treatment Market Attractiveness, by Dosage Form, 2019–2027
Figure 54: Europe Retinal Disorder Treatment Market Value Share, by Distribution Channel, 2018 and 2027
Figure 55: Europe Retinal Disorder Treatment Market Attractiveness, by Distribution Channel, 2019–2027
Figure 56: Asia Pacific Retinal Disorder Treatment Market Value (US$ Mn) Forecast and Y-o-Y Growth (%) Projection, 2017–2027
Figure 57: Asia Pacific Retinal Disorder Treatment Market Value Share Analysis, by Country/Sub-region, 2018 and 2027
Figure 58: Asia Pacific Retinal Disorder Treatment Market Attractiveness, by Country/Sub-region, 2019–2027
Figure 59: Asia Pacific Retinal Disorder Treatment Market Value Share Analysis, by Disease Indication, 2018 and 2027
Figure 60: Asia Pacific Retinal Disorder Treatment Market Attractiveness, by Disease Indication, 2019–2027
Figure 61: Asia Pacific Retinal Disorder Treatment Market Value Share Analysis, by Therapeutic Class, 2018 and 2027
Figure 62: Asia Pacific Retinal Disorder Treatment Market Attractiveness, by Therapeutic Class, 2019–2027
Figure 63: Asia Pacific Retinal Disorder Treatment Market Value Share, by Dosage Form, 2018 and 2027
Figure 64: Asia Pacific Retinal Disorder Treatment Market Attractiveness, by Dosage Form, 2019–2027
Figure 65: Asia Pacific Retinal Disorder Treatment Market Value Share, by Distribution Channel, 2018 and 2027
Figure 66: Asia Pacific Retinal Disorder Treatment Market Attractiveness, by Distribution Channel, 2019–2027
Figure 67: Latin America Retinal Disorder Treatment Market Value (US$ Mn) Forecast and Y-o-Y Growth (%) Projection, 2017–2027
Figure 68: Latin America Retinal Disorder Treatment Market Value Share Analysis, by Country/Sub-region, 2018 and 2027
Figure 69: Latin America Retinal Disorder Treatment Market Attractiveness, by Country/Sub-region, 2019–2027
Figure 70: Latin America Retinal Disorder Treatment Market Value Share Analysis, by Disease Indication, 2018 and 2027
Figure 71: Latin America Retinal Disorder Treatment Market Attractiveness, by Disease Indication, 2019–2027
Figure 72: Latin America Retinal Disorder Treatment Market Value Share Analysis, by Therapeutic Class, 2018 and 2027
Figure 73: Latin America Retinal Disorder Treatment Market Attractiveness, by Therapeutic Class, 2019–2027
Figure 74: Latin America Retinal Disorder Treatment Market Value Share, by Dosage Form, 2018 and 2027
Figure 75: Latin America Retinal Disorder Treatment Market Attractiveness, by Dosage Form, 2019–2027
Figure 76: Latin America Retinal Disorder Treatment Market Value Share, by Distribution Channel, 2018 and 2027
Figure 77: Latin America Retinal Disorder Treatment Market Attractiveness, by Distribution Channel, 2019–2027
Figure 78: Middle East & Africa Retinal Disorder Treatment Market Value (US$ Mn) Forecast and Y-o-Y Growth (%) Projection, 2017–2027
Figure 79: Middle East & Africa Retinal Disorder Treatment Market Value Share Analysis, by Country/Sub-region, 2018 and 2027
Figure 80: Middle East & Africa Retinal Disorder Treatment Market Attractiveness, by Country/Sub-region, 2019–2027
Figure 81: Middle East & Africa Retinal Disorder Treatment Market Value Share Analysis, by Disease Indication, 2018 and 2027
Figure 82: Middle East & Africa Retinal Disorder Treatment Market Attractiveness, by Disease Indication, 2019–2027
Figure 83: Middle East & Africa Retinal Disorder Treatment Market Value Share Analysis, by Therapeutic Class, 2018 and 2027
Figure 84: Middle East & Africa Retinal Disorder Treatment Market Attractiveness, by Therapeutic Class, 2019–2027
Figure 85: Middle East & Africa Retinal Disorder Treatment Market Value Share, by Dosage Form, 2018 and 2027
Figure 86: Middle East & Africa Retinal Disorder Treatment Market Attractiveness, by Dosage Form, 2019–2027
Figure 87: Middle East & Africa Retinal Disorder Treatment Market Value Share, by Distribution Channel, 2018 and 2027
Figure 88: Middle East & Africa Retinal Disorder Treatment Market Attractiveness, by Distribution Channel, 2019–2027
Copyright © Transparency Market Research, Inc. All Rights reserved
Trust Online

Retinal Disorder Treatment Market