
Reports
Reports
Key players in the global myasthenia gravis market are engaged in regulatory approvals, technologically advanced products, launch of new products, and acquisition & collaborative agreements with other companies. These strategies are likely to fuel the growth of the global market. A few expansion strategies adopted by players operating in the global market are:
The report on the global myasthenia gravis market discussed individual strategies, followed by company profiles of manufacturers of myasthenia gravis. The competitive landscape section has been included in the report to provide readers with a dashboard view and a company market share analysis of key players operating in the global market.
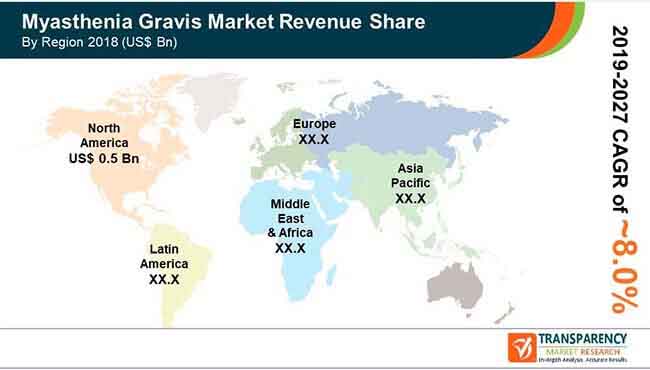
Myasthenia gravis market is expected to reach US$ 2.4 Bn By 2027
Myasthenia gravis market is anticipated to expand at a CAGR of 8.0% from 2019 to 2027
Myasthenia gravis market is driven by high prevalence of autoimmune diseases and strong focus on introducing new therapies
North America accounted for major share of the global myasthenia gravis market and the trend is anticipated to continue during the forecast period
Key players in the global myasthenia gravis market include Alexion Pharmaceutical Inc., Avadel Pharmaceuticals, PLC. (Flamel Technologies), CSL Behring, Grifols, S.A.
1. Preface
1.1. Market Definition and Scope
1.2. Market Segmentation
1.3. Key Research Objectives
1.4. Research Highlights
2. Assumptions and Research Methodology
3. Executive Summary : Global Myasthenia Gravis Market
4. Market Overview
4.1. Introduction
4.1.1. Treatment Type Definition
4.1.2. Industry Evolution / Developments
4.2. Overview
4.3. Market Dynamics
4.3.1. Drivers
4.3.2. Restraints
4.3.3. Opportunities
4.4. Global Myasthenia Gravis Market Analysis and Forecasts, 2017–2027
5. Key Insights
5.1. Pipeline Analysis
5.2. Key Industry Development (Acquisition, Collaboration, Merger, Approvals etc.)
5.3. Epidemiology of Myasthenia Gravis By Country/Sub-region
5.4. Regulatory Scenario
6. Global Myasthenia Gravis Market Analysis and Forecasts, by Treatment Type
6.1. Introduction & Definition
6.1.1. Key Findings / Developments
6.2. Global Myasthenia Gravis Market Value & Volume Forecast by Treatment Type, 2017–2027
6.2.1. Drug Treatment
6.2.1.1. Cholinesterase Inhibitors
6.2.1.2. Chronic Immunomodulators
6.2.1.3. Monoclonal Antibodies
6.2.2. Rapid Immunotherapies
6.2.2.1. Plasmapheresis
6.2.2.2. Intravenous Immunoglobulin (Ivlg)
6.2.3. Thymectomy
6.3. Global Myasthenia Gravis Market Attractiveness by Treatment Type
7. Global Myasthenia Gravis Market Analysis and Forecasts, by Region
7.1. Key Findings
7.2. Global Myasthenia Gravis Market Value & Volume Forecast by Region
7.2.1. North America
7.2.2. Europe
7.2.3. Asia Pacific
7.2.4. Latin America
7.2.5. Middle East & Africa
7.3. Global Myasthenia Gravis Market Attractiveness by Country/Region
8. North America Myasthenia Gravis Market Analysis and Forecast
8.1. Introduction
8.1.1. Key Findings
8.2. North America Myasthenia Gravis Market Value & Volume Forecast by Treatment Type, 2017–2027
8.2.1. Drug Treatment
8.2.1.1. Cholinesterase Inhibitors
8.2.1.2. Chronic Immunomodulators
8.2.1.3. Monoclonal Antibodies
8.2.2. Rapid Immunotherapies
8.2.2.1. Plasmapheresis
8.2.2.2. Intravenous Immunoglobulin (Ivlg)
8.2.3. Thymectomy
8.3. North America Myasthenia Gravis Market Value & Volume Forecast by Country, 2017–2027
8.3.1. U.S.
8.3.2. Canada
8.4. North America Myasthenia Gravis Market Attractiveness Analysis
8.4.1. By Treatment Type
8.4.2. By Country
9. Europe Myasthenia Gravis Market Analysis and Forecast
9.1. Introduction
9.1.1. Key Findings
9.2. Europe Myasthenia Gravis Market Value & Volume Forecast by Treatment Type, 2017–2027
9.2.1. Drug Treatment
9.2.1.1. Cholinesterase Inhibitors
9.2.1.2. Chronic Immunomodulators
9.2.1.3. Monoclonal Antibodies
9.2.2. Rapid Immunotherapies
9.2.2.1. Plasmapheresis
9.2.2.2. Intravenous Immunoglobulin (Ivlg)
9.2.3. Thymectomy
9.3. Europe Myasthenia Gravis Market Value & Volume Forecast by Country/Sub-region, 2017–2027
9.3.1. Germany
9.3.2. U.K.
9.3.3. France
9.3.4. Spain
9.3.5. Italy
9.3.6. Rest of Europe
9.4. Europe Myasthenia Gravis Market Attractiveness Analysis
9.4.1. By Treatment Type
9.4.2. By Country/Sub-region
10. Asia Pacific Myasthenia Gravis Market Analysis and Forecast
10.1. Introduction
10.1.1. Key Findings
10.2. Asia Pacific Myasthenia Gravis Market Value & Volume Forecast by Treatment Type, 2017–2027
10.2.1. Drug Treatment
10.2.1.1. Cholinesterase Inhibitors
10.2.1.2. Chronic Immunomodulators
10.2.1.3. Monoclonal Antibodies
10.2.2. Rapid Immunotherapies
10.2.2.1. Plasmapheresis
10.2.2.2. Intravenous Immunoglobulin (Ivlg)
10.2.3. Thymectomy
10.3. Asia Pacific Myasthenia Gravis Market Value & Volume Forecast by Country/Sub-region, 2017–2027
10.3.1. China
10.3.2. Japan
10.3.3. India
10.3.4. Australia & New Zealand
10.3.5. Rest of Asia Pacific
10.4. Asia Pacific Myasthenia Gravis Market Attractiveness Analysis
10.4.1. By Treatment Type
10.4.2. By Country/Sub-region
11. Latin America Myasthenia Gravis Market Analysis and Forecast
11.1. Introduction
11.1.1. Key Findings
11.2. Latin America Myasthenia Gravis Market Value & Volume Forecast by Treatment Type, 2017–2027
11.2.1. Drug Treatment
11.2.1.1. Cholinesterase Inhibitors
11.2.1.2. Chronic Immunomodulators
11.2.1.3. Monoclonal Antibodies
11.2.2. Rapid Immunotherapies
11.2.2.1. Plasmapheresis
11.2.2.2. Intravenous Immunoglobulin (Ivlg)
11.2.3. Thymectomy
11.3. Latin America Myasthenia Gravis Market Value & Volume Forecast by Country/Sub-region, 2017–2027
11.3.1. Brazil
11.3.2. Mexico
11.3.3. Rest of Latin America
11.4. Latin America Myasthenia Gravis Market Attractiveness Analysis
11.4.1. By Treatment Type
11.4.2. By Country/Sub-region
12. Middle East & Africa Myasthenia Gravis Market Analysis and Forecast
12.1. Introduction
12.1.1. Key Findings
12.2. Middle East & Africa Myasthenia Gravis Market Value & Volume Forecast by Treatment Type, 2017–2027
12.2.1. Drug Treatment
12.2.1.1. Cholinesterase Inhibitors
12.2.1.2. Chronic Immunomodulators
12.2.1.3. Monoclonal Antibodies
12.2.2. Rapid Immunotherapies
12.2.2.1. Plasmapheresis
12.2.2.2. Intravenous Immunoglobulin (Ivlg)
12.2.3. Thymectomy
12.3. Middle East & Africa Myasthenia Gravis Market Value & Volume Forecast by Country/Sub-region, 2017–2027
12.3.1. GCC Countries
12.3.2. South Africa
12.3.3. Rest of Middle East & Africa
12.4. Middle East & Africa Myasthenia Gravis Market Attractiveness Analysis
12.4.1. By Treatment Type
12.4.2. By Country/Sub-region
13. Competition Landscape
13.1. Market Player – Competition Matrix (By Tier and Size of companies)
13.2. Market Share Analysis/Ranking By Company (2018)
13.3. Company Profiles
13.3.1. Alexion Pharmaceutical Inc.
13.3.1.1. Company Overview (HQ, Business Segments, Employee Strength)
13.3.1.2. Growth Strategies
13.3.1.3. SWOT Analysis.
13.3.2. Avadel Pharmaceuticals, PLC. (Flamel Technologies)
13.3.2.1. Company Overview (HQ, Business Segments, Employee Strength)
13.3.2.2. Growth Strategies
13.3.2.3. SWOT Analysis.
13.3.3. CSL Behring
13.3.3.1. Company Overview (HQ, Business Segments, Employee Strength)
13.3.3.2. Growth Strategies
13.3.3.3. SWOT Analysis.
13.3.4. Grifols, S.A.
13.3.4.1. Company Overview (HQ, Business Segments, Employee Strength)
13.3.4.2. Growth Strategies
13.3.4.3. SWOT Analysis.
13.3.5. Baxter International, Inc.
13.3.5.1. Company Overview (HQ, Business Segments, Employee Strength)
13.3.5.2. Growth Strategies
13.3.5.3. SWOT Analysis.
13.3.6. Shire plc
13.3.6.1. Company Overview (HQ, Business Segments, Employee Strength)
13.3.6.2. Growth Strategies
13.3.6.3. SWOT Analysis.
13.3.7. Novartis AG
13.3.7.1. Company Overview (HQ, Business Segments, Employee Strength)
13.3.7.2. Growth Strategies
13.3.7.3. SWOT Analysis.
13.3.8. F. Hoffmann-La Roche AG
13.3.8.1. Company Overview (HQ, Business Segments, Employee Strength)
13.3.8.2. Growth Strategies
13.3.8.3. SWOT Analysis.
13.3.9. Takeda Pharmaceutical Company Limited
13.3.9.1. Company Overview (HQ, Business Segments, Employee Strength)
13.3.9.2. Growth Strategies
13.3.9.3. SWOT Analysis.
13.3.10. Valeant Pharmaceuticals International, Inc.
13.3.10.1. Company Overview (HQ, Business Segments, Employee Strength)
13.3.10.2. Growth Strategies
13.3.10.3. SWOT Analysis
List of Table
Table 01: Global Myasthenia Gravis Market Size (US$ Mn) Forecast, by Treatment, 2017–2027
Table 02: Global Myasthenia Gravis Market Size (US$ Mn) Forecast, by Treatment – Drug Treatment, 2017–2027
Table 03: Global Myasthenia Gravis Market Size (US$ Mn) Forecast, by Treatment – Rapid Immunotherapies, 2017–2027
Table 04: Global Myasthenia Gravis Market Size (US$ Mn) Forecast, by Region, 2017–2027
Table 05: North America Myasthenia Gravis Market Size (US$ Mn) and Forecast, by Country, 2017–2027
Table 06: North America Myasthenia Gravis Market Size (US$ Mn) Forecast, by Treatment, 2017–2027
Table 07: North America Myasthenia Gravis Market Size (US$ Mn) Forecast, by Drug Treatment, 2017–2027
Table 08: North America Myasthenia Gravis Market Size (US$ Mn) Forecast, by Rapid Immunotherapies, 2017–2027
Table 09: Europe Myasthenia Gravis Market Size (US$ Mn) Forecast, by Country, 2017–2027
Table 10: Europe Myasthenia Gravis Market Size (US$ Mn) Forecast, by Treatment, 2017–2027
Table 11: Europe Myasthenia Gravis Market Size (US$ Mn) Forecast, by Treatment – Drug Treatment, 2017–2027
Table 12: Europe Myasthenia Gravis Market Size (US$ Mn) Forecast, by Treatment – Rapid Immunotherapies, 2017–2027
Table 13: Asia Pacific Myasthenia Gravis Market Size (US$ Mn) and Forecast, by Country, 2017–2027
Table 14: Asia Pacific Myasthenia Gravis Market Size (US$ Mn) Forecast, by Treatment, 2017–2027
Table 15: Asia Pacific Myasthenia Gravis Market Size (US$ Mn) Forecast, by Drug Treatment, 2017–2027
Table 16: Asia Pacific Myasthenia Gravis Market Size (US$ Mn) Forecast, by Rapid Immunotherapies, 2017–2027
Table 17: Latin America Myasthenia Gravis Market Size (US$ Mn) and Forecast, by Country/Sub-region, 2017–2027
Table 18: Latin America Myasthenia Gravis Market Size (US$ Mn) Forecast, by Treatment, 2017–2027
Table 19: Latin America Myasthenia Gravis Market Size (US$ Mn) Forecast, by Drug Treatment, 2017–2027
Table 20: Latin America Myasthenia Gravis Market Size (US$ Mn) Forecast, by Rapid Immunotherapies, 2017–2027
Table 21: Middle East & Africa Myasthenia Gravis Market Size (US$ Mn) and Forecast, by Country, 2017–2027
Table 22: Middle East & Africa Myasthenia Gravis Market Size (US$ Mn) Forecast, by Treatment, 2017–2027
Table 23: Middle East & Africa Myasthenia Gravis Market Size (US$ Mn) Forecast, by Drug Treatment, 2017–2027
Table 24: Middle East & Africa Myasthenia Gravis Market Size (US$ Mn) Forecast, by Rapid Immunotherapies, 2017–2027
List of Figure
Figure 01: Global Myasthenia Gravis Market Size (US$ Mn) Forecast, 2017–2027
Figure 02: Market Value Share By Region
Figure 03: Market Value Share By Treatment
Figure 04: Market Value Share By Rapid Immunotherapies
Figure 05: Market Value Share By Drug Treatment
Figure 06: Global Myasthenia Gravis Market Value Share Analysis, Treatment, 2018 and 2027
Figure 07: Global Myasthenia Gravis Market Size (US$ Mn) and Y-o-Y Growth % Forecast, by Drug Treatment
Figure 08: Global Myasthenia Gravis Market Size (US$ Mn) and Y-o-Y Growth % Forecast, By Rapid Immunotherapies
Figure 09: Global Myasthenia Gravis Market Size (US$ Mn) and Y-o-Y Growth % Forecast, By Thymectomy
Figure 10: Global Myasthenia Gravis Market Size (US$ Mn) and Y-o-Y Growth % Forecast, By Cholinesterase Inhibitors
Figure 11: Global Myasthenia Gravis Market Size (US$ Mn) and Y-o-Y Growth % Forecast, By Chronic Immunomodulators
Figure 12: Global Myasthenia Gravis Market Size (US$ Mn) and Y-o-Y Growth % Forecast, By Monoclonal Antibodies
Figure 13: Global Myasthenia Gravis Market Size (US$ Mn) and Y-o-Y Growth % Forecast, By Plasmapheresis
Figure 14: Global Myasthenia Gravis Market Size (US$ Mn) and Y-o-Y Growth % Forecast, By Intravenous Immunoglobulin
Figure 15: Global Myasthenia Gravis Market Attractiveness Analysis, by treatment, 2019–2027
Figure 16: Global Myasthenia Gravis Market Value Share Analysis, by Region, 2018 and 2027
Figure 17: Myasthenia Gravis Market Attractiveness Analysis, by Region
Figure 18: North America Myasthenia Gravis Market Size (US$ Mn) Forecast, 2017–2027
Figure 19: North America Myasthenia Gravis Market Attractiveness Analysis, by Treatment, 2019–2027
Figure 20: North America Myasthenia Gravis Market Attractiveness Analysis, by Country
Figure 21: North America Myasthenia Gravis Market Value Share Analysis, by Country, 2018 and 2027
Figure 22: North America Myasthenia Gravis Market Value Share Analysis, by Treatment, 2018 and 2027
Figure 23: Europe Myasthenia Gravis Market Size (US$ Mn) Forecast, 2017–2027
Figure 24: Europe Myasthenia Gravis Market Attractiveness Analysis, by Treatment, 2019–2027
Figure 25: Europe Myasthenia Gravis Market Attractiveness Analysis, by Country, 2019–2027
Figure 26: Europe Myasthenia Gravis Market Value Share Analysis, by Country, 2018 and 2027
Figure 27: Europe Myasthenia Gravis Market Value Share Analysis, by Treatment, 2018 and 2027
Figure 28: Asia Pacific Myasthenia Gravis Market Size (US$ Mn) Forecast, 2017–2027
Figure 29: Asia Pacific Myasthenia Gravis Market Attractiveness Analysis, by Treatment, 2019–2027
Figure 30: Asia Pacific Myasthenia Gravis Market Attractiveness Analysis, by Country
Figure 31: Asia Pacific Myasthenia Gravis Market Value Share Analysis, by Country, 2018 and 2027
Figure 32: Asia Pacific Myasthenia Gravis Market Value Share Analysis, by Treatment, 2018 and 2027
Figure 33: Latin America Myasthenia Gravis Market Size (US$ Mn) Forecast, 2017–2027
Figure 34: Latin America Myasthenia Gravis Market Attractiveness Analysis, by Treatment, 2019–2027
Figure 35: Latin America Myasthenia Gravis Market Attractiveness Analysis, by Country/Sub-region
Figure 36: Latin America Myasthenia Gravis Market Value Share Analysis, by Country/Sub-region, 2018 and 2027
Figure 37: Latin America Myasthenia Gravis Market Value Share Analysis, by Treatment, 2018 and 2027
Figure 38: Middle East & Africa Myasthenia Gravis Market Size (US$ Mn) Forecast, 2017–2027
Figure 39: Middle East & Africa Myasthenia Gravis Market Attractiveness Analysis, by Treatment, 2019–2027
Figure 40: Middle East & Africa Myasthenia Gravis Market Attractiveness Analysis, by Country
Figure 41: Middle East & Africa Myasthenia Gravis Market Value Share Analysis, by Country, 2018 and 2027
Figure 42: Middle East & Africa Myasthenia Gravis Market Value Share Analysis, by Treatment, 2018 and 2027
Figure 43: Alexion Pharmaceutical Inc. Revenue (US$ Mn) & Y-o-Y Growth (%)
Figure 44: Alexion Pharmaceutical Inc. Research & Development Expenses
Figure 45: Alexion Pharmaceutical Inc. Breakdown of Net Sales, by Product
Figure 46: Alexion Pharmaceutical Inc. Breakdown of Net Sales, by Region
Figure 47: AVADEL PHARMACEUTICALS, PLC. Revenue (US$ Mn) & Y-o-Y Growth (%)
Figure 48: AVADEL PHARMACEUTICALS, PLC. Long-lived Assets (US$ Mn), by Geographic Region
Figure 49: AVADEL PHARMACEUTICALS, PLC. Breakdown of Net Sales, by Product
Figure 50: AVADEL PHARMACEUTICALS, PLC. Net Sales, by Region
Figure 51: CSL Behring Revenue (US$ Mn) & Y-o-Y Growth (%)
Figure 52: CSL Behring Research & Development Expenses
Figure 53: CSL Behring Breakdown of Net Sales, by Product
Figure 54: CSL Behring Breakdown of Net Sales, by Region
Figure 55: Grifols, S.A. Revenue (US$ Mn) & Y-o-Y Growth (%)
Figure 56: Grifols, S.A. Research & Development Expenses
Figure 57: Grifols, S.A. Breakdown of Net Sales, by Business Segment
Figure 58: Grifols, S.A. Breakdown of Net Sales, by Region
Figure 59: Baxter International, Inc. Revenue (US$ Mn) & Y-o-Y Growth (%)
Figure 60: Baxter International, Inc. Marketing and R&D Expenses
Figure 61: Baxter International, Inc. Breakdown of Net Sales, by Product
Figure 62: Baxter International, Inc. Breakdown of Net Sales, by Region
Figure 63: Shire plc Revenue (US$ Mn) and Y-o-Y Growth (%)
Figure 64: Shire plc R&D and Marketing Expenses
Figure 65: Shire plc Breakdown of Net Sales, by Product
Figure 66: Shire plc Breakdown of Net Sales, by Region
Figure 67: Novartis AG Revenue (US$ Mn) and Y-o-Y Growth (%)
Figure 68: Novartis AG Marketing & Sales, and R&D Expenses
Figure 69: Novartis AG Breakdown of Net Sales, by Business Segment
Figure 70: Novartis AG Breakdown of Net Sales, by Region
Figure 71: F. Hoffmann-La Roche AG Revenue (US$ Bn) and Y-o-Y Growth (%)
Figure 72: F. Hoffmann-La Roche AG Marketing and R&D Expenses
Figure 73: F. Hoffmann-La Roche AG Breakdown of Net Sales, by Business Division
Figure 74: F. Hoffmann-La Roche AG Breakdown of Net Sales, by Region
Figure 75: Takeda Pharmaceutical Company Limited Revenue (US$ Bn) and Y-o-Y Growth (%)
Figure 76: Takeda Pharmaceutical Company Limited Research And Development Expenses
Figure 77: Takeda Pharmaceutical Company Limited Breakdown of Net Sales, by Business Segment
Figure 78: Takeda Pharmaceutical Company Limited Breakdown of Net Sales, by Region
Figure 79: Valeant Pharmaceuticals International, Inc Revenue (US$ Bn) and Y-o-Y Growth (%)
Figure 80: Valeant Pharmaceuticals International, Inc Marketing and R&D Expenses
Figure 81: Valeant Pharmaceuticals International, Inc Breakdown of Net Sales, by Region
Figure 82: Valeant Pharmaceuticals International, Inc Breakdown of Net Sales, by Business Segment
Copyright © Transparency Market Research, Inc. All Rights reserved
Trust Online

Myasthenia Gravis Market