
Reports
Reports
Global Monoclonal Antibody Therapeutics Market: Snapshot
The biological therapy used for treating various kinds of severe and chronic conditions are known as monoclonal antibodies. These are applied in the treatment of serious conditions such as cancer, rheumatoid arthritis, Crohn’s diseases, psoriasis, osteoporosis, systemic lupus erythematous and others. These are target only the affected areas to destroy the diseased cells, thus restoring the immune system. The research report by Transparency Market Research states that the global monoclonal antibody therapeutics market was worth US$86.7 bn in 2015 and is expected to reach US$245.8 bn by 2024. Between the forecast years of 2016 and 2024, the overall market is expected to rise at a CAGR of 12.6%.
The rising incidence of cancer across the globe is expected to drive the global market in the coming years. According to the World Health Organization, the world is expected to witness a rise of 70% in the number of cancer cases over the next few years. The statistics indicate that of these, 60% will be from Asia, Africa, and Latin America. The market is also likely to be favored by the growing approvals to research and develop new antibodies, especially across Europe and the U.S. Additionally, commercialization of these drugs will also contribute to the growing revenue of the global market.
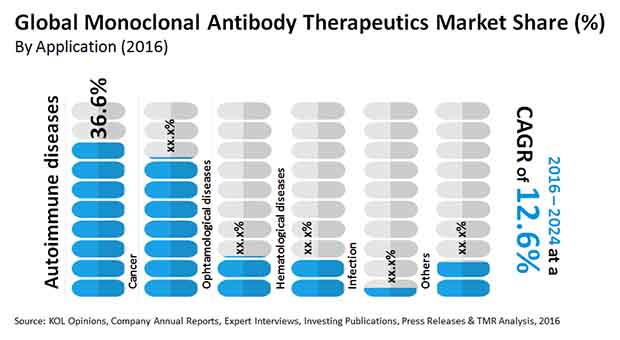
Autoimmune Diseases Showcase Steady Demand for Monoclonal Antibody Therapeutics
On the basis of application, the global monoclonal antibody therapeutics market is segmented into cancer, ophthalmological diseases, infection, autoimmune diseases, and hematological diseases among others. Of these, demand for treating autoimmune diseases with monoclonal antibody therapeutics is expected to remain at an all-time high in the coming years. The growing awareness about diseases, improving accessibility to healthcare, widening range of monoclonal antibody therapeutics, and huge investments in research and development of these therapeutics are expected to propel the segment in the coming years. Cancer is the second largest segment in the global market due to the high prevalence of the disease and an urgent need to treat the same.
North America to Remain Leading Segment due to Affordable Healthcare
In terms of geography, the global market is divided into North America, Europe, Asia Pacific, Latin America, and the Middle East and Africa. Analysts predict that the North America monoclonal antibody therapeutics market is likely to lead due to several reasons. Europe is expected to follow suit. As of 2015, the collective share of these two regions stood at 62.7% in the global market. The vast pool of geriatrics, well-established reimbursement policies, affordable healthcare, and growing awareness of diseases is expected to drive the market in North America in the coming few years. On the other hand, Europe monoclonal antibody therapeutics market is expected to thrive due to the increasing research and development in developing novel products.
Asia Pacific is also expected to show promise of a steady growth as the region has a huge population base with vast scope of unmet medical needs. The growing focus of governments in developing countries to improve the healthcare facilities is also expected to boost the demand for monoclonal antibody therapeutics in the coming years.
The key players operating in the global monoclonal antibody therapeutics market are GlaxoSmithKline Plc., Bayer AG, Pfizer Inc., F. Hoffmann-La Roche Ltd., Sanofi, Merck & Co., Inc., AbbVie Inc., Novartis AG, Amgen Inc., Bristol – Myers Squibb Company, Johnson & Johnson, and Biogen Inc. among others. The players are expected to focus on strategic mergers and acquisitions in the coming years to improve their foothold in the global market.
Monoclonal Antibody (mAb) Therapeutics Market Witnesses Massive Growth Potential in Demand for Drugs for Human Diseases
The pipeline of drugs in therapeutic antibodies has continuously grown in revenue potential. Over the past 25 years, therapeutic antibody drugs have opened new vistas in humanization of monoclonal antibodies (mAb), notably in the treatment of numerous cancer types, autoimmune disorders, and infectious diseases. A number of approvals of mAb by the U.S. FDA over the past three decades is a key trend from which has stemmed massive swatches of research investments by pharmaceutical companies in the monoclonal antibody (mAb) therapeutics market. Strides in the therapeutic antibody drugs pivot on advancements in purification technologies. A number of them are being investigated in clinical trials around the world, which is a key trend propelling the valuation growth in the monoclonal antibody (mAb) therapeutics market. One such technique is complementary-determining region (CDR) grafting, highly production in the development of humanized antibodies. Growing demand for biologics for autoimmune diseases and conditions that need prolonged treatment has been expanding the canvas for approval of therapeutic mAbs. The growing approval of human antibody drugs in recent years underscores the significant growth potential of the monoclonal antibody (mAb) therapeutics market.
Medical researchers are relentlessly pursuing the objectives of increasing the safety and efficacy of the existing therapeutic antibodies. Thus, pharmaceutical companies developing antibody-based drugs have made therapeutic breakthroughs. Continuing efforts complemented by technological advancements will likely pave way to improved classes of drugs in several diseases. These include asthma, Crohn’s disease, arthritis, transplant rejection, and migraine headaches. In particular, new platforms for developing bispecific antibodies are likely to bring new avenues in infectious diseases. In the current scenario of severe acute respiratory syndrome coronavirus 2, named as COVID-19, there is a pressing need for emergency authorization of monoclonal antibody (mAb) therapeutics. These hold promise in lowering the viral load and the severity of hospitalization. A large part of public resources are aimed at boosting the necessary medical infrastructure, and mAb, shows new paths of reducing the disease severity.
Monoclonal antibody therapeutics market is expected to reach US$245.8 bn by 2024
Monoclonal antibody therapeutics market is expected to rise at a CAGR of 12.6% from 2016 to 2024
Monoclonal antibody therapeutics market is driven by rising incidence of cancer across the globe
North America’s monoclonal antibody therapeutics market is projected to hold a dominating share during the forecast period of 2016-2024
The key players operating in the monoclonal antibody therapeutics market are Bayer AG, GlaxoSmithKline Plc., Sanofi, Novartis AG, Hoffmann-La Roche Ltd., AbbVie Inc., and Pfizer Inc.
1. Preface
1.1. Market Definition and Scope
1.2. Market Segmentation
1.3. Key Research Objectives
1.4. Research Highlights
2. Assumptions and Research Methodology
3. Executive Summary : Global Monoclonal Antibody Therapeutics Market
4. Market Overview
4.1. Introduction
4.1.1. Application Definition
4.1.2. Industry Evolution / Developments
4.2. Overview
4.3. Key Market Indicators
4.3.1. Region/Country Specific
4.3.2. Product/Application/End Users Specific
4.3.3. Target Market Specific – Global Scenario
4.4. Market Dynamics
4.4.1. Drivers
4.4.2. Restraints
4.4.3. Opportunity
4.5. Global Monoclonal Antibody Therapeutics Market Analysis and Forecasts, 2014–2024
4.5.1. Market Revenue Projections (US$ Mn)
4.6. Monoclonal Antibody Therapeutics Market - Global Supply Demand Scenario
4.7. Porter’s Five Force Analysis
4.8. Value Chain Analysis
4.9. Market Outlook
5. Global Monoclonal Antibody Therapeutics Market Analysis and Forecasts, By Application
5.1. Introduction & Definition
5.2. Key Findings / Developments
5.3. Key Trends
5.4. Market Value Forecast By Application , 2014–2024
5.4.1. Cancer
5.4.2. Autoimmune diseases
5.4.3. Infection
5.4.4. Hematological diseases
5.4.5. Ophthalmological diseases
5.4.6. Others
5.5. Market Attractiveness By Application
6. Global Monoclonal Antibody Therapeutics Market Analysis and Forecasts, By Source
6.1. Introduction & Definition
6.2. Key Findings / Developments
6.3. Key Trends
6.4. Market Value Forecast By Source , 2014–2024
6.4.1. Human
6.4.2. Humanized
6.4.3. Chimeric
6.4.4. Others
6.5. Market Attractiveness By Source
7. Global Monoclonal Antibody Therapeutics Market Analysis and Forecasts, By End Users
7.1. Introduction & Definition
7.2. Key Findings / Developments
7.3. Key Trends
7.4. Market Value Forecast By End Users , 2014–2024
7.4.1. Hospital
7.4.2. Private Clinic
7.4.3. Research Institutes
7.5. Market Attractiveness By End Users
8. Global Monoclonal Antibody Therapeutics Market Analysis and Forecasts, By Region
8.1. Key Findings
8.2. Policies and Regulations
8.3. Market Value Forecast By Region
8.3.1. North America
8.3.2. Europe
8.3.3. Asia Pacific
8.3.4. Latin America
8.3.5. Middle East & Africa
8.4. Market Attractiveness By Country/Region
9. North America Monoclonal Antibody Therapeutics Market Analysis and Forecast
9.1. Introduction
9.1.1. Key Findings
9.1.2. Key Trends
9.2. Market Value Forecast By Application , 2014–2024
9.2.1. Cancer
9.2.2. Autoimmune diseases
9.2.3. Infection
9.2.4. Hematological diseases
9.2.5. Ophthalmological diseases
9.2.6. Others
9.3. Market Value Forecast By Source , 2014–2024
9.3.1. Human
9.3.2. Humanized
9.3.3. Chimeric
9.3.4. Others
9.4. Market Value Forecast By End Users , 2014–2024
9.4.1. Hospital
9.4.2. Private Clinic
9.4.3. Research Institutes
9.5. Market Value Forecast By Country , 2014–2024
9.5.1. U.S.
9.5.2. Canada
9.6. Market Attractiveness Analysis
9.6.1. By Application
9.6.2. By Source
9.6.3. By End Users
9.6.4. By Country
10. Europe Monoclonal Antibody Therapeutics Market Analysis and Forecast
10.1.Introduction
10.1.1. Key Findings
10.1.4. Key Trends
10.2.Market Value Forecast By Application , 2014–2024
10.2.1. Cancer
10.2.2. Autoimmune diseases
10.2.3. Infection
10.2.4. Hematological diseases
10.2.5. Ophthalmological diseases
10.2.6. Others
10.3.Market Value Forecast By Source , 2014–2024
10.3.1. Human
10.3.2. Humanized
10.3.3. Chimeric
10.3.4. Others
10.4.Market Value Forecast By End Users , 2014–2024
10.4.1. Hospital
10.4.2. Private Clinic
10.4.3. Research Institutes
10.5.Market Value Forecast By Country , 2014–2024
10.5.1. Germany
10.5.2. U.K.
10.5.3. France
10.5.4. Spain
10.5.5. Italy
10.5.6. Rest of Europe
10.6.Market Attractiveness Analysis
10.6.1. By Application
10.6.2. By Source
10.6.3. By End Users
10.6.4. By Country
11. Asia Pacific Monoclonal Antibody Therapeutics Market Analysis and Forecast
11.1.Introduction
11.1.1. Key Findings
11.1.4. Key Trends
11.2.Market Value Forecast By Application , 2014–2024
11.2.1. Cancer
11.2.2. Autoimmune diseases
11.2.3. Infection
11.2.4. Hematological diseases
11.2.5. Ophthalmological diseases
11.2.6. Others
11.3.Market Value Forecast By Source , 2014–2024
11.3.1. Human
11.3.2. Humanized
11.3.3. Chimeric
11.3.4. Others
11.4.Market Value Forecast By End Users , 2014–2024
11.4.1. Hospital
11.4.2. Private Clinic
11.4.3. Research Institutes
11.5.Market Value Forecast By Country , 2014–2024
11.5.1. Japan
11.5.2. China
11.5.3. Australia
11.5.4. New Zealand
11.5.5. India
11.5.6. Rest of Asia Pacific
11.6.Market Attractiveness Analysis
11.6.1. By Application
11.6.2. By Source
11.6.3. By End Users
11.6.4. By Country
12. Latin America Monoclonal Antibody Therapeutics Market Analysis and Forecast
12.1.Introduction
12.1.1. Key Findings
12.1.4. Key Trends
12.2.Market Value Forecast By Application , 2014–2024
12.2.1. Cancer
12.2.2. Autoimmune diseases
12.2.3. Infection
12.2.4. Hematological diseases
12.2.5. Ophthalmological diseases
12.2.6. Others
12.3.Market Value Forecast By Source , 2014–2024
12.3.1. Human
12.3.2. Humanized
12.3.3. Chimeric
12.3.4. Others
12.4.Market Value Forecast By End Users , 2014–2024
12.4.1. Hospital
12.4.2. Private Clinic
12.4.3. Research Institutes
12.5.Market Value Forecast By Country , 2014–2024
12.5.1. Brazil
12.5.2. Mexico
12.5.3. Rest of Latin America
12.6.Market Attractiveness Analysis
12.6.1. By Application
12.6.2. By Source
12.6.3. By End Users
12.6.4. By Country
13. Middle East & Africa Monoclonal Antibody Therapeutics Market Analysis and Forecast
13.1.Introduction
13.1.1. Key Findings
13.1.4. Key Trends
13.2.Market Value Forecast By Application , 2014–2024
13.2.1. Cancer
13.2.2. Autoimmune diseases
13.2.3. Infection
13.2.4. Hematological diseases
13.2.5. Ophthalmological diseases
13.2.6. Others
13.3.Market Value Forecast By Source , 2014–2024
13.3.1. Human
13.3.2. Humanized
13.3.3. Chimeric
13.3.4. Others
13.4.Market Value Forecast By End Users , 2014–2024
13.4.1. Hospital
13.4.2. Private Clinic
13.4.3. Research Institutes
13.5.Market Value Forecast By Country , 2014–2024
13.5.1. South Africa
13.5.2. UAE
13.5.3. Saudi Arabia
13.5.4. Rest of Middle East and Africa
13.6.Market Attractiveness Analysis
13.6.1. By Application
13.6.2. By Source
13.6.3. By End Users
13.6.4. By Country
14. Competition Landscape
14.1.Market Player – Competition Matrix (By Tier and Size of companies)
14.2.Market Share Analysis By Company (2015)
14.3.Company Profiles (Details – Overview, Financials, Recent Developments, Strategy)
14.3.1. Bayer AG
14.3.1.1. Company Overview (HQ, Business Segments, Employee Strength)
14.3.1.2. Financial Overview
14.3.1.3. Product Portfolio
14.3.1.4. SWOT Analysis
14.3.1.5. Strategic Overview
14.3.2. F. Hoffmann-La Roche Ltd.
14.3.2.1. Company Overview (HQ, Business Segments, Employee Strength)
14.3.2.2. Financial Overview
14.3.2.3. Product Portfolio
14.3.2.4. SWOT Analysis
14.3.2.5. Strategic Overview
14.3.3. Pfizer, Inc.
14.3.3.1. Company Overview (HQ, Business Segments, Employee Strength)
14.3.3.2. Financial Overview
14.3.3.3. Product Portfolio
14.3.3.4. SWOT Analysis
14.3.3.5. Strategic Overview
14.3.4. Sanofi
14.3.4.1. Company Overview (HQ, Business Segments, Employee Strength)
14.3.4.2. Financial Overview
14.3.4.3. Product Portfolio
14.3.4.4. SWOT Analysis
14.3.4.5. Strategic Overview
14.3.5. GlaxoSmithKline plc.
14.3.5.1. Company Overview (HQ, Business Segments, Employee Strength)
14.3.5.2. Financial Overview
14.3.5.3. Product Portfolio
14.3.5.4. SWOT Analysis
14.3.5.5. Strategic Overview
14.3.6. Merck & Co., Inc.
14.3.6.1. Company Overview (HQ, Business Segments, Employee Strength)
14.3.6.2. Financial Overview
14.3.6.3. Product Portfolio
14.3.6.4. SWOT Analysis
14.3.6.5. Strategic Overview
14.3.7. Novartis AG
14.3.7.1. Company Overview (HQ, Business Segments, Employee Strength)
14.3.7.2. Financial Overview
14.3.7.3. Product Portfolio
14.3.7.4. SWOT Analysis
14.3.7.5. Strategic Overview
14.3.8. AbbVie Inc.
14.3.8.1. Company Overview (HQ, Business Segments, Employee Strength)
14.3.8.2. Financial Overview
14.3.8.3. Product Portfolio
14.3.8.4. SWOT Analysis
14.3.8.5. Strategic Overview
14.3.9. Amgen Inc.
14.3.9.1. Company Overview (HQ, Business Segments, Employee Strength)
14.3.9.2. Financial Overview
14.3.9.3. Product Portfolio
14.3.9.4. SWOT Analysis
14.3.9.5. Strategic Overview
14.3.10. Johnson & Johnson
14.3.10.1. Company Overview (HQ, Business Segments, Employee Strength)
14.3.10.2. Financial Overview
14.3.10.3. Product Portfolio
14.3.10.4. SWOT Analysis
14.3.10.5. Strategic Overview
14.3.11. Bristol-Myers Squibb Company
14.3.11.1. Company Overview (HQ, Business Segments, Employee Strength)
14.3.11.2. Financial Overview
14.3.11.3. Product Portfolio
14.3.11.4. SWOT Analysis
14.3.11.5. Strategic Overview
14.3.12. Biogen Inc.
14.3.12.1. Company Overview (HQ, Business Segments, Employee Strength)
14.3.12.2. Financial Overview
14.3.12.3. Product Portfolio
14.3.12.4. SWOT Analysis
14.3.12.5. Strategic Overview
List of Tables
Table 01: Global Monoclonal Antibody Therapeutics Market Size (US$ Mn) Forecast, by Application, 2014–2024
Table 02: Global Market Size (US$ Mn) Forecast, by Source, 2014–2024
Table 03: Global Market Size (US$ Mn) Forecast, by End Users, 2014–2024
Table 04: Global Market Size (US$ Mn) Forecast, by Region, 2014–2024
Table 05: North America Monoclonal Antibody Therapeutics Market Size (US$ Mn) Forecast, by Application, 2014–2024
Table 06: North America Market Size (US$ Mn) Forecast, by Source, 2014–2024
Table 07: North America Market Forecast, by End Users, 2014–2024
Table 08: North America Monoclonal Antibody Therapeutics Market Size (US$ Mn) Forecast, by Country, 2014–2024
Table 09: Europe Monoclonal Antibody Therapeutics Market Size (US$ Mn) Forecast, by Application, 2014–2024
Table 10: Europe Market Size (US$ Mn) Forecast, by Source, 2014–2024
Table 11: Europe Monoclonal Antibody Therapeutics Market Forecast, by End Users, 2014–2024
Table 12: Europe Market Size (US$ Mn) Forecast, by Country, 2014–2024
Table 13: Asia Pacific Monoclonal Antibody Therapeutics Market Size (US$ Mn) Forecast, by Application, 2014–2024
Table 14: Asia Pacific Market Size (US$ Mn) Forecast, by Source, 2014–2024
Table 15: Asia Pacific Monoclonal Antibody Therapeutics Market Forecast, by End Users, 2014–2024
Table 16: Asia Pacific Market Size (US$ Mn) Forecast, by Country, 2014–2024
Table 17: Latin America Monoclonal Antibody Therapeutics Market Size (US$ Mn) Forecast, by Application, 2014–2024
Table 18: Latin America Market Size (US$ Mn) Forecast, by Source, 2014–2024
Table 19: Latin America Market Forecast, by End Users, 2014–2024
Table 20: Latin America Market Size (US$ Mn) Forecast, by Country, 2014–2024
Table 21: MEA Monoclonal Antibody Therapeutics Market Size (US$ Mn) Forecast, by Application, 2014–2024
Table 22: MEA Market Size (US$ Mn) Forecast, by Source, 2014–2024
Table 23: MEA Market Forecast, by End Users, 2014–2024
Table 24: MEA Monoclonal Antibody Therapeutics Market Size (US$ Mn) Forecast, by Country, 2014–2024
List of Figures
Figure 1: Market Value Share By Application (2016) Revenue (US$ Mn)
Figure 2: Market Value Share By Source(2016) Revenue (US$ Mn)
Figure 3: Market Value Share By Application & Source (2016) Revenue (US$ Mn)
Figure 3: Market Value Share By End Users (2016) Revenue (US$ Mn)
Figure 4: Market Value Share By Region (2016) Revenue (US$ Mn)
Figure 3: Market Value Share By End Users & Region (2016) Revenue (US$ Mn)
Figure 5: Global Monoclonal Antibody Therapeutics Market Value Share Analysis, by Application, 2015 and 2024
Figure 6: Global Cancer Market Revenue (US$ Mn), 2014–2024
Figure 7: Global Autoimmune diseases Market Revenue (US$ Mn), 2014–2024
Figure 8: Global Infection Market Revenue (US$ Mn), 2014–2024
Figure 9: Global Hematological diseases Market Revenue (US$ Mn), 2014–2024
Figure 10: Global Ophthalmic diseases Market Revenue (US$ Mn), 2014–2024
Figure 11: Global Others Market Revenue (US$ Mn), 2014–2024
Figure 12: Global Monoclonal Antibody Therapeutics Market Attractiveness Analysis By Application, 2015
Figure 13: Global Monoclonal Antibody Therapeutics Market Value Share Analysis, by Source, 2015 and 2024
Figure 14: Global Human Market Revenue (US$ Mn), 2014–2024
Figure 15: Global Humanized Market Revenue (US$ Mn), 2014–2024
Figure 16: Global Chimeric Market Revenue (US$ Mn), 2014–2024
Figure 17: Global Others Market Revenue (US$ Mn), 2014–2024
Figure 18: Global Monoclonal Antibody Therapeutics Market Attractiveness Analysis By Source, 2015
Figure 19: Global Monoclonal Antibody Therapeutics Market Value Share Analysis, by End Users, 2015 and 2024
Figure 20: Global Hospital Market Revenue (US$ Mn), 2014–2024
Figure 21: Global Private Clinics Market Revenue (US$ Mn), 2014–2024
Figure 22: Global Research Institutes Market Revenue (US$ Mn), 2014–2024
Figure 23: Global Monoclonal Antibody Therapeutics Market Attractiveness Analysis By End Users, 2015
Figure 24: Global Monoclonal Antibody Therapeutics Market Value Share Analysis, by Region, 2015 and 2024
Figure 25: Global Monoclonal Antibody Therapeutics Market Attractiveness Analysis By Region, 2015
Figure 26: North America Monoclonal Antibody Therapeutics Market Size (US$ Mn) Forecast, 2015–2024
Figure 27: North America Monoclonal Antibody Y-o-Y Growth Projections, 2015–2024
Figure 28: North America Monoclonal Antibody Therapeutics Market Attractiveness By Country, 2014–2024
Figure 29: North America Market Value Share Analysis, by Application, 2015 and 2024
Figure 30: North America Market Value Share Analysis, by Source, 2015 and 2024
Figure 31: North America Market Value Share Analysis, by End Users, 2015 and 2024
Figure 32: North America Market by Country, 2015 and 2024
Figure 33: North America Monoclonal Antibody Therapeutics Market Attractiveness Analysis, by Application, 2015
Figure 34: North America Market Attractiveness Analysis, by Source, 2015
Figure 35: North America Market Attractiveness Analysis, By End users, 2015
Figure 36 : Europe Monoclonal Antibody Therapeutics Market Size (US$ Mn) Forecast, 2015–2024
Figure 37: Europe Monoclonal Antibody Y-o-Y Growth Projections, 2015–2024
Figure 38: Europe Market Attractiveness By Country, 2014–2024
Figure 39: Europe Market Value Share Analysis, by Application, 2015 and 2024
Figure 40 : Europe Monoclonal Antibody Therapeutics Market Value Share Analysis, by Source, 2015 and 2024
Figure 41: Europe Market Value Share Analysis, by End Users, 2015 and 2024
Figure 42: Europe Monoclonal Antibody Therapeutics Market by Country, 2015 and 2024
Figure 43: Europe Market Attractiveness Analysis, by Application, 2015
Figure 44: Europe Market Attractiveness Analysis, by Source, 2015
Figure 45: Europe Market Attractiveness Analysis, by End Users, 2015
Figure 46: Asia Pacific Monoclonal Antibody Therapeutics Market Size (US$ Mn) Forecast, 2015–2024
Figure 47: Asia Pacific Monoclonal Antibody Y-o-Y Growth Projections, 2015–2024
Figure 48: Asia Pacific Market Attractiveness By Country, 2014–2024
Figure 49: Asia Pacific Monoclonal Antibody Therapeutics Market Value Share Analysis, by Application, 2015 and 2024
Figure 50: Asia Pacific Market Value Share Analysis, by Source, 2015 and 2024
Figure 51: Asia Pacific Monoclonal Antibody Therapeutics Market Value Share Analysis, by End Users, 2015 and 2024
Figure 52: Asia Pacific Market by Country, 2015 and 2024
Figure 53: Asia Pacific Monoclonal Antibody Therapeutics Market Attractiveness Analysis, by Application, 2015
Figure 54: Asia Pacific Market Attractiveness Analysis, by Source, 2015
Figure 55: Asia Pacific Monoclonal Antibody Therapeutics Market Attractiveness Analysis, by End Users, 2015
Figure 56: Latin America Monoclonal Antibody Therapeutics Market Size (US$ Mn) Forecast, 2015–2024
Figure 57: Latin America Monoclonal Antibody Y-o-Y Growth Projections, 2015–2024
Figure 58: Latin America Monoclonal Antibody Therapeutics Market Attractiveness By Country, 2014–2024
Figure 59: Latin America Market Value Share Analysis, by Application, 2015 and 2024
Figure 60: Latin America Monoclonal Antibody Therapeutics Market Value Share Analysis, by Source, 2015 and 2024
Figure 61: Latin America Market Value Share Analysis, by End Users, 2015 and 2024
Figure 62: Latin America Monoclonal Antibody Therapeutics Market by Country, 2015 and 2024
Figure 63: Latin America Market Attractiveness Analysis, by Application, 2015
Figure 64: Latin America Monoclonal Antibody Therapeutics Market Attractiveness Analysis, by Source, 2015
Figure 65: Latin America Market Attractiveness Analysis, by End Users, 2015
Figure 66: MEA Monoclonal Antibody Therapeutics Market Size (US$ Mn) Forecast, 2015–2024
Figure 67: MEA Monoclonal Antibody Y-o-Y Growth Projections, 2015–2024
Figure 68: MEA Monoclonal Antibody Therapeutics Market Attractiveness By Country, 2014–2024
Figure 69: MEA Market Value Share Analysis, by Application, 2015 and 2024
Figure 70: MEA Monoclonal Antibody Therapeutics Market Value Share Analysis, by Source, 2015 and 2024
Figure 71: MEA Market Value Share Analysis, by End Users, 2015 and 2024
Figure 72: MEA Monoclonal Antibody Therapeutics Market by Country, 2015 and 2024
Figure 73: MEA Monoclonal Antibody Therapeutics Market Attractiveness Analysis, by Application, 2015
Figure 74: MEA Monoclonal Antibody Therapeutics Market Attractiveness Analysis, by Source, 2015
Figure 75: MEA Monoclonal Antibody Therapeutics Market Attractiveness Analysis, by End Users, 2015
Figure 76: Global Monoclonal Antibody Therapeutics Market Share Analysis, by Company (2015)
Copyright © Transparency Market Research, Inc. All Rights reserved
Trust Online

Monoclonal Antibody Therapeutics Market Trends, 2016-2024