

Reports
Reports
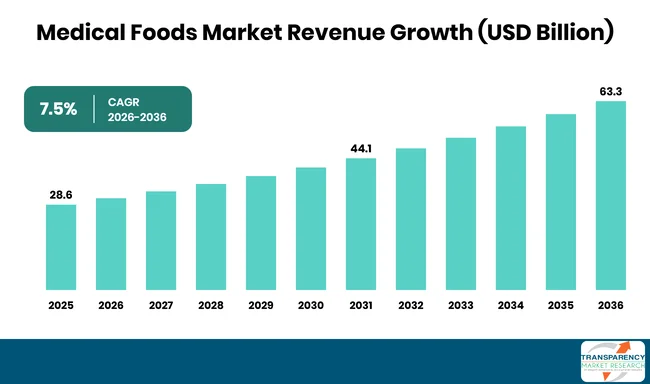
Demand for medical foods was estimated at USD 28.6 billion in 2025. Sales are expected to reach USD 63.3 billion by 2036, growing at a CAGR of 7.5% from 2026 to 2036.
Sales of medical foods are growing on the back clinical lines of large nutrition groups, as mainstream infant and adult products slow down. Nestlé said medical nutrition was the standout performer in the Americas in the third quarter of 2026, with organic growth accelerating for the sixth consecutive quarter.[1] Danone's Specialized Nutrition sales in the Americas reached EUR 315 million in the same quarter, up 12.4% like-for-like and led by Aptamil, Neocate and Kate Farms.[2]
Ownership of medical food businesses is changing as well. Abbott announced on 21 October 2026 that it intends to separate its global nutrition business, which has about USD 8.5 billion in annual sales, into an independent listed company by the end of 2027.[3] TMR expects a standalone nutrition company to put more capital into clinically positioned products, since investors will judge it on nutrition growth alone.
Demand for medical foods recorded a valuation of USD 28.6 billion in 2025 and is expected to reach USD 63.3 billion by 2036. As per TMR's estimation, sales will record a CAGR of 7.5% from 2026 to 2036. North America is projected to hold the largest share through 2036, and Asia Pacific is expected to be the fastest-growing region as more special-purpose formulas pass national registration. By product type, powder will account for the largest share, and by disease type, orphan diseases will lead. Based on route of administration, oral products will remain the main format, and pharmacies and drug stores will stay the largest distribution channel.
Key companies operating in the medical foods market include Nutricia (Danone), Nestlé S.A., Abbott Laboratories, Mead Johnson Nutrition, Fresenius Kabi, Friso, Morinaga Milk Industry, Primus Pharmaceuticals, Inc., Targeted Medical Pharma, Inc. and Medtrition, Inc.
Demand for medical foods will reward clinical credibility over shelf price, as per TMR analysts. Reckitt's Mead Johnson Nutrition shows the cost of relying on infant formula volumes. The unit’s like-for-like revenue fell 2.7% in the first quarter of 2026, as volume dropped 6.8% and price and mix rose 4.1%, and Reckitt said in June 2026 that it was still looking at all strategic options for the unit.[4] Based on TMR's analysis, any buyer of such an asset will pay for physician-recommended lines and not for formula volume.
Adoption of drug therapy is the second pressure point, and the effect is easy to misjudge. PTC Therapeutics booked USD 181.9 million from Sephience in the third quarter of 2026, up 20% on the previous quarter, with over 2,000 active patients worldwide at the end of September.[5] TMR analysts expect sepiapterin to change the mix of products inside the phenylketonuria segment rather than remove it, because patients on the therapy are still managed by physicians who set dietary limits. Formula makers that offer lower-phenylalanine foods and dietitian support alongside drug treatment should hold their accounts.
Medical foods are foods formulated to be consumed or administered enterally, under the supervision of a physician, for the specific dietary management of a disease or condition whose distinctive nutritional needs are established by medical evaluation. In the United States the FDA treats them as foods and not drugs, and it does not keep a complete list of products on the market. The patient must be unable to meet those needs by changing the normal diet alone, which is what separates a medical food from a general health product.
The market covers pills, powders, liquids and other formats, and the formulas serve a wide range of conditions. These include orphan diseases such as Duchenne muscular dystrophy, sickle cell anemia and hemophilia, as well as cancer, neurological and psychological disorders, metabolic disorders, pain, gastrointestinal disorders, eye disease, diabetes, phenylketonuria and epilepsy. Phenylketonuria shows how the category works in practice, as treatment starts soon after birth with a special infant formula, and older children and adults move to a different daily formula, and experts now recommend that the diet continues for life.[6] Products reach patients by mouth or through enteral tubes, and are sold through pharmacies, online channels, supermarkets and hospital supply routes.
Purchases of medical foods are made mainly by hospitals, metabolic clinics, long-term care homes and families acting on a physician's recommendation. Selection of a product is based on clinical evidence for the condition, nutritional completeness, taste and tolerance, whether insurance or a public programme pays, and how reliably the product is supplied. Taste matters more than it appears, since a patient who stops using an unpalatable formula loses the dietary control that the product was prescribed to give.
Demand for metabolic formulas follows diagnosis. All 50 US states and territories require newborn screening, and phenylketonuria is found from a few drops of blood taken from the heel.[6] HRSA announced a modernized framework for national newborn screening topics on 12 August 2026, which covers how conditions are evaluated for the Recommended Uniform Screening Panel, and said it will fund the Association of Public Health Laboratories to set up a workgroup on emerging screening issues.[7] Based on TMR's analysis, every condition added to the panel creates a defined group of patients who need a dietary product from the day of diagnosis.
Coverage of specialized formulas is the harder part. Senator Roger Wicker and colleagues introduced the Medical Foods and Formulas Access Act in December 2025, which would require Medicare, Medicaid, CHIP and the Federal Employees Health Benefits Program to cover specialized formulas, vitamins and amino acids prescribed for gastrointestinal and inherited metabolic disorders. The sponsors note that about 2,000 infants are diagnosed with an inherited metabolic disorder through newborn screening each year, and that nearly 40 states require coverage, with rules that vary widely.[8] As per TMR's analysis, federal coverage would turn out-of-pocket purchases into reimbursed demand, but TMR expects passage to be slow, so state mandates and private plans will remain the main payers in the near term.
Use of enteral nutrition in hospitals and homes is the steadiest source of volume for enteral product makers. Fresenius Kabi's Nutrition business reported revenue of EUR 613 million in the second quarter of 2026, against EUR 581 million a year earlier, an increase of 6% as reported and 5% organically, with the company citing strong underlying growth across almost all regions. First-half revenue was EUR 1,223 million, up 4% organically.[9] The company also said that the effect of the Ketosteril VBP tender would continue to phase through until full annualization from the third quarter of 2026.[9]
Sales of enteral products through hospital tenders and home care behave differently, and manufacturers will need to plan for both. Based on TMR's analysis, hospital contracts reward scale and price, and a patient discharged on tube feeding becomes a repeat buyer whose supplier is decided by the pharmacy, the home-care provider and the family. TMR expects makers with a hospital contract and a home delivery service to keep patients longer than makers that supply the ward alone.
Adoption of plant-based and real-food enteral formulas gives manufacturers a way into patients who reject conventional products. Danone completed the acquisition of a majority stake in Kate Farms in July 2025, describing it as the number one doctor-recommended plant-based brand in the United States, and placed it in one North American business with Nutricia, Real Food Blends and Functional Formularies. The combined unit is meant to serve hospitals, homes, online buyers and retail shelves.[10]
Registration of special medical purpose formulas in China offers a second opening, as approvals there are weighted toward general nutrition formulas. Of the 20 formulas for special medical purposes approved in the first quarter of 2026, 13 were complete nutrition formula foods and 6 were total nutrition formulas, and only 1 was a formula for amino acid metabolism disorders. The cumulative number of approvals reached 310 by 31 March 2026.[11] As per TMR's estimation, makers of inborn-error formulas that can complete the registration process will meet little local competition.
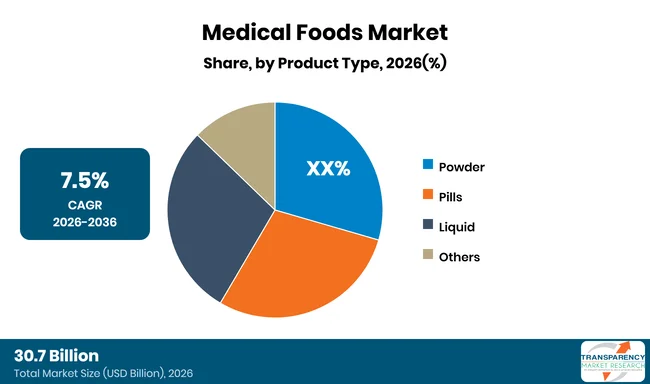
Based on product type, powder formulas are expected to hold the largest share in 2026 and remain the leading format through 2036, since formulas for infants and for inherited metabolic conditions are mostly sold as powders that are mixed at home. Liquids will grow faster from a smaller base, as ready-to-feed products suit hospitals and tube feeding, and pills will serve vitamins and amino acid products for pain, eye and neurological conditions. Abbott's worldwide pediatric nutrition sales rose 8.8% to USD 1,063 million in the third quarter of 2026, well ahead of adult nutrition at USD 1,199 million, which rose 2.0%.[12] As per TMR's analysis, the gap shows that formula-based products for children are expanding faster than adult drinks.
By disease type, orphan diseases are expected to account for the largest share in 2026, and the group includes Duchenne muscular dystrophy, sickle cell anemia and hemophilia. Therapy for the first of these is covered in TMR's Duchenne Muscular Dystrophy Market report.[R1] Phenylketonuria is a smaller but steady segment, with the condition occurring in 1 in 25,000 newborns in the United States.[13] Compared with other conditions, it has the clearest screening route and the longest period of dietary use. Eye disease is a developing segment, and TMR's Ophthalmology Devices Market report covers the diagnostic and surgical side of the same patient base.[R2]
| Attribute | Detail |
|---|---|
| Leading Region |
|
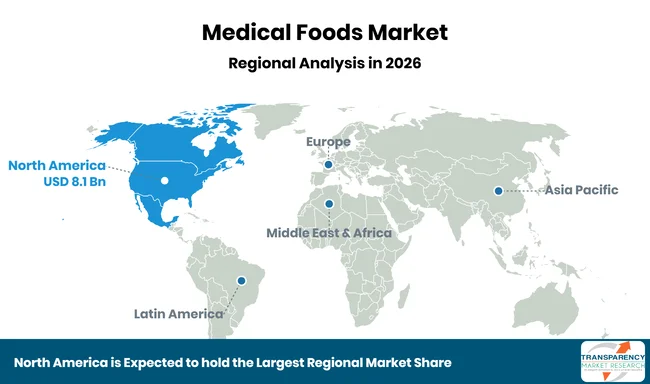
North America is expected to hold the largest share of the global medical foods market in 2026 and remain the leading region through 2036. Newborn screening in every state, physician-led prescribing and coverage mandates in nearly 40 states keep patients in treatment for long periods.[8] Abbott's nutrition sales in the United States show how uneven the year has been, as they rose 7.9% to USD 958 million in the third quarter of 2026 but were down 4.5% to USD 2,673 million for the first nine months.[12] As per TMR's analysis, the nine-month decline sits in the first half, and the third-quarter rebound points to timing in the sales base and not to weaker clinical demand.
Demand for medical foods in Europe is growing slowest among the major regions. Danone's Specialized Nutrition sales in EMEA were EUR 1,043 million in the third quarter of 2026, down 0.3% like-for-like, with infant formula recovering gradually in Europe and the Middle East returning to normal.[2] As per TMR's analysis, medical foods in Europe will grow more slowly than the global average, as national health systems in the region negotiate prices through tenders and limit what they reimburse.
Sales of medical foods in Asia Pacific are projected to grow fastest among all regions. Danone's Specialized Nutrition sales in the region were EUR 1,096 million in the third quarter of 2026, up 7.9% like-for-like on infant formula and medical nutrition, with Indonesia and India named as strong markets.[2] Based on TMR's analysis, growth in the region will depend on how quickly local registration systems, such as China's, approve more specialized formulas, and international suppliers that obtain approvals first will gain the most.
Key players in the medical foods market, mainly large nutrition groups, are reshaping portfolios around clinical products by buying, selling and splitting businesses. Danone, which owns Nutricia, added Kate Farms in 2025 to widen its reach in North American hospitals and homes.[10] Nestlé agreed on 1 September 2026 to sell its mainstream vitamins, minerals and supplements business, which had sales of USD 1.2 billion in 2025, to Yellow Wood Partners for USD 1.0 billion, with closing expected in the first half of 2027.[1] Abbott is taking the separate route of listing its nutrition business independently, and Mead Johnson Nutrition sits in the middle of a review at Reckitt. Fresenius Kabi competes through hospital enteral and parenteral nutrition and tender contracts, and Friso and Morinaga Milk Industry rely on infant and clinical formulas in Asian markets.
Targeted Medical Pharma and Primus Pharmaceuticals build products around specific conditions that physicians dispense, and Medtrition supplies nutrition products to care settings. As per TMR's analysis, the large groups will keep winning hospital contracts and national tenders on scale and clinical data, while specialists will keep their place through narrow indications and direct physician relationships. Each company profile covers the company overview, product portfolio, sales channel, strategy, financial summary and recent developments.
| Date | Company | Development | Ref. |
|---|---|---|---|
| October 2026 | PTC Therapeutics, Inc. | PTC reported Sephience net product revenue of USD 181.9 million for the third quarter of 2026, up 20% on the second quarter, with over 2,000 active patients worldwide. | [5] |
| October 2026 | Danone (Nutricia) | Danone reported third-quarter 2026 Specialized Nutrition sales of EUR 2,454 million, up 4.7% like-for-like, with the Americas up 12.4% and Asia Pacific up 7.9%. | [2] |
| October 2026 | Nestlé S.A. | Nestlé reported organic growth of 0.3% in Nutrition for the third quarter of 2026 and said medical nutrition was the standout performer in the Americas for a sixth consecutive quarter of accelerating growth. | [1] |
| October 2026 | Abbott Laboratories | Abbott announced its intention to separate its global Nutrition business, with about USD 8.5 billion in annual sales and 14 manufacturing sites, into an independent listed company by the end of 2027. | [3] |
| August 2026 | Health Resources and Services Administration (HRSA) | HRSA announced a modernized framework for national newborn screening topics and supplemental funding for a new workgroup on emerging screening issues. | [7] |
| August 2026 | Fresenius Kabi | Fresenius Kabi reported second-quarter 2026 Nutrition revenue of EUR 613 million, up 5% organically. | [9] |
| June 2026 | Reckitt (Mead Johnson Nutrition) | Reckitt reported a 2.7% decline in first-quarter 2026 like-for-like revenue at Mead Johnson Nutrition and said it was reviewing all strategic options for the unit. | [4] |
| December 2025 | US Senate (Sen. Roger Wicker and colleagues) | Senators and House members introduced the Medical Foods and Formulas Access Act to require federal health programmes to cover medically necessary specialized foods. | [8] |
| July 2025 | Danone (Kate Farms) | Danone completed the acquisition of a majority stake in Kate Farms, the number one doctor-recommended plant-based brand in the United States. | [10] |
| Attribute | Detail |
|---|---|
| Market Size Value in 2025 | USD 28.6 Billion |
| Market Forecast Value in 2036 | USD 63.3 Billion |
| Growth Rate (CAGR) | 7.5% |
| Forecast Period | 2026-2036 |
| Historical Data Available for | 2021-2025 |
| Quantitative Units | USD Billion for Value and Million Units for Volume |
| Market Analysis | Global qualitative analysis covers drivers, restraints, opportunities, main trends, Porter's Five Forces analysis, value chain analysis and recent developments. At the regional level, qualitative analysis covers drivers, restraints, opportunities and main trends. |
| Competition Analysis | Market share analysis by company (2025). Company profiles cover overview, product portfolio, sales channel, strategy, financial summary and recent developments. |
| Format | Electronic (PDF) + Excel |
| Segmentation | Product Type: Pills, Powder, Liquid, Others; Disease Type: Orphan Disease (Duchenne Muscular Dystrophy (DMD), Sickle Cell Anemia, Hemophilia), Cancer, Neurological & Psychological Disorders, Metabolic Disorders, Pain Management, Gastrointestinal Disorders, Ophthalmology, Diabetes, Phenylketonuria (PKU), Epilepsy; Route of Administration: Oral, Enteral; Distribution Channel: Pharmacies & Drug Stores, Online Channels, Supermarkets & Hypermarkets, Others |
| Regions Covered | North America, Europe, Asia Pacific, Middle East & Africa, Latin America |
| Countries Covered | U.S., Canada, Germany, U.K., France, Italy, Spain, China, India, Japan, Australia & New Zealand, Brazil, Mexico, GCC Countries, South Africa |
| Companies Profiled | Nutricia (Danone), Nestlé S.A., Abbott Laboratories, Mead Johnson Nutrition, Fresenius Kabi, Friso, Morinaga Milk Industry, Primus Pharmaceuticals, Inc., Targeted Medical Pharma, Inc., Medtrition, Inc., Other Companies |
| Customization Scope | Available upon request |
| Pricing | Available upon request |
The global medical foods market was valued at USD 28.6 billion in 2025.
The medical foods industry is projected to reach USD 63.3 billion by the end of 2036.
Expanding newborn screening and insurance coverage for specialized formulas, and growing use of enteral nutrition in hospitals and home care are the main drivers.
The market is expected to grow at a CAGR of 7.5% from 2026 to 2036.
North America accounted for the largest share of the global medical foods market in 2025.
Nutricia (Danone), Nestlé S.A., Abbott Laboratories, Mead Johnson Nutrition, Fresenius Kabi, Friso, Morinaga Milk Industry, Primus Pharmaceuticals, Inc., Targeted Medical Pharma, Inc. and Medtrition, Inc. are prominent players.
Table 01: Global Medical Foods Market Value (USD Billion) Forecast, by Product Type, 2021 to 2036
Table 02: Global Medical Foods Market Value (USD Billion) Forecast, by Disease Type, 2021 to 2036
Table 03: Global Medical Foods Market Value (USD Billion) Forecast, by Route of Administration, 2021 to 2036
Table 04: Global Medical Foods Market Value (USD Billion) Forecast, by Distribution Channel, 2021 to 2036
Table 05: Global Medical Foods Market Value (USD Billion) Forecast, by Country/Sub-region, 2021 to 2036
Table 06: North America Medical Foods Market Value (USD Billion) Forecast, by Product Type, 2021 to 2036
Table 07: North America Medical Foods Market Value (USD Billion) Forecast, by Disease Type, 2021 to 2036
Table 08: North America Medical Foods Market Value (USD Billion) Forecast, by Route of Administration, 2021 to 2036
Table 09: North America Medical Foods Market Value (USD Billion) Forecast, by Distribution Channel, 2021 to 2036
Table 10: North America Medical Foods Market Value (USD Billion) Forecast, by Country, 2021 to 2036
Table 11: U.S. Medical Foods Market Value (USD Billion) Forecast, by Product Type, 2021 to 2036
Table 12: U.S. Medical Foods Market Value (USD Billion) Forecast, by Disease Type, 2021 to 2036
Table 13: U.S. Medical Foods Market Value (USD Billion) Forecast, by Route of Administration, 2021 to 2036
Table 14: U.S. Medical Foods Market Value (USD Billion) Forecast, by Distribution Channel, 2021 to 2036
Table 15: Canada Medical Foods Market Value (USD Billion) Forecast, by Product Type, 2021 to 2036
Table 16: Canada Medical Foods Market Value (USD Billion) Forecast, by Disease Type, 2021 to 2036
Table 17: Canada Medical Foods Market Value (USD Billion) Forecast, by Route of Administration, 2021 to 2036
Table 18: Canada Medical Foods Market Value (USD Billion) Forecast, by Distribution Channel, 2021 to 2036
Table 19: Europe Medical Foods Market Value (USD Billion) Forecast, by Product Type, 2021 to 2036
Table 20: Europe Medical Foods Market Value (USD Billion) Forecast, by Disease Type, 2021 to 2036
Table 21: Europe Medical Foods Market Value (USD Billion) Forecast, by Route of Administration, 2021 to 2036
Table 22: Europe Medical Foods Market Value (USD Billion) Forecast, by Distribution Channel, 2021 to 2036
Table 23: Europe Medical Foods Market Value (USD Billion) Forecast, by Country, 2021 to 2036
Table 24: U.K. Medical Foods Market Value (USD Billion) Forecast, by Product Type, 2021 to 2036
Table 25: U.K. Medical Foods Market Value (USD Billion) Forecast, by Disease Type, 2021 to 2036
Table 26: U.K. Medical Foods Market Value (USD Billion) Forecast, by Route of Administration, 2021 to 2036
Table 27: U.K. Medical Foods Market Value (USD Billion) Forecast, by Distribution Channel, 2021 to 2036
Table 28: Germany Medical Foods Market Value (USD Billion) Forecast, by Product Type, 2021 to 2036
Table 29: Germany Medical Foods Market Value (USD Billion) Forecast, by Disease Type, 2021 to 2036
Table 30: Germany Medical Foods Market Value (USD Billion) Forecast, by Route of Administration, 2021 to 2036
Table 31: Germany Medical Foods Market Value (USD Billion) Forecast, by Distribution Channel, 2021 to 2036
Table 32: France Medical Foods Market Value (USD Billion) Forecast, by Product Type, 2021 to 2036
Table 33: France Medical Foods Market Value (USD Billion) Forecast, by Disease Type, 2021 to 2036
Table 34: France Medical Foods Market Value (USD Billion) Forecast, by Route of Administration, 2021 to 2036
Table 35: France Medical Foods Market Value (USD Billion) Forecast, by Distribution Channel, 2021 to 2036
Table 36: Italy Medical Foods Market Value (USD Billion) Forecast, by Product Type, 2021 to 2036
Table 37: Italy Medical Foods Market Value (USD Billion) Forecast, by Disease Type, 2021 to 2036
Table 38: Italy Medical Foods Market Value (USD Billion) Forecast, by Route of Administration, 2021 to 2036
Table 39: Italy Medical Foods Market Value (USD Billion) Forecast, by Distribution Channel, 2021 to 2036
Table 40: Spain Medical Foods Market Value (USD Billion) Forecast, by Product Type, 2021 to 2036
Table 41: Spain Medical Foods Market Value (USD Billion) Forecast, by Disease Type, 2021 to 2036
Table 42: Spain Medical Foods Market Value (USD Billion) Forecast, by Route of Administration, 2021 to 2036
Table 43: Spain Medical Foods Market Value (USD Billion) Forecast, by Distribution Channel, 2021 to 2036
Table 44: Rest of Europe Medical Foods Market Value (USD Billion) Forecast, by Product Type, 2021 to 2036
Table 45: Rest of Europe Medical Foods Market Value (USD Billion) Forecast, by Disease Type, 2021 to 2036
Table 46: Rest of Europe Medical Foods Market Value (USD Billion) Forecast, by Route of Administration, 2021 to 2036
Table 47: Rest of Europe Medical Foods Market Value (USD Billion) Forecast, by Distribution Channel, 2021 to 2036
Table 48: Asia Pacific Medical Foods Market Value (USD Billion) Forecast, by Product Type, 2021 to 2036
Table 49: Asia Pacific Medical Foods Market Value (USD Billion) Forecast, by Disease Type, 2021 to 2036
Table 50: Asia Pacific Medical Foods Market Value (USD Billion) Forecast, by Route of Administration, 2021 to 2036
Table 51: Asia Pacific Medical Foods Market Value (USD Billion) Forecast, by Distribution Channel, 2021 to 2036
Table 52: Asia Pacific Medical Foods Market Value (USD Billion) Forecast, by Country, 2021 to 2036
Table 53: China Medical Foods Market Value (USD Billion) Forecast, by Product Type, 2021 to 2036
Table 54: China Medical Foods Market Value (USD Billion) Forecast, by Disease Type, 2021 to 2036
Table 55: China Medical Foods Market Value (USD Billion) Forecast, by Route of Administration, 2021 to 2036
Table 56: China Medical Foods Market Value (USD Billion) Forecast, by Distribution Channel, 2021 to 2036
Table 57: India Medical Foods Market Value (USD Billion) Forecast, by Product Type, 2021 to 2036
Table 58: India Medical Foods Market Value (USD Billion) Forecast, by Disease Type, 2021 to 2036
Table 59: India Medical Foods Market Value (USD Billion) Forecast, by Route of Administration, 2021 to 2036
Table 60: India Medical Foods Market Value (USD Billion) Forecast, by Distribution Channel, 2021 to 2036
Table 61: Japan Medical Foods Market Value (USD Billion) Forecast, by Product Type, 2021 to 2036
Table 62: Japan Medical Foods Market Value (USD Billion) Forecast, by Disease Type, 2021 to 2036
Table 63: Japan Medical Foods Market Value (USD Billion) Forecast, by Route of Administration, 2021 to 2036
Table 64: Japan Medical Foods Market Value (USD Billion) Forecast, by Distribution Channel, 2021 to 2036
Table 65: Australia & New Zealand Medical Foods Market Value (USD Billion) Forecast, by Product Type, 2021 to 2036
Table 66: Australia & New Zealand Medical Foods Market Value (USD Billion) Forecast, by Disease Type, 2021 to 2036
Table 67: Australia & New Zealand Medical Foods Market Value (USD Billion) Forecast, by Route of Administration, 2021 to 2036
Table 68: Australia & New Zealand Medical Foods Market Value (USD Billion) Forecast, by Distribution Channel, 2021 to 2036
Table 69: Rest of Asia Pacific Medical Foods Market Value (USD Billion) Forecast, by Product Type, 2021 to 2036
Table 70: Rest of Asia Pacific Medical Foods Market Value (USD Billion) Forecast, by Disease Type, 2021 to 2036
Table 71: Rest of Asia Pacific Medical Foods Market Value (USD Billion) Forecast, by Route of Administration, 2021 to 2036
Table 72: Rest of Asia Pacific Medical Foods Market Value (USD Billion) Forecast, by Distribution Channel, 2021 to 2036
Table 73: Latin America Medical Foods Market Value (USD Billion) Forecast, by Product Type, 2021 to 2036
Table 74: Latin America Medical Foods Market Value (USD Billion) Forecast, by Disease Type, 2021 to 2036
Table 75: Latin America Medical Foods Market Value (USD Billion) Forecast, by Route of Administration, 2021 to 2036
Table 76: Latin America Medical Foods Market Value (USD Billion) Forecast, by Distribution Channel, 2021 to 2036
Table 77: Latin America Medical Foods Market Value (USD Billion) Forecast, by Country, 2021 to 2036
Table 78: Brazil Medical Foods Market Value (USD Billion) Forecast, by Product Type, 2021 to 2036
Table 79: Brazil Medical Foods Market Value (USD Billion) Forecast, by Disease Type, 2021 to 2036
Table 80: Brazil Medical Foods Market Value (USD Billion) Forecast, by Route of Administration, 2021 to 2036
Table 81: Brazil Medical Foods Market Value (USD Billion) Forecast, by Distribution Channel, 2021 to 2036
Table 82: Mexico Medical Foods Market Value (USD Billion) Forecast, by Product Type, 2021 to 2036
Table 83: Mexico Medical Foods Market Value (USD Billion) Forecast, by Disease Type, 2021 to 2036
Table 84: Mexico Medical Foods Market Value (USD Billion) Forecast, by Route of Administration, 2021 to 2036
Table 85: Mexico Medical Foods Market Value (USD Billion) Forecast, by Distribution Channel, 2021 to 2036
Table 86: Rest of Latin America Medical Foods Market Value (USD Billion) Forecast, by Product Type, 2021 to 2036
Table 87: Rest of Latin America Medical Foods Market Value (USD Billion) Forecast, by Disease Type, 2021 to 2036
Table 88: Rest of Latin America Medical Foods Market Value (USD Billion) Forecast, by Route of Administration, 2021 to 2036
Table 89: Rest of Latin America Medical Foods Market Value (USD Billion) Forecast, by Distribution Channel, 2021 to 2036
Table 90: Middle East & Africa Medical Foods Market Value (USD Billion) Forecast, by Product Type, 2021 to 2036
Table 91: Middle East & Africa Medical Foods Market Value (USD Billion) Forecast, by Disease Type, 2021 to 2036
Table 92: Middle East & Africa Medical Foods Market Value (USD Billion) Forecast, by Route of Administration, 2021 to 2036
Table 93: Middle East & Africa Medical Foods Market Value (USD Billion) Forecast, by Distribution Channel, 2021 to 2036
Table 94: Middle East & Africa Medical Foods Market Value (USD Billion) Forecast, by Country, 2021 to 2036
Table 95: GCC Countries Medical Foods Market Value (USD Billion) Forecast, by Product Type, 2021 to 2036
Table 96: GCC Countries Medical Foods Market Value (USD Billion) Forecast, by Disease Type, 2021 to 2036
Table 97: GCC Countries Medical Foods Market Value (USD Billion) Forecast, by Route of Administration, 2021 to 2036
Table 98: GCC Countries Medical Foods Market Value (USD Billion) Forecast, by Distribution Channel, 2021 to 2036
Table 99: South Africa Medical Foods Market Value (USD Billion) Forecast, by Product Type, 2021 to 2036
Table 100: South Africa Medical Foods Market Value (USD Billion) Forecast, by Disease Type, 2021 to 2036
Table 101: South Africa Medical Foods Market Value (USD Billion) Forecast, by Route of Administration, 2021 to 2036
Table 102: South Africa Medical Foods Market Value (USD Billion) Forecast, by Distribution Channel, 2021 to 2036
Table 103: Rest of Middle East & Africa Medical Foods Market Value (USD Billion) Forecast, by Product Type, 2021 to 2036
Table 104: Rest of Middle East & Africa Medical Foods Market Value (USD Billion) Forecast, by Disease Type, 2021 to 2036
Table 105: Rest of Middle East & Africa Medical Foods Market Value (USD Billion) Forecast, by Route of Administration, 2021 to 2036
Table 106: Rest of Middle East & Africa Medical Foods Market Value (USD Billion) Forecast, by Distribution Channel, 2021 to 2036
Figure 01: Global Medical Foods Market Value (USD Billion) Forecast, 2021 to 2036
Figure 02: Global Medical Foods Market Value Share Analysis, by Product Type, 2025 and 2036
Figure 03: Global Medical Foods Market Attractiveness Analysis, by Product Type, 2026 to 2036
Figure 04: Global Medical Foods Market Revenue (USD Billion), by Pills, 2021 to 2036
Figure 05: Global Medical Foods Market Revenue (USD Billion), by Powder, 2021 to 2036
Figure 06: Global Medical Foods Market Revenue (USD Billion), by Liquid, 2021 to 2036
Figure 07: Global Medical Foods Market Revenue (USD Billion), by Others, 2021 to 2036
Figure 08: Global Medical Foods Market Value Share Analysis, by Disease Type, 2025 and 2036
Figure 09: Global Medical Foods Market Attractiveness Analysis, by Disease Type, 2026 to 2036
Figure 10: Global Medical Foods Market Revenue (USD Billion), by Orphan Disease, 2021 to 2036
Figure 11: Global Medical Foods Market Revenue (USD Billion), by Cancer, 2021 to 2036
Figure 12: Global Medical Foods Market Revenue (USD Billion), by Neurological & Psychological Disorders, 2021 to 2036
Figure 13: Global Medical Foods Market Revenue (USD Billion), by Metabolic Disorders, 2021 to 2036
Figure 14: Global Medical Foods Market Revenue (USD Billion), by Pain Management, 2021 to 2036
Figure 15: Global Medical Foods Market Revenue (USD Billion), by Gastrointestinal Disorders, 2021 to 2036
Figure 16: Global Medical Foods Market Revenue (USD Billion), by Ophthalmology, 2021 to 2036
Figure 17: Global Medical Foods Market Revenue (USD Billion), by Diabetes, 2021 to 2036
Figure 18: Global Medical Foods Market Revenue (USD Billion), by Phenylketonuria (PKU), 2021 to 2036
Figure 19: Global Medical Foods Market Revenue (USD Billion), by Epilepsy, 2021 to 2036
Figure 20: Global Medical Foods Market Value Share Analysis, by Route of Administration, 2025 and 2036
Figure 21: Global Medical Foods Market Attractiveness Analysis, by Route of Administration, 2026 to 2036
Figure 22: Global Medical Foods Market Revenue (USD Billion), by Oral, 2021 to 2036
Figure 23: Global Medical Foods Market Revenue (USD Billion), by Enteral, 2021 to 2036
Figure 24: Global Medical Foods Market Value Share Analysis, by Distribution Channel, 2025 and 2036
Figure 25: Global Medical Foods Market Attractiveness Analysis, by Distribution Channel, 2026 to 2036
Figure 26: Global Medical Foods Market Revenue (USD Billion), by Pharmacies & Drug Stores, 2021 to 2036
Figure 27: Global Medical Foods Market Revenue (USD Billion), by Online Channels, 2021 to 2036
Figure 28: Global Medical Foods Market Revenue (USD Billion), by Supermarkets & Hypermarkets, 2021 to 2036
Figure 29: Global Medical Foods Market Revenue (USD Billion), by Others, 2021 to 2036
Figure 30: Global Medical Foods Market Value Share Analysis, by Country/Sub-region, 2025 and 2036
Figure 31: Global Medical Foods Market Attractiveness Analysis, by Country/Sub-region, 2026 to 2036
Figure 32: North America Medical Foods Market Value (USD Billion) Forecast, 2021 to 2036
Figure 33: North America Medical Foods Market Value Share Analysis, by Product Type, 2025 and 2036
Figure 34: North America Medical Foods Market Attractiveness Analysis, by Product Type, 2026 to 2036
Figure 35: North America Medical Foods Market Value Share Analysis, by Disease Type, 2025 and 2036
Figure 36: North America Medical Foods Market Attractiveness Analysis, by Disease Type, 2026 to 2036
Figure 37: North America Medical Foods Market Value Share Analysis, by Route of Administration, 2025 and 2036
Figure 38: North America Medical Foods Market Attractiveness Analysis, by Route of Administration, 2026 to 2036
Figure 39: North America Medical Foods Market Value Share Analysis, by Distribution Channel, 2025 and 2036
Figure 40: North America Medical Foods Market Attractiveness Analysis, by Distribution Channel, 2026 to 2036
Figure 41: North America Medical Foods Market Value Share Analysis, by Country, 2025 and 2036
Figure 42: North America Medical Foods Market Attractiveness Analysis, by Country, 2026 to 2036
Figure 43: U.S. Medical Foods Market Value (USD Billion) Forecast, 2021 to 2036
Figure 44: U.S. Medical Foods Market Value Share Analysis, by Product Type, 2025 and 2036
Figure 45: U.S. Medical Foods Market Attractiveness Analysis, by Product Type, 2026 to 2036
Figure 46: U.S. Medical Foods Market Value Share Analysis, by Disease Type, 2025 and 2036
Figure 47: U.S. Medical Foods Market Attractiveness Analysis, by Disease Type, 2026 to 2036
Figure 48: U.S. Medical Foods Market Value Share Analysis, by Route of Administration, 2025 and 2036
Figure 49: U.S. Medical Foods Market Attractiveness Analysis, by Route of Administration, 2026 to 2036
Figure 50: U.S. Medical Foods Market Value Share Analysis, by Distribution Channel, 2025 and 2036
Figure 51: U.S. Medical Foods Market Attractiveness Analysis, by Distribution Channel, 2026 to 2036
Figure 52: Canada Medical Foods Market Value (USD Billion) Forecast, 2021 to 2036
Figure 53: Canada Medical Foods Market Value Share Analysis, by Product Type, 2025 and 2036
Figure 54: Canada Medical Foods Market Attractiveness Analysis, by Product Type, 2026 to 2036
Figure 55: Canada Medical Foods Market Value Share Analysis, by Disease Type, 2025 and 2036
Figure 56: Canada Medical Foods Market Attractiveness Analysis, by Disease Type, 2026 to 2036
Figure 57: Canada Medical Foods Market Value Share Analysis, by Route of Administration, 2025 and 2036
Figure 58: Canada Medical Foods Market Attractiveness Analysis, by Route of Administration, 2026 to 2036
Figure 59: Canada Medical Foods Market Value Share Analysis, by Distribution Channel, 2025 and 2036
Figure 60: Canada Medical Foods Market Attractiveness Analysis, by Distribution Channel, 2026 to 2036
Figure 61: Europe Medical Foods Market Value (USD Billion) Forecast, 2021 to 2036
Figure 62: Europe Medical Foods Market Value Share Analysis, by Product Type, 2025 and 2036
Figure 63: Europe Medical Foods Market Attractiveness Analysis, by Product Type, 2026 to 2036
Figure 64: Europe Medical Foods Market Value Share Analysis, by Disease Type, 2025 and 2036
Figure 65: Europe Medical Foods Market Attractiveness Analysis, by Disease Type, 2026 to 2036
Figure 66: Europe Medical Foods Market Value Share Analysis, by Route of Administration, 2025 and 2036
Figure 67: Europe Medical Foods Market Attractiveness Analysis, by Route of Administration, 2026 to 2036
Figure 68: Europe Medical Foods Market Value Share Analysis, by Distribution Channel, 2025 and 2036
Figure 69: Europe Medical Foods Market Attractiveness Analysis, by Distribution Channel, 2026 to 2036
Figure 70: Europe Medical Foods Market Value Share Analysis, by Country, 2025 and 2036
Figure 71: Europe Medical Foods Market Attractiveness Analysis, by Country, 2026 to 2036
Figure 72: U.K. Medical Foods Market Value (USD Billion) Forecast, 2021 to 2036
Figure 73: U.K. Medical Foods Market Value Share Analysis, by Product Type, 2025 and 2036
Figure 74: U.K. Medical Foods Market Attractiveness Analysis, by Product Type, 2026 to 2036
Figure 75: U.K. Medical Foods Market Value Share Analysis, by Disease Type, 2025 and 2036
Figure 76: U.K. Medical Foods Market Attractiveness Analysis, by Disease Type, 2026 to 2036
Figure 77: U.K. Medical Foods Market Value Share Analysis, by Route of Administration, 2025 and 2036
Figure 78: U.K. Medical Foods Market Attractiveness Analysis, by Route of Administration, 2026 to 2036
Figure 79: U.K. Medical Foods Market Value Share Analysis, by Distribution Channel, 2025 and 2036
Figure 80: U.K. Medical Foods Market Attractiveness Analysis, by Distribution Channel, 2026 to 2036
Figure 81: Germany Medical Foods Market Value (USD Billion) Forecast, 2021 to 2036
Figure 82: Germany Medical Foods Market Value Share Analysis, by Product Type, 2025 and 2036
Figure 83: Germany Medical Foods Market Attractiveness Analysis, by Product Type, 2026 to 2036
Figure 84: Germany Medical Foods Market Value Share Analysis, by Disease Type, 2025 and 2036
Figure 85: Germany Medical Foods Market Attractiveness Analysis, by Disease Type, 2026 to 2036
Figure 86: Germany Medical Foods Market Value Share Analysis, by Route of Administration, 2025 and 2036
Figure 87: Germany Medical Foods Market Attractiveness Analysis, by Route of Administration, 2026 to 2036
Figure 88: Germany Medical Foods Market Value Share Analysis, by Distribution Channel, 2025 and 2036
Figure 89: Germany Medical Foods Market Attractiveness Analysis, by Distribution Channel, 2026 to 2036
Figure 90: France Medical Foods Market Value (USD Billion) Forecast, 2021 to 2036
Figure 91: France Medical Foods Market Value Share Analysis, by Product Type, 2025 and 2036
Figure 92: France Medical Foods Market Attractiveness Analysis, by Product Type, 2026 to 2036
Figure 93: France Medical Foods Market Value Share Analysis, by Disease Type, 2025 and 2036
Figure 94: France Medical Foods Market Attractiveness Analysis, by Disease Type, 2026 to 2036
Figure 95: France Medical Foods Market Value Share Analysis, by Route of Administration, 2025 and 2036
Figure 96: France Medical Foods Market Attractiveness Analysis, by Route of Administration, 2026 to 2036
Figure 97: France Medical Foods Market Value Share Analysis, by Distribution Channel, 2025 and 2036
Figure 98: France Medical Foods Market Attractiveness Analysis, by Distribution Channel, 2026 to 2036
Figure 99: Italy Medical Foods Market Value (USD Billion) Forecast, 2021 to 2036
Figure 100: Italy Medical Foods Market Value Share Analysis, by Product Type, 2025 and 2036
Figure 101: Italy Medical Foods Market Attractiveness Analysis, by Product Type, 2026 to 2036
Figure 102: Italy Medical Foods Market Value Share Analysis, by Disease Type, 2025 and 2036
Figure 103: Italy Medical Foods Market Attractiveness Analysis, by Disease Type, 2026 to 2036
Figure 104: Italy Medical Foods Market Value Share Analysis, by Route of Administration, 2025 and 2036
Figure 105: Italy Medical Foods Market Attractiveness Analysis, by Route of Administration, 2026 to 2036
Figure 106: Italy Medical Foods Market Value Share Analysis, by Distribution Channel, 2025 and 2036
Figure 107: Italy Medical Foods Market Attractiveness Analysis, by Distribution Channel, 2026 to 2036
Figure 108: Spain Medical Foods Market Value (USD Billion) Forecast, 2021 to 2036
Figure 109: Spain Medical Foods Market Value Share Analysis, by Product Type, 2025 and 2036
Figure 110: Spain Medical Foods Market Attractiveness Analysis, by Product Type, 2026 to 2036
Figure 111: Spain Medical Foods Market Value Share Analysis, by Disease Type, 2025 and 2036
Figure 112: Spain Medical Foods Market Attractiveness Analysis, by Disease Type, 2026 to 2036
Figure 113: Spain Medical Foods Market Value Share Analysis, by Route of Administration, 2025 and 2036
Figure 114: Spain Medical Foods Market Attractiveness Analysis, by Route of Administration, 2026 to 2036
Figure 115: Spain Medical Foods Market Value Share Analysis, by Distribution Channel, 2025 and 2036
Figure 116: Spain Medical Foods Market Attractiveness Analysis, by Distribution Channel, 2026 to 2036
Figure 117: Rest of Europe Medical Foods Market Value (USD Billion) Forecast, 2021 to 2036
Figure 118: Rest of Europe Medical Foods Market Value Share Analysis, by Product Type, 2025 and 2036
Figure 119: Rest of Europe Medical Foods Market Attractiveness Analysis, by Product Type, 2026 to 2036
Figure 120: Rest of Europe Medical Foods Market Value Share Analysis, by Disease Type, 2025 and 2036
Figure 121: Rest of Europe Medical Foods Market Attractiveness Analysis, by Disease Type, 2026 to 2036
Figure 122: Rest of Europe Medical Foods Market Value Share Analysis, by Route of Administration, 2025 and 2036
Figure 123: Rest of Europe Medical Foods Market Attractiveness Analysis, by Route of Administration, 2026 to 2036
Figure 124: Rest of Europe Medical Foods Market Value Share Analysis, by Distribution Channel, 2025 and 2036
Figure 125: Rest of Europe Medical Foods Market Attractiveness Analysis, by Distribution Channel, 2026 to 2036
Figure 126: Asia Pacific Medical Foods Market Value (USD Billion) Forecast, 2021 to 2036
Figure 127: Asia Pacific Medical Foods Market Value Share Analysis, by Product Type, 2025 and 2036
Figure 128: Asia Pacific Medical Foods Market Attractiveness Analysis, by Product Type, 2026 to 2036
Figure 129: Asia Pacific Medical Foods Market Value Share Analysis, by Disease Type, 2025 and 2036
Figure 130: Asia Pacific Medical Foods Market Attractiveness Analysis, by Disease Type, 2026 to 2036
Figure 131: Asia Pacific Medical Foods Market Value Share Analysis, by Route of Administration, 2025 and 2036
Figure 132: Asia Pacific Medical Foods Market Attractiveness Analysis, by Route of Administration, 2026 to 2036
Figure 133: Asia Pacific Medical Foods Market Value Share Analysis, by Distribution Channel, 2025 and 2036
Figure 134: Asia Pacific Medical Foods Market Attractiveness Analysis, by Distribution Channel, 2026 to 2036
Figure 135: Asia Pacific Medical Foods Market Value Share Analysis, by Country, 2025 and 2036
Figure 136: Asia Pacific Medical Foods Market Attractiveness Analysis, by Country, 2026 to 2036
Figure 137: China Medical Foods Market Value (USD Billion) Forecast, 2021 to 2036
Figure 138: China Medical Foods Market Value Share Analysis, by Product Type, 2025 and 2036
Figure 139: China Medical Foods Market Attractiveness Analysis, by Product Type, 2026 to 2036
Figure 140: China Medical Foods Market Value Share Analysis, by Disease Type, 2025 and 2036
Figure 141: China Medical Foods Market Attractiveness Analysis, by Disease Type, 2026 to 2036
Figure 142: China Medical Foods Market Value Share Analysis, by Route of Administration, 2025 and 2036
Figure 143: China Medical Foods Market Attractiveness Analysis, by Route of Administration, 2026 to 2036
Figure 144: China Medical Foods Market Value Share Analysis, by Distribution Channel, 2025 and 2036
Figure 145: China Medical Foods Market Attractiveness Analysis, by Distribution Channel, 2026 to 2036
Figure 146: India Medical Foods Market Value (USD Billion) Forecast, 2021 to 2036
Figure 147: India Medical Foods Market Value Share Analysis, by Product Type, 2025 and 2036
Figure 148: India Medical Foods Market Attractiveness Analysis, by Product Type, 2026 to 2036
Figure 149: India Medical Foods Market Value Share Analysis, by Disease Type, 2025 and 2036
Figure 150: India Medical Foods Market Attractiveness Analysis, by Disease Type, 2026 to 2036
Figure 151: India Medical Foods Market Value Share Analysis, by Route of Administration, 2025 and 2036
Figure 152: India Medical Foods Market Attractiveness Analysis, by Route of Administration, 2026 to 2036
Figure 153: India Medical Foods Market Value Share Analysis, by Distribution Channel, 2025 and 2036
Figure 154: India Medical Foods Market Attractiveness Analysis, by Distribution Channel, 2026 to 2036
Figure 155: Japan Medical Foods Market Value (USD Billion) Forecast, 2021 to 2036
Figure 156: Japan Medical Foods Market Value Share Analysis, by Product Type, 2025 and 2036
Figure 157: Japan Medical Foods Market Attractiveness Analysis, by Product Type, 2026 to 2036
Figure 158: Japan Medical Foods Market Value Share Analysis, by Disease Type, 2025 and 2036
Figure 159: Japan Medical Foods Market Attractiveness Analysis, by Disease Type, 2026 to 2036
Figure 160: Japan Medical Foods Market Value Share Analysis, by Route of Administration, 2025 and 2036
Figure 161: Japan Medical Foods Market Attractiveness Analysis, by Route of Administration, 2026 to 2036
Figure 162: Japan Medical Foods Market Value Share Analysis, by Distribution Channel, 2025 and 2036
Figure 163: Japan Medical Foods Market Attractiveness Analysis, by Distribution Channel, 2026 to 2036
Figure 164: Australia & New Zealand Medical Foods Market Value (USD Billion) Forecast, 2021 to 2036
Figure 165: Australia & New Zealand Medical Foods Market Value Share Analysis, by Product Type, 2025 and 2036
Figure 166: Australia & New Zealand Medical Foods Market Attractiveness Analysis, by Product Type, 2026 to 2036
Figure 167: Australia & New Zealand Medical Foods Market Value Share Analysis, by Disease Type, 2025 and 2036
Figure 168: Australia & New Zealand Medical Foods Market Attractiveness Analysis, by Disease Type, 2026 to 2036
Figure 169: Australia & New Zealand Medical Foods Market Value Share Analysis, by Route of Administration, 2025 and 2036
Figure 170: Australia & New Zealand Medical Foods Market Attractiveness Analysis, by Route of Administration, 2026 to 2036
Figure 171: Australia & New Zealand Medical Foods Market Value Share Analysis, by Distribution Channel, 2025 and 2036
Figure 172: Australia & New Zealand Medical Foods Market Attractiveness Analysis, by Distribution Channel, 2026 to 2036
Figure 173: Rest of Asia Pacific Medical Foods Market Value (USD Billion) Forecast, 2021 to 2036
Figure 174: Rest of Asia Pacific Medical Foods Market Value Share Analysis, by Product Type, 2025 and 2036
Figure 175: Rest of Asia Pacific Medical Foods Market Attractiveness Analysis, by Product Type, 2026 to 2036
Figure 176: Rest of Asia Pacific Medical Foods Market Value Share Analysis, by Disease Type, 2025 and 2036
Figure 177: Rest of Asia Pacific Medical Foods Market Attractiveness Analysis, by Disease Type, 2026 to 2036
Figure 178: Rest of Asia Pacific Medical Foods Market Value Share Analysis, by Route of Administration, 2025 and 2036
Figure 179: Rest of Asia Pacific Medical Foods Market Attractiveness Analysis, by Route of Administration, 2026 to 2036
Figure 180: Rest of Asia Pacific Medical Foods Market Value Share Analysis, by Distribution Channel, 2025 and 2036
Figure 181: Rest of Asia Pacific Medical Foods Market Attractiveness Analysis, by Distribution Channel, 2026 to 2036
Figure 182: Latin America Medical Foods Market Value (USD Billion) Forecast, 2021 to 2036
Figure 183: Latin America Medical Foods Market Value Share Analysis, by Product Type, 2025 and 2036
Figure 184: Latin America Medical Foods Market Attractiveness Analysis, by Product Type, 2026 to 2036
Figure 185: Latin America Medical Foods Market Value Share Analysis, by Disease Type, 2025 and 2036
Figure 186: Latin America Medical Foods Market Attractiveness Analysis, by Disease Type, 2026 to 2036
Figure 187: Latin America Medical Foods Market Value Share Analysis, by Route of Administration, 2025 and 2036
Figure 188: Latin America Medical Foods Market Attractiveness Analysis, by Route of Administration, 2026 to 2036
Figure 189: Latin America Medical Foods Market Value Share Analysis, by Distribution Channel, 2025 and 2036
Figure 190: Latin America Medical Foods Market Attractiveness Analysis, by Distribution Channel, 2026 to 2036
Figure 191: Latin America Medical Foods Market Value Share Analysis, by Country, 2025 and 2036
Figure 192: Latin America Medical Foods Market Attractiveness Analysis, by Country, 2026 to 2036
Figure 193: Brazil Medical Foods Market Value (USD Billion) Forecast, 2021 to 2036
Figure 194: Brazil Medical Foods Market Value Share Analysis, by Product Type, 2025 and 2036
Figure 195: Brazil Medical Foods Market Attractiveness Analysis, by Product Type, 2026 to 2036
Figure 196: Brazil Medical Foods Market Value Share Analysis, by Disease Type, 2025 and 2036
Figure 197: Brazil Medical Foods Market Attractiveness Analysis, by Disease Type, 2026 to 2036
Figure 198: Brazil Medical Foods Market Value Share Analysis, by Route of Administration, 2025 and 2036
Figure 199: Brazil Medical Foods Market Attractiveness Analysis, by Route of Administration, 2026 to 2036
Figure 200: Brazil Medical Foods Market Value Share Analysis, by Distribution Channel, 2025 and 2036
Figure 201: Brazil Medical Foods Market Attractiveness Analysis, by Distribution Channel, 2026 to 2036
Figure 202: Mexico Medical Foods Market Value (USD Billion) Forecast, 2021 to 2036
Figure 203: Mexico Medical Foods Market Value Share Analysis, by Product Type, 2025 and 2036
Figure 204: Mexico Medical Foods Market Attractiveness Analysis, by Product Type, 2026 to 2036
Figure 205: Mexico Medical Foods Market Value Share Analysis, by Disease Type, 2025 and 2036
Figure 206: Mexico Medical Foods Market Attractiveness Analysis, by Disease Type, 2026 to 2036
Figure 207: Mexico Medical Foods Market Value Share Analysis, by Route of Administration, 2025 and 2036
Figure 208: Mexico Medical Foods Market Attractiveness Analysis, by Route of Administration, 2026 to 2036
Figure 209: Mexico Medical Foods Market Value Share Analysis, by Distribution Channel, 2025 and 2036
Figure 210: Mexico Medical Foods Market Attractiveness Analysis, by Distribution Channel, 2026 to 2036
Figure 211: Rest of Latin America Medical Foods Market Value (USD Billion) Forecast, 2021 to 2036
Figure 212: Rest of Latin America Medical Foods Market Value Share Analysis, by Product Type, 2025 and 2036
Figure 213: Rest of Latin America Medical Foods Market Attractiveness Analysis, by Product Type, 2026 to 2036
Figure 214: Rest of Latin America Medical Foods Market Value Share Analysis, by Disease Type, 2025 and 2036
Figure 215: Rest of Latin America Medical Foods Market Attractiveness Analysis, by Disease Type, 2026 to 2036
Figure 216: Rest of Latin America Medical Foods Market Value Share Analysis, by Route of Administration, 2025 and 2036
Figure 217: Rest of Latin America Medical Foods Market Attractiveness Analysis, by Route of Administration, 2026 to 2036
Figure 218: Rest of Latin America Medical Foods Market Value Share Analysis, by Distribution Channel, 2025 and 2036
Figure 219: Rest of Latin America Medical Foods Market Attractiveness Analysis, by Distribution Channel, 2026 to 2036
Figure 220: Middle East & Africa Medical Foods Market Value (USD Billion) Forecast, 2021 to 2036
Figure 221: Middle East & Africa Medical Foods Market Value Share Analysis, by Product Type, 2025 and 2036
Figure 222: Middle East & Africa Medical Foods Market Attractiveness Analysis, by Product Type, 2026 to 2036
Figure 223: Middle East & Africa Medical Foods Market Value Share Analysis, by Disease Type, 2025 and 2036
Figure 224: Middle East & Africa Medical Foods Market Attractiveness Analysis, by Disease Type, 2026 to 2036
Figure 225: Middle East & Africa Medical Foods Market Value Share Analysis, by Route of Administration, 2025 and 2036
Figure 226: Middle East & Africa Medical Foods Market Attractiveness Analysis, by Route of Administration, 2026 to 2036
Figure 227: Middle East & Africa Medical Foods Market Value Share Analysis, by Distribution Channel, 2025 and 2036
Figure 228: Middle East & Africa Medical Foods Market Attractiveness Analysis, by Distribution Channel, 2026 to 2036
Figure 229: Middle East & Africa Medical Foods Market Value Share Analysis, by Country, 2025 and 2036
Figure 230: Middle East & Africa Medical Foods Market Attractiveness Analysis, by Country, 2026 to 2036
Figure 231: GCC Countries Medical Foods Market Value (USD Billion) Forecast, 2021 to 2036
Figure 232: GCC Countries Medical Foods Market Value Share Analysis, by Product Type, 2025 and 2036
Figure 233: GCC Countries Medical Foods Market Attractiveness Analysis, by Product Type, 2026 to 2036
Figure 234: GCC Countries Medical Foods Market Value Share Analysis, by Disease Type, 2025 and 2036
Figure 235: GCC Countries Medical Foods Market Attractiveness Analysis, by Disease Type, 2026 to 2036
Figure 236: GCC Countries Medical Foods Market Value Share Analysis, by Route of Administration, 2025 and 2036
Figure 237: GCC Countries Medical Foods Market Attractiveness Analysis, by Route of Administration, 2026 to 2036
Figure 238: GCC Countries Medical Foods Market Value Share Analysis, by Distribution Channel, 2025 and 2036
Figure 239: GCC Countries Medical Foods Market Attractiveness Analysis, by Distribution Channel, 2026 to 2036
Figure 240: South Africa Medical Foods Market Value (USD Billion) Forecast, 2021 to 2036
Figure 241: South Africa Medical Foods Market Value Share Analysis, by Product Type, 2025 and 2036
Figure 242: South Africa Medical Foods Market Attractiveness Analysis, by Product Type, 2026 to 2036
Figure 243: South Africa Medical Foods Market Value Share Analysis, by Disease Type, 2025 and 2036
Figure 244: South Africa Medical Foods Market Attractiveness Analysis, by Disease Type, 2026 to 2036
Figure 245: South Africa Medical Foods Market Value Share Analysis, by Route of Administration, 2025 and 2036
Figure 246: South Africa Medical Foods Market Attractiveness Analysis, by Route of Administration, 2026 to 2036
Figure 247: South Africa Medical Foods Market Value Share Analysis, by Distribution Channel, 2025 and 2036
Figure 248: South Africa Medical Foods Market Attractiveness Analysis, by Distribution Channel, 2026 to 2036
Figure 249: Rest of Middle East & Africa Medical Foods Market Value (USD Billion) Forecast, 2021 to 2036
Figure 250: Rest of Middle East & Africa Medical Foods Market Value Share Analysis, by Product Type, 2025 and 2036
Figure 251: Rest of Middle East & Africa Medical Foods Market Attractiveness Analysis, by Product Type, 2026 to 2036
Figure 252: Rest of Middle East & Africa Medical Foods Market Value Share Analysis, by Disease Type, 2025 and 2036
Figure 253: Rest of Middle East & Africa Medical Foods Market Attractiveness Analysis, by Disease Type, 2026 to 2036
Figure 254: Rest of Middle East & Africa Medical Foods Market Value Share Analysis, by Route of Administration, 2025 and 2036
Figure 255: Rest of Middle East & Africa Medical Foods Market Attractiveness Analysis, by Route of Administration, 2026 to 2036
Figure 256: Rest of Middle East & Africa Medical Foods Market Value Share Analysis, by Distribution Channel, 2025 and 2036
Figure 257: Rest of Middle East & Africa Medical Foods Market Attractiveness Analysis, by Distribution Channel, 2026 to 2036
Copyright © Transparency Market Research, Inc. All Rights reserved
Trust Online


Medical Foods Market
