
Reports
Reports
Companies operating within various verticals in the chemical industry, including the paints & coatings sector, are continually focusing on introducing innovative and sustainable products to the global markets. Environmental concerns and stringent regulations pertaining to the use of these products have played an important role in influencing the growth trajectory of the global waterborne coatings market over the past decade. In addition, significant advancements in pigment, additive, and resin technologies is another major factor that is set to increase the demand for waterborne coatings during the forecast period.
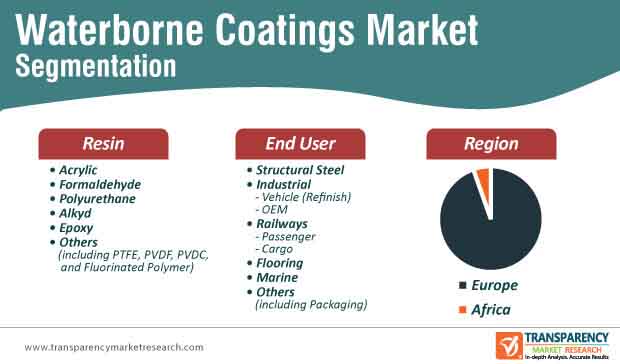
Companies operating in the current market for waterborne coatings are expected to focus on formulating new marketing strategies amidst the onset of the global COVID-19 pandemic and eye opportunities within the digital space to improve their brand visibility. In addition, companies are also expected to invest in research and development activities and new technologies to improve the quality of their products and produce innovative solutions as per the requirements of the different end-use industries, including, automotive, steel manufacturers, railway, marine, and flooring. The soaring demand from the automotive sector is projected to provide winds to the sails to the growth of the global waterborne coatings market in the upcoming years. At the back of these factors coupled with the surge in demand for waterborne coatings in the industrial sector and high demand for steel in Europe and Africa, the waterborne coatings market in Europe and Africa is expected to expand during the forecast period.
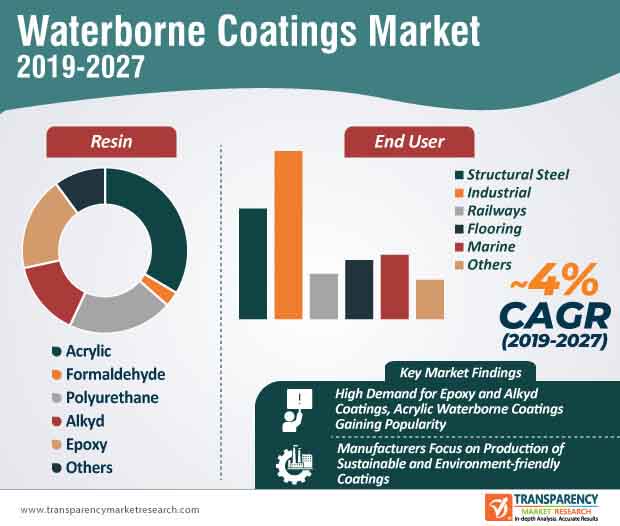
The demand for waterborne coatings in recent years has witnessed a considerable surge, as they are increasingly being used in building materials as a cost-effective alternative to preserve and offer protection to surfaces. As waterborne coating manufacturers continue to attract new customers by increasing the eco-friendly quotient of their products, waterborne coatings have gradually emerged as one of the most popular coating types. Companies operating in the waterborne coatings market landscape are increasingly investing resources to improve the mechanical and photo-oxidation resistance of their products. Acrylic waterborne coatings have gained a noteworthy amount of popularity in recent years and the trend is set to continue over the forecast period.
The desirable hydrophilic/hydrophobic nature, surface morphology, and mechanical resistance are the major factors that have increased the demand for acrylic waterborne coatings. The mounting concerns pertaining to the durability of the building or construction materials coupled with challenges such as water penetration and abiotic factors in porous materials have led to a tectonic rise in demand for acrylic waterborne coatings. Over the past few years, significant pressure applied by regulatory bodies to minimize the emission of volatile organic compounds (VOC) has played an important role in the development of different types of waterborne coatings that are eco-friendly and easy to apply. While the development of eco-friendly products is likely to remain an important area of research, market players are also expected to enhance the performance and quality of their products.
The outbreak of the novel COVID-19 pandemic is expected to strongly impact the growth trajectory of the waterborne coatings market in Europe and Africa during the forecast period. Some of the key areas that are likely to feel the impact of the COVID-19 pandemic include service work and repairs, project timelines & scheduling, inbound logistics, order fulfillment, transportation, distribution channels, delays in procuring raw materials, daily lab activities, etc. While the import and export from China were predominantly affected initially, at present, trade activities are on the decline on the global scale. Moreover, while several companies are anticipated to improve cleanliness in their manufacturing facilities, the focus will largely remain on formulating digital marketing strategies and packaging. With the global decline in the number of construction activities, sales will remain relatively lower.
However, companies are likely to assess the market trends and forge new strategic alliances with market players in different regions to improve their market share and presence. Product innovation, pricing strategies, and product development are likely to remain the key area of focus for market players. In addition, addressing the supply chain bottlenecks will remain a major challenge for players operating in the current waterborne coatings market.
Analysts’ Viewpoint
The waterborne coatings market in Africa and Europe is expected to witness steady growth in the upcoming years. The COVID-19 pandemic is likely to affect operations, supply chains, and disrupt business models of companies across the world. However, companies should focus on digital marketing and online strategies to improve their market and brand visibility and eye sales opportunities on online platforms, including Alibaba. Product innovation and research & development activities will play an important role in improving sales in the near future.
Europe to Dominate Europe and Africa Waterborne Coatings Market
Leading Players Operating in Europe and Africa Waterborne Coatings Market
1. Executive Summary
1.1. Market Snapshot: Waterborne Coatings
1.2. Key Trends
1.3. Waterborne Coatings Volume Share Analysis, by Resin, 2018
1.4. Waterborne Coatings Volume Share Analysis, by End-user, 2018
2. Market Overview
2.1. Product Overview
2.2. Market Indicators
2.3. Drivers and Restraints Snapshot Analysis
2.3.1. Drivers
2.3.2. Restraints
2.3.3. Opportunities
2.4. Porter’s Five Forces Analysis
2.4.1. Threat of Substitutes
2.4.2. Bargaining Power of Buyers
2.4.3. Bargaining Power of Suppliers
2.4.4. Threat of New Entrants
2.4.5. Degree of Competition
2.5. Value Chain Analysis
2.6. List of Potential Customers
3. Production Output Analysis
4. Pricing Analysis
4.1. Waterborne Coatings, Pricing Analysis (US$/Ton), by Resin, Europe, 2018-2027
4.2. Waterborne Coatings, Pricing Analysis (US$/Ton), by Resin, Africa, 2018-2027
4.3. Waterborne Coatings Pricing Analysis (US$/Ton), by Region, 2018-2027
5. Europe Waterborne Coatings Market Analysis and Forecast
5.1. Key Findings
5.2. Europe Waterborne Coatings Overview
5.3. Europe Waterborne Coatings Market Volume Share Analysis and Forecast, by Resin, 2018 and 2027
5.4. Europe Waterborne Coatings Market Volume (Tons) and Value (US$ Mn) Forecast, by Resin, 2018–2027
5.4.1. Acrylic
5.4.2. Formaldehyde
5.4.3. Polyurethane
5.4.4. Alkyd
5.4.5. Epoxy
5.4.6. Others (including PTFE, PVDF, PVDC, and Fluorinated Polymer)
5.5. Europe Waterborne Coatings Market Volume Share Analysis and Forecast, by End-user, 2018 and 2027
5.6. Europe Waterborne Coatings Market Volume (Tons) and Value (US$ Mn) Forecast, by End-user, 2018–2027
5.6.1. Structural Steel
5.6.2. Industrial
5.6.2.1. Vehicle (Refinish)
5.6.2.2. OEM
5.6.3. Railways
5.6.3.1. Passenger
5.6.3.2. Cargo
5.6.4. Flooring
5.6.5. Marine
5.6.6. Others (including Packaging)
5.7. Europe Waterborne Coatings Market Volume Share Analysis and Forecast, by Country and Sub-region, 2018 and 2027
5.8. Europe Waterborne Coatings Market Volume (Tons) and Value (US$ Mn) Forecast, by Country and Sub-region, 2018–2027
5.8.1. Germany Waterborne Coatings Market Volume (Tons) and Value (US$ Mn) Forecast, by Resin, 2018–2027
5.8.2. Germany Waterborne Coatings Market Volume (Tons) and Value (US$ Mn) Forecast, by End-user, 2018–2027
5.8.3. Italy Waterborne Coatings Market Volume (Tons) and Value (US$ Mn) Forecast, by Resin, 2018–2027
5.8.4. Italy Waterborne Coatings Market Volume (Tons) and Value (US$ Mn) Forecast, by End-user, 2018–2027
5.8.5. U.K. Waterborne Coatings Market Volume (Tons) and Value (US$ Mn) Forecast, by Resin, 2018–2027
5.8.6. U.K. Waterborne Coatings Market Volume (Tons) and Value (US$ Mn) Forecast, by End-user, 2018–2027
5.8.7. France Waterborne Coatings Market Volume (Tons) and Value (US$ Mn) Forecast, by Resin, 2018–2027
5.8.8. France Waterborne Coatings Market Volume (Tons) and Value (US$ Mn) Forecast, by End-user, 2018–2027
5.8.9. Spain Waterborne Coatings Market Volume (Tons) and Value (US$ Mn) Forecast, by Resin, 2018–2027
5.8.10. Spain Waterborne Coatings Market Volume (Tons) and Value (US$ Mn) Forecast, by End-user, 2018–2027
5.8.11. Greece Waterborne Coatings Market Volume (Tons) and Value (US$ Mn) Forecast, by Resin, 2018–2027
5.8.12. Greece Waterborne Coatings Market Volume (Tons) and Value (US$ Mn) Forecast, by End-user, 2018–2027
5.8.13. Turkey Waterborne Coatings Market Volume (Tons) and Value (US$ Mn) Forecast, by Resin, 2018–2027
5.8.14. Turkey Waterborne Coatings Market Volume (Tons) and Value (US$ Mn) Forecast, by End-user, 2018–2027
5.8.15. Poland Waterborne Coatings Market Volume (Tons) and Value (US$ Mn) Forecast, by Resin, 2018–2027
5.8.16. Poland Waterborne Coatings Market Volume (Tons) and Value (US$ Mn) Forecast, by End-user, 2018–2027
5.8.17. Russia & CIS Waterborne Coatings Market Volume (Tons) and Value (US$ Mn) Forecast, by Resin, 2018–2027
5.8.18. Russia & CIS Waterborne Coatings Market Volume (Tons) and Value (US$ Mn) Forecast, by End-user, 2018–2027
5.8.19. Rest of Europe Waterborne Coatings Market Volume (Tons) and Value (US$ Mn) Forecast, by Resin, 2018–2027
5.8.20. Rest of Europe Waterborne Coatings Market Volume (Tons) and Value (US$ Mn) Forecast, by End-user, 2018–2027
6. Africa Waterborne Coatings Market Analysis and Forecast
6.1. Key Findings
6.2. Africa Waterborne Coatings Market Overview
6.3. Africa Waterborne Coatings Market Volume Share Analysis and Forecast, by Resin, 2018 and 2027
6.4. Africa Waterborne Coatings Market Volume (Tons) and Value (US$ Mn) Forecast, by Resin, 2018–2027
6.4.1. Acrylic
6.4.2. Formaldehyde
6.4.3. Polyurethane
6.4.4. Alkyd
6.4.5. Epoxy
6.4.6. Others (including PTFE, PVDF, PVDC, and Fluorinated Polymer)
6.5. Africa Waterborne Coatings Market Volume Share Analysis and Forecast, by End-user, 2018 and 2027
6.6. Africa Waterborne Coatings Market Volume (Tons) and Value (US$ Mn) Forecast, by End-user, 2018–2027
6.6.1. Structural Steel
6.6.2. Industrial
6.6.2.1. Vehicle (Refinish)
6.6.2.2. OEM
6.6.3. Railways
6.6.3.1. Passenger
6.6.3.2. Cargo
6.6.4. Flooring
6.6.5. Marine
6.6.6. Others (including Packaging)
6.7. Africa Waterborne Coatings Market Volume Share Analysis and Forecast, by Country and Sub-region, 2018 and 2027
6.8. Africa Waterborne Coatings Market Volume (Tons) and Value (US$ Mn) Forecast, by Country and Sub-region, 2018–2027
6.8.1. Nigeria Waterborne Coatings Market Volume (Tons) and Value (US$ Mn) Forecast, by Resin, 2018–2027
6.8.2. Nigeria Waterborne Coatings Market Volume (Tons) and Value (US$ Mn) Forecast, by End-user, 2018–2027
6.8.3. Egypt Waterborne Coatings Market Volume (Tons) and Value (US$ Mn) Forecast, by Resin, 2018–2027
6.8.4. Egypt Waterborne Coatings Market Volume (Tons) and Value (US$ Mn) Forecast, by End-user, 2018–2027
6.8.5. Morocco Waterborne Coatings Market Volume (Tons) and Value (US$ Mn) Forecast, by Resin, 2018–2027
6.8.6. Morocco Waterborne Coatings Market Volume (Tons) and Value (US$ Mn) Forecast, by End-user, 2018–2027
6.8.7. Rest of Africa Waterborne Coatings Market Volume (Tons) and Value (US$ Mn) Forecast, by Resin, 2018–2027
6.8.8. Rest of Africa Waterborne Coatings Market Volume (Tons) and Value (US$ Mn) Forecast, by End-user, 2018–2027
7. Competition Landscape
7.1. Waterborne Coatings Share Analysis, by Company (2018)
7.2. Company Profiles
7.2.1. PPG Industries, Inc.
7.2.1.1. Headquarters, Year of Establishment, Revenue, Key Management, Number of Employees
7.2.1.2. Company Description
7.2.1.3. Business Segments
7.2.1.4. End-user
7.2.1.5. Revenue (US$ Mn) and Y-o-Y Growth (%), 2015–2018
7.2.1.6. Breakdown of Revenue, by Geography, 2018
7.2.1.7. Breakdown of Net Sales, by Business Segment, 2018
7.2.1.8. Key Developments
7.2.2. The Sherwin-Williams Company
7.2.2.1. Headquarters, Year of Establishment, Revenue, Key Management, Number of Employees
7.2.2.2. Company Description
7.2.2.3. Business Segments
7.2.2.4. End-user
7.2.2.5. Revenue (US$ Mn) and Y-o-Y Growth (%), 2015–2018
7.2.2.6. Breakdown of Revenue, by Geography, 2018
7.2.2.7. Breakdown of Net Sales, by Business Segment, 2018
7.2.2.8. Key Developments
7.2.3. Akzo Nobel N.V.
7.2.3.1. Headquarters, Year of Establishment, Revenue, Key Management, Number of Employees
7.2.3.2. Company Description
7.2.3.3. Business Segments
7.2.3.4. End-user
7.2.3.5. Revenue (US$ Mn) and Y-o-Y Growth (%), 2015–2018
7.2.3.6. Breakdown of Revenue, by Geography, 2018
7.2.3.7. Breakdown of Net Sales, by Business Segment, 2018
7.2.3.8. Key Developments
7.2.4. RPM International Inc.
7.2.4.1. Headquarters, Year of Establishment, Revenue, Key Management, Number of Employees
7.2.4.2. Company Description
7.2.4.3. Business Segments
7.2.4.4. End-user
7.2.4.5. Revenue (US$ Mn) and Y-o-Y Growth (%), 2015–2018
7.2.4.6. Breakdown of Revenue, by Geography, 2018
7.2.4.7. Breakdown of Net Sales, by Business Segment, 2018
7.2.4.8. Key Developments
7.2.5. Axalta Coating Systems Ltd.
7.2.5.1. Headquarters, Year of Establishment, Revenue, Key Management, Number of Employees
7.2.5.2. Company Description
7.2.5.3. Business Segments
7.2.5.4. End-user
7.2.5.5. Revenue (US$ Mn) and Y-o-Y Growth (%), 2015–2018
7.2.5.6. Breakdown of Revenue, by Geography, 2018
7.2.5.7. Breakdown of Net Sales, by Business Segment, 2018
7.2.5.8. Key Developments
7.2.6. Nippon Paint Holdings Co., Ltd.
7.2.6.1. Headquarters, Year of Establishment, Revenue, Key Management, Number of Employees
7.2.6.2. Company Description
7.2.6.3. Business Segments
7.2.6.4. End-user
7.2.6.5. Revenue (US$ Mn) and Y-o-Y Growth (%), 2015–2018
7.2.6.6. Breakdown of Revenue, by Geography, 2018
7.2.6.7. Breakdown of Net Sales, by Business Segment, 2018
7.2.6.8. Key Developments
7.2.7. Kansai Paint Co.Ltd.
7.2.7.1. Headquarters, Year of Establishment, Revenue, Key Management, Number of Employees
7.2.7.2. Company Description
7.2.7.3. Business Segments
7.2.7.4. End-user
7.2.7.5. Revenue (US$ Mn) and Y-o-Y Growth (%), 2015–2018
7.2.7.6. Breakdown of Revenue, by Geography, 2018
7.2.7.7. Breakdown of Net Sales, by Business Segment, 2018
7.2.7.8. Key Developments
7.2.8. Sika AG
7.2.8.1. Headquarters, Year of Establishment, Revenue, Key Management, Number of Employees
7.2.8.2. Company Description
7.2.8.3. Business Segments
7.2.8.4. End-user
7.2.8.5. Revenue (US$ Mn) and Y-o-Y Growth (%), 2015–2018
7.2.8.6. Breakdown of Revenue, by Geography, 2018
7.2.8.7. Breakdown of Net Sales, by Business Segment, 2018
7.2.8.8. Key Developments
7.2.9. Jotun A/S
7.2.9.1. Headquarters, Year of Establishment, Revenue, Key Management, Number of Employees
7.2.9.2. Company Description
7.2.9.3. Business Segments
7.2.9.4. End-user
7.2.9.5. Revenue (US$ Mn) and Y-o-Y Growth (%), 2015–2018
7.2.9.6. Breakdown of Revenue, by Geography, 2018
7.2.9.7. Breakdown of Net Sales, by Business Segment, 2018
7.2.9.8. Key Developments
7.2.10. SKK(S) Pte. Ltd.
7.2.10.1. Headquarters, Year of Establishment, Revenue, Key Management, Number of Employees
7.2.10.2. Company Description
7.2.10.3. Business Segments
7.2.10.4. End-user
7.2.10.5. Revenue (US$ Mn) and Y-o-Y Growth (%), 2015–2018
7.2.10.6. Breakdown of Revenue, by Geography, 2018
7.2.10.7. Breakdown of Net Sales, by Business Segment, 2018
7.2.10.8. Key Developments
7.2.11. Hebei Chenyang Industry and Trade Group Co., Ltd
7.2.11.1. Headquarters, Year of Establishment, Revenue, Key Management, Number of Employees
7.2.11.2. Company Description
7.2.11.3. Business Segments
7.2.11.4. End-user
7.2.11.5. Revenue (US$ Mn) and Y-o-Y Growth (%), 2015–2018
7.2.11.6. Breakdown of Revenue, by Geography, 2018
7.2.11.7. Breakdown of Net Sales, by Business Segment, 2018
7.2.11.8. Key Developments
7.2.12. Altana AG
7.2.12.1. Headquarters, Year of Establishment, Revenue, Key Management, Number of Employees
7.2.12.2. Company Description
7.2.12.3. Business Segments
7.2.12.4. End-user
7.2.12.5. Revenue (US$ Mn) and Y-o-Y Growth (%), 2015–2018
7.2.12.6. Breakdown of Revenue, by Geography, 2018
7.2.12.7. Breakdown of Net Sales, by Business Segment, 2018
7.2.12.8. Key Developments
7.2.13. Berger Paints India Limited
7.2.13.1. Headquarters, Year of Establishment, Revenue, Key Management, Number of Employees
7.2.13.2. Company Description
7.2.13.3. Business Segments
7.2.13.4. End-user
7.2.13.5. Revenue (US$ Mn) and Y-o-Y Growth (%), 2015–2018
7.2.13.6. Breakdown of Revenue, by Geography, 2018
7.2.13.7. Breakdown of Net Sales, by Business Segment, 2018
7.2.13.8. Key Developments
7.2.14. Henkel AG & Company, KGaA
7.2.14.1. Headquarters, Year of Establishment, Revenue, Key Management, Number of Employees
7.2.14.2. Company Description
7.2.14.3. Business Segments
7.2.14.4. End-user
7.2.14.5. Revenue (US$ Mn) and Y-o-Y Growth (%), 2015–2018
7.2.14.6. Breakdown of Revenue, by Geography, 2018
7.2.14.7. Breakdown of Net Sales, by Business Segment, 2018
7.2.14.8. Key Developments
7.2.15. Hempel A/S
7.2.15.1. Headquarters, Year of Establishment, Revenue, Key Management, Number of Employees
7.2.15.2. Company Description
7.2.15.3. Business Segments
7.2.15.4. End-user
7.2.15.5. Revenue (US$ Mn) and Y-o-Y Growth (%), 2015–2018
7.2.15.6. Breakdown of Revenue, by Geography, 2018
7.2.15.7. Breakdown of Net Sales, by Business Segment, 2018
7.2.15.8. Key Developments
7.2.16. Tikkurila Oyj
7.2.16.1. Headquarters, Year of Establishment, Revenue, Key Management, Number of Employees
7.2.16.2. Company Description
7.2.16.3. Business Segments
7.2.16.4. End-user
7.2.16.5. Revenue (US$ Mn) and Y-o-Y Growth (%), 2015–2018
7.2.16.6. Breakdown of Revenue, by Geography, 2018
7.2.16.7. Breakdown of Net Sales, by Business Segment, 2018
7.2.16.8. Key Developments
7.2.17. Acrymatic Coating ApS
7.2.17.1. Headquarters, Year of Establishment, Revenue, Key Management, Number of Employees
7.2.17.2. Company Description
7.2.17.3. Business Segments
7.2.17.4. End-user
7.2.17.5. Revenue (US$ Mn) and Y-o-Y Growth (%), 2015–2018
7.2.17.6. Breakdown of Revenue, by Geography, 2018
7.2.17.7. Breakdown of Net Sales, by Business Segment, 2018
7.2.17.8. Key Developments
7.2.18. RD Coatings
7.2.18.1. Headquarters, Year of Establishment, Revenue, Key Management, Number of Employees
7.2.18.2. Company Description
7.2.18.3. Business Segments
7.2.18.4. End-user
7.2.18.5. Revenue (US$ Mn) and Y-o-Y Growth (%), 2015–2018
7.2.18.6. Breakdown of Revenue, by Geography, 2018
7.2.18.7. Breakdown of Net Sales, by Business Segment, 2018
7.2.18.8. Key Developments
7.2.19. Baril Coatings
7.2.19.1. Headquarters, Year of Establishment, Revenue, Key Management, Number of Employees
7.2.19.2. Company Description
7.2.19.3. Business Segments
7.2.19.4. End-user
7.2.19.5. Revenue (US$ Mn) and Y-o-Y Growth (%), 2015–2018
7.2.19.6. Breakdown of Revenue, by Geography, 2018
7.2.19.7. Breakdown of Net Sales, by Business Segment, 2018
7.2.19.8. Key Developments
7.2.20. Avenarius-Agro GmbH
7.2.20.1. Headquarters, Year of Establishment, Revenue, Key Management, Number of Employees
7.2.20.2. Company Description
7.2.20.3. Business Segments
7.2.20.4. End-user
7.2.20.5. Revenue (US$ Mn) and Y-o-Y Growth (%), 2015–2018
7.2.20.6. Breakdown of Revenue, by Geography, 2018
7.2.20.7. Breakdown of Net Sales, by Business Segment, 2018
7.2.20.8. Key Developments
7.2.21. Williams Hayward Protective Coatings, Inc.
7.2.21.1. Headquarters, Year of Establishment, Revenue, Key Management, Number of Employees
7.2.21.2. Company Description
7.2.21.3. Business Segments
7.2.21.4. End-user
7.2.21.5. Revenue (US$ Mn) and Y-o-Y Growth (%), 2015–2018
7.2.21.6. Breakdown of Revenue, by Geography, 2018
7.2.21.7. Breakdown of Net Sales, by Business Segment, 2018
7.2.21.8. Key Developments
7.2.22. Aalterpaint
7.2.22.1. Headquarters, Year of Establishment, Revenue, Key Management, Number of Employees
7.2.22.2. Company Description
7.2.22.3. Business Segments
7.2.22.4. End-user
7.2.22.5. Revenue (US$ Mn) and Y-o-Y Growth (%), 2015–2018
7.2.22.6. Breakdown of Revenue, by Geography, 2018
7.2.22.7. Breakdown of Net Sales, by Business Segment, 2018
7.2.22.8. Key Developments
7.2.23. Protective Paints
7.2.23.1. Headquarters, Year of Establishment, Revenue, Key Management, Number of Employees
7.2.23.2. Company Description
7.2.23.3. Business Segments
7.2.23.4. End-user
7.2.23.5. Revenue (US$ Mn) and Y-o-Y Growth (%), 2015–2018
7.2.23.6. Breakdown of Revenue, by Geography, 2018
7.2.23.7. Breakdown of Net Sales, by Business Segment, 2018
7.2.23.8. Key Developments
7.2.24. Colorlak, a.s.
7.2.24.1. Headquarters, Year of Establishment, Revenue, Key Management, Number of Employees
7.2.24.2. Company Description
7.2.24.3. Business Segments
7.2.24.4. End-user
7.2.24.5. Revenue (US$ Mn) and Y-o-Y Growth (%), 2015–2018
7.2.24.6. Breakdown of Revenue, by Geography, 2018
7.2.24.7. Breakdown of Net Sales, by Business Segment, 2018
7.2.24.8. Key Developments
7.2.25. Rembrandtin
7.2.25.1. Headquarters, Year of Establishment, Revenue, Key Management, Number of Employees
7.2.25.2. Company Description
7.2.25.3. Business Segments
7.2.25.4. End-user
7.2.25.5. Revenue (US$ Mn) and Y-o-Y Growth (%), 2015–2018
7.2.25.6. Breakdown of Revenue, by Geography, 2018
7.2.25.7. Breakdown of Net Sales, by Business Segment, 2018
7.2.25.8. Key Developments
7.2.26. Rudolf Hensel GmbH
7.2.26.1. Headquarters, Year of Establishment, Revenue, Key Management, Number of Employees
7.2.26.2. Company Description
7.2.26.3. Business Segments
7.2.26.4. End-user
7.2.26.5. Revenue (US$ Mn) and Y-o-Y Growth (%), 2015–2018
7.2.26.6. Breakdown of Revenue, by Geography, 2018
7.2.26.7. Breakdown of Net Sales, by Business Segment, 2018
7.2.26.8. Key Developments
7.2.27. Carboline
7.2.27.1. Headquarters, Year of Establishment, Revenue, Key Management, Number of Employees
7.2.27.2. Company Description
7.2.27.3. Business Segments
7.2.27.4. End-user
7.2.27.5. Revenue (US$ Mn) and Y-o-Y Growth (%), 2015–2018
7.2.27.6. Breakdown of Revenue, by Geography, 2018
7.2.27.7. Breakdown of Net Sales, by Business Segment, 2018
7.2.27.8. Key Developments
7.2.28. Winkelmann GmbH & Co. KG
7.2.28.1. Headquarters, Year of Establishment, Revenue, Key Management, Number of Employees
7.2.28.2. Company Description
7.2.28.3. Business Segments
7.2.28.4. End-user
7.2.28.5. Revenue (US$ Mn) and Y-o-Y Growth (%), 2015–2018
7.2.28.6. Breakdown of Revenue, by Geography, 2018
7.2.28.7. Breakdown of Net Sales, by Business Segment, 2018
7.2.28.8. Key Developments
7.2.29. Teknos Group
7.2.29.1. Headquarters, Year of Establishment, Revenue, Key Management, Number of Employees
7.2.29.2. Company Description
7.2.29.3. Business Segments
7.2.29.4. End-user
7.2.29.5. Revenue (US$ Mn) and Y-o-Y Growth (%), 2015–2018
7.2.29.6. Breakdown of Revenue, by Geography, 2018
7.2.29.7. Breakdown of Net Sales, by Business Segment, 2018
7.2.29.8. Key Developments
8. Primary Research – Key Insights
9. Assumptions and Research Methodology
9.1. Report Assumptions
9.2. Secondary Sources and Acronyms Used
9.3. Research Methodology
List of Tables
Table 01: Europe Waterborne Coatings Market Volume (Tons) Forecast, by Resin, 2018–2027
Table 02: Europe Waterborne Coatings Market Value (US$ Mn) Forecast, by Resin, 2018–2027
Table 03: Europe Waterborne Coatings Market Volume (Tons) Forecast, by End-user, 2018–2027
Table 04: Europe Waterborne Coatings Market Value (US$ Mn) Forecast, by End-user, 2018–2027
Table 05: Europe Waterborne Coatings Market Volume (Tons) Forecast, by Country and Sub-region, 201
Table 06: Europe Waterborne Coatings Market Value (US$ Mn) Forecast, by Country and Sub-region, 20
Table 07: Germany Waterborne Coatings Market Volume (Tons) Forecast, by Resin, 2018–2027
Table 08: Germany Waterborne Coatings Market Value (US$ Mn) Forecast, by Resin, 2018–2027
Table 09: Germany Waterborne Coatings Market Volume (Tons) Forecast, by End-user, 2018–2027
Table 10: Germany Waterborne Coatings Market Value (US$ Mn) Forecast, by End-user, 2018–2027
Table 11: France Waterborne Coatings Market Volume (Tons) Forecast, by Resin, 2018–2027
Table 12: France Waterborne Coatings Market Value (US$ Mn) Forecast, by Resin, 2018–2027
Table 13: France Waterborne Coatings Market Volume (Tons) Forecast, by End-user, 2018–2027
Table 14: France Waterborne Coatings Market Value (US$ Mn) Forecast, by End-user, 2018–2027
Table 15: U.K. Waterborne Coatings Market Volume (Tons) Forecast, by Resin, 2018–2027
Table 16: U.K. Waterborne Coatings Market Value (US$ Mn) Forecast, by Resin, 2018–2027
Table 17: U.K. Waterborne Coatings Market Volume (Tons) Forecast, by End-user, 2018–2027
Table 18: U.K. Waterborne Coatings Market Value (US$ Mn) Forecast, by End-user, 2018–2027
Table 19: Italy Waterborne Coatings Market Volume (Tons) Forecast, by Resin, 2018–2027
Table 20: Italy Waterborne Coatings Market Value (US$ Mn) Forecast, by Resin, 2018–2027
Table 21: Italy Waterborne Coatings Market Volume (Tons) Forecast, by End-user, 2018–2027
Table 22: Italy Waterborne Coatings Market Value (US$ Mn) Forecast, by End-user, 2018–2027
Table 23: Spain Waterborne Coatings Market Volume (Tons) Forecast, by Resin, 2018–2027
Table 24: Spain Waterborne Coatings Market Value (US$ Mn) Forecast, by Resin, 2018–2027
Table 25: Spain Waterborne Coatings Market Volume (Tons) Forecast, by End-user, 2018–2027
Table 26: Spain Waterborne Coatings Market Value (US$ Mn) Forecast, by End-user, 2018–2027
Table 27: Poland Waterborne Coatings Market Volume (Tons) Forecast, by Resin, 2018–2027
Table 28: Poland Waterborne Coatings Market Value (US$ Mn) Forecast, by Resin, 2018–2027
Table 29: Poland Waterborne Coatings Market Volume (Tons) Forecast, by End-user, 2018–2027
Table 30: Poland Waterborne Coatings Market Value (US$ Mn) Forecast, by End-user, 2018–2027
Table 31: Turkey Waterborne Coatings Market Volume (Tons) Forecast, by Resin, 2018–2027
Table 32: Turkey Waterborne Coatings Market Value (US$ Mn) Forecast, by Resin, 2018–2027
Table 33: Turkey Waterborne Coatings Market Volume (Tons) Forecast, by End-user, 2018–2027
Table 34: Turkey Waterborne Coatings Market Value (US$ Mn) Forecast, by End-user, 2018–2027
Table 35: Greece Waterborne Coatings Market Volume (Tons) Forecast, by Resin, 2018–2027
Table 36: Greece Waterborne Coatings Market Value (US$ Mn) Forecast, by Resin, 2018–2027
Table 37: Greece Waterborne Coatings Market Volume (Tons) Forecast, by End-user, 2018–2027
Table 38: Greece Waterborne Coatings Market Value (US$ Mn) Forecast, by End-user, 2018–2027
Table 39: Russia & CIS Waterborne Coatings Market Volume (Tons) Forecast, by Resin, 2018–2027
Table 40: Russia & CIS Waterborne Coatings Market Value (US$ Mn) Forecast, by Resin, 2018–2027
Table 41: Russia & CIS Waterborne Coatings Market Volume (Tons) Forecast, by End-user, 2018–2027
Table 42: Russia & CIS Waterborne Coatings Market Value (US$ Mn) Forecast, by End-user, 2018–2027
Table 43: Rest of Europe Waterborne Coatings Market Volume (Tons) Forecast, by Resin, 2018–2027
Table 44: Rest of Europe Waterborne Coatings Market Value (US$ Mn) Forecast, by Resin, 2018–2027
Table 45: Rest of Europe Waterborne Coatings Market Volume (Tons) Forecast, by End-user, 2018–2027
Table 46: Rest of Europe Waterborne Coatings Market Value (US$ Mn) Forecast, by End-user, 2018–202
Table 47: Africa Waterborne Coatings Market Volume (Tons) Forecast, by Resin, 2018–2027
Table 48: Africa Waterborne Coatings Market Value (US$ Mn) Forecast, by Resin, 2018–2027
Table 49: Africa Waterborne Coatings Market Volume (Tons) Forecast, by End-user, 2018–2027
Table 50: Africa Waterborne Coatings Market Value (US$ Mn) Forecast, by End-user, 2018–2027
Table 51: Africa Waterborne Coatings Market Volume (Tons) Forecast, by Country and Sub-region, 201
Table 52: Africa Waterborne Coatings Market Value (US$ Mn) Forecast, by Country and Sub-region, 20
Table 53: Nigeria Waterborne Coatings Market Volume (Tons) Forecast, by Resin, 2018–2027
Table 54: Nigeria Waterborne Coatings Market Value (US$ Mn) Forecast, by Resin, 2018–2027
Table 55: Nigeria Waterborne Coatings Market Volume (Tons) Forecast, by End-user, 2018–2027
Table 56: Nigeria Waterborne Coatings Market Value (US$ Mn) Forecast, by End-user, 2018–2027
Table 57: Egypt Waterborne Coatings Market Volume (Tons) Forecast, by Resin, 2018–2027
Table 58: Egypt Waterborne Coatings Market Value (US$ Mn) Forecast, by Resin, 2018–2027
Table 59: Egypt Waterborne Coatings Market Volume (Tons) Forecast, by End-user, 2018–2027
Table 60: Egypt Waterborne Coatings Market Value (US$ Mn) Forecast, by End-user, 2018–2027
Table 61: Morocco Waterborne Coatings Market Volume (Tons) Forecast, by Resin, 2018–2027
Table 62: Morocco Waterborne Coatings Market Value (US$ Mn) Forecast, by Resin, 2018–2027
Table 63: Morocco Waterborne Coatings Market Volume (Tons) Forecast, by End-user, 2018–2027
Table 64: Morocco Waterborne Coatings Market Value (US$ Mn) Forecast, by End-user, 2018–2027
Table 65: Rest of Africa Waterborne Coatings Market Volume (Tons) Forecast, by Resin, 2018–2027
Table 66: Rest of Africa Waterborne Coatings Market Value (US$ Mn) Forecast, by Resin, 2018–2027
Table 67: Rest of Africa Waterborne Coatings Market Volume (Tons) Forecast, by End-user, 2018–2027
Table 68: Rest of Africa Waterborne Coatings Market Value (US$ Mn) Forecast, by End-user, 2018–2027
List of Figures
Figure 01: Waterborne Coatings Pricing Analysis (US$/Ton), by Resin, Europe, 2018-2027
Figure 02: Waterborne Coatings Pricing Analysis (US$/Ton), by Resin, Africa, 2018-2027
Figure 03: Waterborne Coatings Pricing Analysis (US$/Ton), by Region, 2018-2027
Figure 04: Europe Waterborne Coatings Market Volume Share Analysis, by Resin, 2018, 2023, and 2027
Figure 05: Europe Waterborne Coatings Market Attractiveness Analysis, by Resin
Figure 06: Europe Waterborne Coatings Market Volume Share Analysis, by End-user, 2018, 2023, and 2027
Figure 07: Europe Waterborne Coatings Market Attractiveness Analysis, by End-user
Figure 08: Europe Waterborne Coatings Share Analysis, by Country and Sub-region, 2018 and 2027
Figure 09: Europe Waterborne Coatings Market Attractiveness Analysis, by Country and Sub-region
Figure 10: Africa Waterborne Coatings Market Volume Share Analysis, by Resin, 2018, 2023, and 2027
Figure 11: Africa Waterborne Coatings Market Attractiveness Analysis, by Resin
Figure 12: Africa Waterborne Coatings Market Volume Share Analysis, by End-user, 2018, 2023, and 2027
Figure 13: Africa Waterborne Coatings Market Attractiveness Analysis, by End-user
Figure 14: Africa Waterborne Coatings Share Analysis, by Country and Sub-region, 2018 and 20207
Figure 15: Africa Waterborne Coatings Market Attractiveness Analysis, by Country and Sub-region
Figure 16: Europe & Africa Waterborne Coatings Market Share Analysis, by Company, 2018
Copyright © Transparency Market Research, Inc. All Rights reserved
Trust Online

Europe and Africa Waterborne Coatings Market