
Reports
Reports
Analysts’ Viewpoint on Photoelectric Sensors Market Scenario
The photoelectric sensors market is driven due to its significant use in packaging, manufacturing, and material handling industries to perform various functions such as detection of transparent bottles, monitoring of object presence, monitoring of conveyor positioning, and control & detection of wafers in a vacuum conveyor system. These sensors help to enhance productivity, decrease process time, and increase operational efficiency. Companies operating in the photoelectric sensors market are focusing on high-growth applications such as automatic doors and logistic & material handling in order to grow their business post the COVID-19 pandemic. Consequently, the market is expected to grow at a favorable CAGR during the forecast period, owing to the numerous advantages offered by photoelectric sensors such as very fast response time, low price, long sensing range, and high reliability.
Photoelectric sensors are used to detect the presence or absence of particular objects, based on optical sensing, which has created new demand for photoelectric sensors due to the increasing trend toward robotics and industrial automation.
Photoelectric technologies are being extended to consumer electronics, automobile electrification, and med-tech devices to broaden revenue streams. An increase in R&D is helping companies to innovate in laser light sensors and optical sensors.
In the food and beverage (F&B) industry, hygiene is a top priority because pollutants, such as bacteria, and other harmful substances might cause unwanted issues in the daily work processes and the product being manufactured.
Manufacturers in the food & beverage industry take extra precautions to package food to maintain cleanliness and hygiene, and this can be done by using photoelectric sensors, as they help detect the presence or absence of objects.
The food and beverages industry focuses on different parameters such as tracking and tracing, controlling the quality of products, and confirming their safety while carrying out their packaging. This, in turn, increases the demand for photoelectric sensors to carry out accurate position sensing of loaded carts, monitor crates on conveyor belts, and confirm the maintenance of a hygienic environment.
A rise in demand for packaging solutions in the food & beverage industry has led to an increase in the adoption of photoelectric sensors, which in turn has boosted the demand for smart photoelectric sensors in production facilities.
Photoelectric sensors are also employed in manufacturing and packaging lines in the food & beverage industry. For instance, the bottles must be correctly aligned and positioned for each bottle cap to fit properly. A photoelectric sensor detects an error in the positioning of the bottle and helps in the smooth running of the manufacturing plant. This drives the demand for photoelectric sensors in the food and beverage industry.
For instance, a miniature photoelectric sensor is used in a food processing plant to individually package cheese portions. This helps ascertain that cheese portions are consistent in size.
Rising automation in the manufacturing sector across the globe has meant that industrial sensors are playing a key role in increasing both safety and productivity.
Photoelectric sensors enable machine designers to monitor, measure, and control machine functions rapidly and precisely. High-technology sensors become the eye of the machine and gather the specific inputs required to control its function. This becomes much more important in automated assembly lines.
Several industries such as automotive, electronics, metal, and medical engineering can be identified as the driving force behind handling and assembly technology. They rely heavily on automated handling & assembly processes that contribute to high quality and accuracy & improve productivity. These trends are fueling innovations in proximity and displacement sensors.
Photoelectric sensors are also used in robots, which help improve object and position sensing in order to deliver safe and efficient operations in various industrial processes such as packaging, material handling, and logistics.
The photoelectric sensor becomes a popular choice in automation because it provides rapid and reliable results even without touching the object. This also boosts the demand for photoelectric sensor technologies. As such, manufacturers are increasing production for light sensors that are gaining prominence in automation applications.
In terms of configuration, the global photoelectric sensors market can be segregated into sensors with separate amplifiers, built-in amplifier sensors, sensors with built-in power supplies, and area sensors. The built-in amplifier sensors segment dominated the global photoelectric sensors market.
Extensive use of built-in amplifier photoelectric sensors in ICs and wafer detection applications in the semiconductor manufacturing process has contributed to the expansion of the built-in amplifier sensor configuration segment. Additionally, these sensors are utilized for the reliable detection of long-range objects, and they have the ability to detect transparent objects. This further drives the photoelectric sensors market. As such, new designs in photoelectric sensors are gaining prominence in flexible printed circuit boards. On the other hand, brake oil aftermarket for off-highway vehicles holds lucrative revenue opportunities for market players.
In terms of application, the photoelectric sensors market has been classified into conveyors, logistic and material handling, automatic doors, industrial automation, and elevators. The automatic doors segment dominated the global photoelectric sensors market. Automatic doors help reduce energy consumption by checking automatically closing doors that are being left open.
The automatic door provides barrier-free access that helps in manual opening and closing operations. Increasing installations of automatic doors at shopping malls, corporate offices, hotels, and hospitals are boosting the automation doors segment of the photoelectric sensors market. Burgeoning growth of commercial building automation is translating into revenue opportunities for semiconductor companies. Since photoelectric receivers are an important part of photoelectric sensors, companies are increasing the manufacturing of color sensors, contrast sensors, and luminescence sensors to broaden their revenue streams.
The Asia Pacific dominated the global photoelectric sensors market because of the growing inclination toward automation and industrial robots in China, South Korea, and Japan. Growing support from governments has positively prompted regional manufacturers to integrate Internet of things (IoT)-based machines and robots in their factories. Moreover, increasing adoption of industrial robotics is also projected to boost the photoelectric sensors market in the Asia Pacific.
Increasing adoption of Industry 4.0 and Internet of Things (IoT) solutions is likely to fuel the demand for smart photoelectric sensors, primarily from factory automation, as it enables machines and equipment to be utilized at greater efficiency.
The global photoelectric sensors market is consolidated with a small number of large-scale vendors controlling the majority of the market share. Diversification of product portfolios and mergers & acquisitions are important strategies adopted by key players. Autonics Corporation, Balluff (Thailand) Ltd, Baumer Group, Eaton Corporation PLC, ifm electronic gmbh, Keyence Corporation, Omron Corporation, Panasonic Industry Co., Ltd., Rockwell Automation Inc., Schneider Electric SE, SICK AG are the prominent entities operating in the market.
Each of these players has been profiled in the photoelectric sensors market report based on parameters such as company overview, financial overview, business strategies, product portfolio, business segments, and recent developments.
|
Attribute |
Detail |
|
Market Size Value in 2021 |
US$ 1.6 Bn |
|
Market Forecast Value in 2031 |
US$ 3.4 Bn |
|
Growth Rate (CAGR) |
7.6% |
|
Forecast Period |
2022–2031 |
|
Historical Data Available for |
2017–2020 |
|
Quantitative Units |
US$ Bn for Value and Million for Volume |
|
Market Analysis |
It includes cross segment analysis at global as well as regional level. Furthermore, qualitative analysis includes drivers, restraints, opportunities, key trends, Porter’s Five Forces analysis, value chain analysis, and key trend analysis. |
|
Competition Landscape |
|
|
Format |
Electronic (PDF) + Excel |
|
Market Segmentation |
|
|
Regions Covered |
|
|
Countries Covered |
|
|
Companies Profiled |
|
|
Customization Scope |
Available upon request |
|
Pricing |
Available upon request |
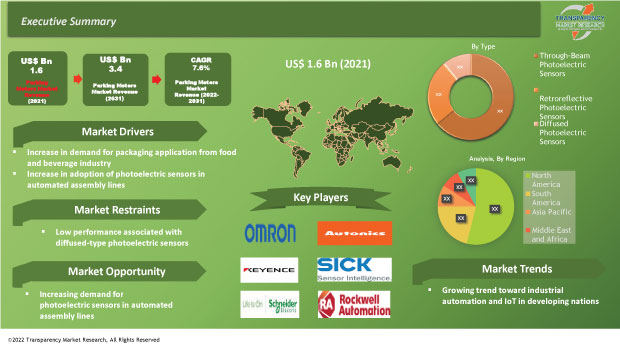
The market size of photoelectric sensors stood over US$ 1.6 Bn in 2021.
The photoelectric sensors market is expected to grow at a CAGR of 7.6% from 2022 to 2031.
Increase in demand for photoelectric sensors for packaging applications in the food & beverage industry and rise in usage of photoelectric sensors in automated assembly lines are key factors driving the photoelectric sensors market.
The automotive segment accounted for major share of 28% of the photoelectric sensors market in 2021.
Asia Pacific is a more attractive region for vendors in the photoelectric sensors market.
Key players operating in the photoelectric sensors market include Autonics Corporation, Balluff (Thailand) Ltd, Baumer Group, Eaton Corporation PLC, ifm electronic gmbh, Keyence Corporation, Omron Corporation, Panasonic Industry Co., Ltd., Rockwell Automation Inc., Schneider Electric SE, and SICK AG.
1. Preface
1.1. Market Introduction
1.2. Market and Segments Definition
1.3. Market Taxonomy
1.4. Research Methodology
1.5. Assumption and Acronyms
2. Executive Summary
2.1. Global Photoelectric Sensors Market Overview
2.2. Regional Outline
2.3. Industry Outline
2.4. Market Dynamics Snapshot
2.5. Competition Blueprint
3. Market Dynamics
3.1. Macro-economic Factors
3.2. Drivers
3.3. Restraints
3.4. Opportunities
3.5. Key Trends
3.6. Regulatory Framework
4. Associated Industry and Key Indicator Assessment
4.1. Parent Industry Overview – Global Sensors Industry Overview
4.2. Supply Chain Analysis
4.3. Pricing Analysis
4.4. Technology Roadmap Analysis
4.5. Industry SWOT Analysis
4.6. Porter Five Forces Analysis
4.7. Covid-19 Impact and Recovery Analysis
5. Photoelectric Sensors Market Analysis, by Type
5.1. Photoelectric Sensors Market Value (US$ Mn) and Volume (Million Units) Analysis & Forecast, by Type, 2017–2031
5.1.1. Through-Beam Photoelectric Sensors
5.1.2. Retroreflective Photoelectric Sensors
5.1.3. Diffused Photoelectric Sensors
5.2. Market Attractiveness Analysis, By Type
6. Photoelectric Sensors Market Analysis, by Range
6.1. Photoelectric Sensors Market Value (US$ Mn) Analysis & Forecast, by Range, 2017–2031
6.1.1. Up to 100 mm
6.1.2. 100 to 1,000 mm
6.1.3. Above 1,000 mm
6.2. Market Attractiveness Analysis, By Range
7. Photoelectric Sensors Market Analysis, by Configuration
7.1. Photoelectric Sensors Market Value (US$ Mn) Analysis & Forecast, by Configuration, 2017–2031
7.1.1. Sensors with Separate Amplifiers
7.1.2. Built-in Amplifier Sensors
7.1.3. Sensors with Built-in Power Supplies
7.1.4. Area Sensors
7.2. Market Attractiveness Analysis, By Configuration
8. Photoelectric Sensors Market Analysis, by Application
8.1. Photoelectric Sensors Market Value (US$ Mn) Analysis & Forecast, by Application, 2017–2031
8.1.1. Conveyors
8.1.2. Liquid Crystal Displays
8.1.3. Logistics and Materials Handling
8.1.4. Automatic doors
8.1.5. Industrial Automation
8.1.6. Elevators
8.1.7. Others (Track Packaging, Robotic Pickers, etc.)
8.2. Market Attractiveness Analysis, By Application
9. Photoelectric Sensors Market Analysis, by End-use Industry
9.1. Photoelectric Sensors Market Value (US$ Mn) Analysis & Forecast, by End-use Industry, 2017–2031
9.1.1. Consumer Electronic
9.1.2. Automotive and Transportation
9.1.3. Healthcare
9.1.4. Industrial
9.1.5. Food & Beverage
9.1.6. Others (Chemicals, Building and Construction, etc.)
9.2. Market Attractiveness Analysis, By End-use Industry
10. Photoelectric Sensors Market Analysis and Forecast, by Region
10.1. Photoelectric Sensors Market Value (US$ Mn) and Volume (Million Units) Analysis & Forecast, by Region, 2017–2031
10.1.1. North America
10.1.2. Europe
10.1.3. Asia Pacific
10.1.4. Middle East & Africa
10.1.5. South America
10.2. Market Attractiveness Analysis, By Region
11. North America Photoelectric Sensors Market Analysis and Forecast
11.1. Market Snapshot
11.2. Drivers and Restraints: Impact Analysis
11.3. Photoelectric Sensors Market Value (US$ Mn) and Volume (Million Units) Analysis & Forecast, by Type, 2017–2031
11.3.1. Through-Beam Photoelectric Sensors
11.3.2. Retroreflective Photoelectric Sensors
11.3.3. Diffused Photoelectric Sensors
11.4. Photoelectric Sensors Market Value (US$ Mn) Analysis & Forecast, by Range, 2017–2031
11.4.1. Up to 100 mm
11.4.2. 100 to 1,000 mm
11.4.3. Above 1,000 mm
11.5. Photoelectric Sensors Market Value (US$ Mn) Analysis & Forecast, by Configuration, 2017–2031
11.5.1. Sensors with Separate Amplifiers
11.5.2. Built-in Amplifier Sensors
11.5.3. Sensors with Built-in Power Supplies
11.5.4. Area Sensors
11.6. Photoelectric Sensors Market Value (US$ Mn) Analysis & Forecast, by Application, 2017–2031
11.6.1. Conveyors
11.6.2. Liquid Crystal Displays
11.6.3. Logistics and Materials Handling
11.6.4. Automatic doors
11.6.5. Industrial Automation
11.6.6. Elevators
11.6.7. Others
11.7. Photoelectric Sensors Market Value (US$ Mn) Analysis & Forecast, by End-use Industry, 2017–2031
11.7.1. Consumer Electronic
11.7.2. Automotive and Transportation
11.7.3. Healthcare
11.7.4. Industrial
11.7.5. Food & Beverage
11.7.6. Others
11.8. Photoelectric Sensors Market Value (US$ Mn) and Volume (Million Units) Analysis & Forecast, by Country and Sub-region, 2017–2031
11.8.1. The U.S.
11.8.2. Canada
11.8.3. Rest of North America
11.9. Market Attractiveness Analysis
11.9.1. By Type
11.9.2. By Range
11.9.3. By Configuration
11.9.4. By Application
11.9.5. By End-use Industry
11.9.6. By Country/Sub-region
12. Europe Photoelectric Sensors Market Analysis and Forecast
12.1. Market Snapshot
12.2. Drivers and Restraints: Impact Analysis
12.3. Photoelectric Sensors Market Value (US$ Mn) and Volume (Million Units) Analysis & Forecast, by Type, 2017–2031
12.3.1. Through-Beam Photoelectric Sensors
12.3.2. Retroreflective Photoelectric Sensors
12.3.3. Diffused Photoelectric Sensors
12.4. Photoelectric Sensors Market Value (US$ Mn) Analysis & Forecast, by Range, 2017–2031
12.4.1. Up to 100 mm
12.4.2. 100 to 1,000 mm
12.4.3. Above 1,000 mm
12.5. Photoelectric Sensors Market Value (US$ Mn) Analysis & Forecast, by Configuration, 2017–2031
12.5.1. Sensors with Separate Amplifiers
12.5.2. Built-in Amplifier Sensors
12.5.3. Sensors with Built-in Power Supplies
12.5.4. Area Sensors
12.6. Photoelectric Sensors Market Value (US$ Mn) Analysis & Forecast, by Application, 2017–2031
12.6.1. Conveyors
12.6.2. Liquid Crystal Displays
12.6.3. Logistics and Materials Handling
12.6.4. Automatic doors
12.6.5. Industrial Automation
12.6.6. Elevators
12.6.7. Others
12.7. Photoelectric Sensors Market Value (US$ Mn) Analysis & Forecast, by End-use Industry, 2017–2031
12.7.1. Consumer Electronic
12.7.2. Automotive and Transportation
12.7.3. Healthcare
12.7.4. Industrial
12.7.5. Food & Beverage
12.7.6. Others
12.8. Photoelectric Sensors Market Value (US$ Mn) and Volume (Million Units) Analysis & Forecast, by Country and Sub-region, 2017–2031
12.8.1. The U.K.
12.8.2. Germany
12.8.3. France
12.8.4. Rest of Europe
12.9. Market Attractiveness Analysis
12.9.1. By Type
12.9.2. By Range
12.9.3. By Configuration
12.9.4. By Application
12.9.5. By End-use Industry
12.9.6. By Country/Sub-region
13. Asia Pacific Photoelectric Sensors Market Analysis and Forecast
13.1. Market Snapshot
13.2. Drivers and Restraints: Impact Analysis
13.3. Photoelectric Sensors Market Value (US$ Mn) and Volume (Million Units) Analysis & Forecast, by Type, 2017–2031
13.3.1. Through-Beam Photoelectric Sensors
13.3.2. Retroreflective Photoelectric Sensors
13.3.3. Diffused Photoelectric Sensors
13.4. Photoelectric Sensors Market Value (US$ Mn) Analysis & Forecast, by Range, 2017–2031
13.4.1. Up to 100 mm
13.4.2. 100 to 1,000 mm
13.4.3. Above 1,000 mm
13.5. Photoelectric Sensors Market Value (US$ Mn) Analysis & Forecast, by Configuration, 2017–2031
13.5.1. Sensors with Separate Amplifiers
13.5.2. Built-in Amplifier Sensors
13.5.3. Sensors with Built-in Power Supplies
13.5.4. Area Sensors
13.6. Photoelectric Sensors Market Value (US$ Mn) Analysis & Forecast, by Application, 2017–2031
13.6.1. Conveyors
13.6.2. Liquid Crystal Displays
13.6.3. Logistics and Materials Handling
13.6.4. Automatic doors
13.6.5. Industrial Automation
13.6.6. Elevators
13.6.7. Others
13.7. Photoelectric Sensors Market Value (US$ Mn) Analysis & Forecast, by End-use Industry, 2017–2031
13.7.1. Consumer Electronic
13.7.2. Automotive and Transportation
13.7.3. Healthcare
13.7.4. Industrial
13.7.5. Food & Beverage
13.7.6. Others
13.8. Photoelectric Sensors Market Value (US$ Mn) and Volume (Million Units) Analysis & Forecast, by Country and Sub-region, 2017–2031
13.8.1. China
13.8.2. India
13.8.3. Japan
13.8.4. South Korea
13.8.5. ASEAN
13.8.6. Rest of Asia Pacific
13.9. Market Attractiveness Analysis
13.9.1. By Type
13.9.2. By Range
13.9.3. By Configuration
13.9.4. By Application
13.9.5. By End-use Industry
13.9.6. By Country/Sub-region
14. Middle East and Africa Photoelectric Sensors Market Analysis and Forecast
14.1. Market Snapshot
14.2. Drivers and Restraints: Impact Analysis
14.3. Photoelectric Sensors Market Value (US$ Mn) and Volume (Million Units) Analysis & Forecast, by Type, 2017–2031
14.3.1. Through-Beam Photoelectric Sensors
14.3.2. Retroreflective Photoelectric Sensors
14.3.3. Diffused Photoelectric Sensors
14.4. Photoelectric Sensors Market Value (US$ Mn) Analysis & Forecast, by Range, 2017–2031
14.4.1. Up to 100 mm
14.4.2. 100 to 1,000 mm
14.4.3. Above 1,000 mm
14.5. Photoelectric Sensors Market Value (US$ Mn) Analysis & Forecast, by Configuration, 2017–2031
14.5.1. Sensors with Separate Amplifiers
14.5.2. Built-in Amplifier Sensors
14.5.3. Sensors with Built-in Power Supplies
14.5.4. Area Sensors
14.6. Photoelectric Sensors Market Value (US$ Mn) Analysis & Forecast, by Application, 2017–2031
14.6.1. Conveyors
14.6.2. Liquid Crystal Displays
14.6.3. Logistics and Materials Handling
14.6.4. Automatic doors
14.6.5. Industrial Automation
14.6.6. Elevators
14.6.7. Others
14.7. Photoelectric Sensors Market Value (US$ Mn) Analysis & Forecast, by End-use Industry, 2017–2031
14.7.1. Consumer Electronic
14.7.2. Automotive and Transportation
14.7.3. Healthcare
14.7.4. Industrial
14.7.5. Food & Beverage
14.7.6. Others
14.8. Photoelectric Sensors Market Value (US$ Mn) and Volume (Million Units) Analysis & Forecast, By Country and Sub-region, 2017–2031
14.8.1. GCC
14.8.2. South Africa
14.8.3. Rest of the Middle East and Africa
14.9. Market Attractiveness Analysis
14.9.1. By Type
14.9.2. By Range
14.9.3. By Configuration
14.9.4. By Application
14.9.5. By End-use Industry
14.9.6. By Country/Sub-region
15. South America Photoelectric Sensors Market Analysis and Forecast
15.1. Market Snapshot
15.2. Drivers and Restraints: Impact Analysis
15.3. Photoelectric Sensors Market Value (US$ Mn) and Volume (Million Units) Analysis & Forecast, By Type, 2017–2031
15.3.1. Through-Beam Photoelectric Sensors
15.3.2. Retroreflective Photoelectric Sensors
15.3.3. Diffused Photoelectric Sensors
15.4. Photoelectric Sensors Market Value (US$ Mn) Analysis & Forecast, by Range, 2017–2031
15.4.1. Up to 100 mm
15.4.2. 100 to 1,000 mm
15.4.3. Above 1,000 mm
15.5. Photoelectric Sensors Market Value (US$ Mn) Analysis & Forecast, by Configuration, 2017–2031
15.5.1. Sensors with Separate Amplifiers
15.5.2. Built-in Amplifier Sensors
15.5.3. Sensors with Built-in Power Supplies
15.5.4. Area Sensors
15.6. Photoelectric Sensors Market Value (US$ Mn) Analysis & Forecast, by Application, 2017–2031
15.6.1. Conveyors
15.6.2. Liquid Crystal Displays
15.6.3. Logistics and Materials Handling
15.6.4. Automatic doors
15.6.5. Industrial Automation
15.6.6. Elevators
15.6.7. Others
15.7. Photoelectric Sensors Market Value (US$ Mn) Analysis & Forecast, by End-use Industry, 2017–2031
15.7.1. Consumer Electronic
15.7.2. Automotive and Transportation
15.7.3. Healthcare
15.7.4. Industrial
15.7.5. Food & Beverage
15.7.6. Others
15.8. Photoelectric Sensors Market Value (US$ Mn) and Volume (Million Units) Analysis & Forecast, By Country and Sub-region, 2017–2031
15.8.1. Brazil
15.8.2. Rest of South America
15.9. Market Attractiveness Analysis
15.9.1. By Type
15.9.2. By Range
15.9.3. By Configuration
15.9.4. By Application
15.9.5. By End-use Industry
15.9.6. By Country/Sub-region
16. Competition Assessment
16.1. Global Photoelectric Sensors Market Competition Matrix - a Dashboard View
16.1.1. Global Photoelectric Sensors Market Company Share Analysis, by Value (2021)
16.1.2. Technological Differentiator
17. Company Profiles (Global Manufacturers/Suppliers)
17.1. Autonics Corporation
17.1.1. Overview
17.1.2. Product Portfolio
17.1.3. Sales Footprint
17.1.4. Key Subsidiaries or Distributors
17.1.5. Strategy and Recent Developments
17.1.6. Key Financials
17.2. Balluff (Thailand) Ltd
17.2.1. Overview
17.2.2. Product Portfolio
17.2.3. Sales Footprint
17.2.4. Key Subsidiaries or Distributors
17.2.5. Strategy and Recent Developments
17.2.6. Key Financials
17.3. Baumer Group
17.3.1. Overview
17.3.2. Product Portfolio
17.3.3. Sales Footprint
17.3.4. Key Subsidiaries or Distributors
17.3.5. Strategy and Recent Developments
17.3.6. Key Financials
17.4. Eaton Corporation PLC
17.4.1. Overview
17.4.2. Product Portfolio
17.4.3. Sales Footprint
17.4.4. Key Subsidiaries or Distributors
17.4.5. Strategy and Recent Developments
17.4.6. Key Financials
17.5. ifm electronic gmbh
17.5.1. Overview
17.5.2. Product Portfolio
17.5.3. Sales Footprint
17.5.4. Key Subsidiaries or Distributors
17.5.5. Strategy and Recent Developments
17.5.6. Key Financials
17.6. Omron Corporation
17.6.1. Overview
17.6.2. Product Portfolio
17.6.3. Sales Footprint
17.6.4. Key Subsidiaries or Distributors
17.6.5. Strategy and Recent Developments
17.6.6. Key Financials
17.7. Panasonic Industry Co., Ltd.
17.7.1. Overview
17.7.2. Product Portfolio
17.7.3. Sales Footprint
17.7.4. Key Subsidiaries or Distributors
17.7.5. Strategy and Recent Developments
17.7.6. Key Financials
17.8. Rockwell Automation Inc.
17.8.1. Overview
17.8.2. Product Portfolio
17.8.3. Sales Footprint
17.8.4. Key Subsidiaries or Distributors
17.8.5. Strategy and Recent Developments
17.8.6. Key Financials
17.9. Schneider Electric SE
17.9.1. Overview
17.9.2. Product Portfolio
17.9.3. Sales Footprint
17.9.4. Key Subsidiaries or Distributors
17.9.5. Strategy and Recent Developments
17.9.6. Key Financials
17.10. SICK AG
17.10.1. Overview
17.10.2. Product Portfolio
17.10.3. Sales Footprint
17.10.4. Key Subsidiaries or Distributors
17.10.5. Strategy and Recent Developments
17.10.6. Key Financials
17.11. Omron Corporation
17.11.1. Overview
17.11.2. Product Portfolio
17.11.3. Sales Footprint
17.11.4. Key Subsidiaries or Distributors
17.11.5. Strategy and Recent Developments
17.11.6. Key Financials
18. Recommendation
18.1. Opportunity Assessment
18.1.1. By Type
18.1.2. By Range
18.1.3. By Configuration
18.1.4. By Application
18.1.5. By End-use Industry
18.1.6. By Region
19. Primary Research: Key Insights
20. Appendix
List of Tables
Table 01: Global Photoelectric Sensors Market Size & Forecast, by Type, Value (US$ Mn), 2017‒2031
Table 02: Global Photoelectric Sensors Market Size & Forecast, by Type, Volume (Million Units), 2017‒2031
Table 03: Global Photoelectric Sensors Market Size & Forecast, by Range, Value (US$ Mn), 2017‒2031
Table 04: Global Photoelectric Sensors Market Size & Forecast, by Configuration, Value (US$ Mn), 2017‒2031
Table 05: Global Photoelectric Sensors Market Size & Forecast, by Application, Value (US$ Mn), 2017‒2031
Table 06: Global Photoelectric Sensors Market Size & Forecast, by End-use industry, Value (US$ Mn), 2017‒2031
Table 07: Global Photoelectric Sensors Market Size & Forecast, by Region, Value (US$ Mn), 2017‒2031
Table 08: Global Photoelectric Sensors Market Size & Forecast, by Region, Volume (Million Units), 2017‒2031
Table 09: North America Photoelectric Sensors Market Size & Forecast, by Type, Value (US$ Mn), 2017‒2031
Table 10: North America Photoelectric Sensors Market Size & Forecast, by Type, Volume (Million Units), 2017‒2031
Table 11: North America Photoelectric Sensors Market Size & Forecast, by Range, Value (US$ Mn), 2017‒2031
Table 12: North America Photoelectric Sensors Market Size & Forecast, by Configuration, Value (US$ Mn), 2017‒2031
Table 13: North America Photoelectric Sensors Market Size & Forecast, by Application, Value (US$ Mn), 2017‒2031
Table 14: North America Photoelectric Sensors Market Size & Forecast, by End-use industry, Value (US$ Mn), 2017‒2031
Table 15: North America Photoelectric Sensors Market Size & Forecast, by Country & Sub-region, Value (US$ Mn), 2017‒2031
Table 16: North America Photoelectric Sensors Market Size & Forecast, by Country & Sub-region, Volume (Million Units), 2017‒2031
Table 17: Europe Photoelectric Sensors Market Size & Forecast, by Type, Value (US$ Mn), 2017‒2031
Table 18: Europe Photoelectric Sensors Market Size & Forecast, by Type, Volume (Million Units), 2017‒2031
Table 19: Europe Photoelectric Sensors Market Size & Forecast, by Range, Value (US$ Mn), 2017‒2031
Table 20: Europe Photoelectric Sensors Market Size & Forecast, by Configuration, Value (US$ Mn), 2017‒2031
Table 21: Europe Photoelectric Sensors Market Size & Forecast, by Application, Value (US$ Mn), 2017‒2031
Table 22: Europe Photoelectric Sensors Market Size & Forecast, by End-use industry, Value (US$ Mn), 2017‒2031
Table 23: Europe Photoelectric Sensors Market Size & Forecast, by Country & Sub-region, Value (US$ Mn), 2017‒2031
Table 24: Europe Photoelectric Sensors Market Size & Forecast, by Country & Sub-region, Volume (Million Units), 2017‒2031
Table 25: Asia Pacific Photoelectric Sensors Market Size & Forecast, by Type, Value (US$ Mn), 2017‒2031
Table 26: Asia Pacific Photoelectric Sensors Market Size & Forecast, by Type, Volume (Million Units), 2017‒2031
Table 27: Asia Pacific Photoelectric Sensors Market Size & Forecast, by Range, Value (US$ Mn), 2017‒2031
Table 28: Asia Pacific Photoelectric Sensors Market Size & Forecast, by Configuration, Value (US$ Mn), 2017‒2031
Table 29: Asia Pacific Photoelectric Sensors Market Size & Forecast, by Application, Value (US$ Mn), 2017‒2031
Table 30: Asia Pacific Photoelectric Sensors Market Size & Forecast, by Country & Sub-region, Value (US$ Mn), 2017‒2031
Table 31: Asia Pacific Photoelectric Sensors Market Size & Forecast, by Country & Sub-region, Volume (Million Units), 2017‒2031
Table 32: Middle East & Africa Photoelectric Sensors Market Size & Forecast, by Type, Value (US$ Mn), 2017‒2031
Table 33: Middle East & Africa Photoelectric Sensors Market Size & Forecast, by Type, Volume (Million Units), 2017‒2031
Table 34: Middle East & Africa Photoelectric Sensors Market Size & Forecast, by Range, Value (US$ Mn), 2017‒2031
Table 35: Middle East & Africa Photoelectric Sensors Market Size & Forecast, by Configuration, Value (US$ Mn), 2017‒2031
Table 36: Middle East & Africa Photoelectric Sensors Market Size & Forecast, by Application, Value (US$ Mn), 2017‒2031
Table 37: Middle East & Africa Photoelectric Sensors Market Size & Forecast, by End-use industry, Value (US$ Mn), 2017‒2031
Table 38: Middle East & Africa Photoelectric Sensors Market Size & Forecast, by Country & Sub-region, Value (US$ Mn), 2017‒2031
Table 39: Middle East & Africa Photoelectric Sensors Market Size & Forecast, by Country & Sub-region, Volume (Million Units), 2017‒2031
Table 40: South America Photoelectric Sensors Market Size & Forecast, by Type, Value (US$ Mn), 2017‒2031
Table 41: South America Photoelectric Sensors Market Size & Forecast, by Type, Volume (Million Units), 2017‒2031
Table 42: South America Photoelectric Sensors Market Size & Forecast, by Range, Value (US$ Mn), 2017‒2031
Table 43: South America Photoelectric Sensors Market Size & Forecast, by Configuration, Value (US$ Mn), 2017‒2031
Table 44: South America Photoelectric Sensors Market Size & Forecast, by Application, Value (US$ Mn), 2017‒2031
Table 45: South America Photoelectric Sensors Market Size & Forecast, by End-use industry, Value (US$ Mn), 2017‒2031
Table 46: South America Photoelectric Sensors Market Size & Forecast, by Country & Sub-region, Value (US$ Mn), 2017‒2031
Table 47: South America Photoelectric Sensors Market Size & Forecast, by Country & Sub-region, Volume (Million Units), 2017‒2031
List of Figures
Figure 01: Global Photoelectric Sensor Price Trend Analysis (Average Price, US$)
Figure 02: Global Photoelectric Sensor Market, Value (US$ Mn), 2017‒2031
Figure 03: Global Photoelectric Sensor Market, Value (US$ Mn), 2017‒2031
Figure 04: Global Photoelectric Sensor Market, Volume (Million Units), 2017‒2031
Figure 05: Global Photoelectric Sensor Market, Volume (Million Units), 2017‒2031
Figure 06: Global Photoelectric Sensor Market Size & Forecast, by Type, Value (US$ Mn), 2017‒2031
Figure 07: Global Photoelectric Sensor Market Attractiveness, by Type, Value (US$ Mn), 2022‒2031
Figure 08: Global Photoelectric Sensor Market Size & Forecast, by Type, Value (US$ Mn), 2022‒2031
Figure 09: Global Photoelectric Sensor Market Size & Forecast, by Range, Value (US$ Mn), 2017‒2031
Figure 10: Global Photoelectric Sensor Market Attractiveness, by Range, Value (US$ Mn), 2022‒2031
Figure 11: Global Photoelectric Sensor Market Size & Forecast, by Range, Value (US$ Mn), 2022‒2031
Figure 12: Global Photoelectric Sensor Market Size & Forecast, by Configuration, Value (US$ Mn), 2017‒2031
Figure 13: Global Photoelectric Sensor Market Attractiveness, by Configuration, Value (US$ Mn), 2022‒2031
Figure 14: Global Photoelectric Sensor Market Size & Forecast, by Configuration, Value (US$ Mn), 2017‒2031
Figure 12: Global Photoelectric Sensor Market Size & Forecast, by Application, Value (US$ Mn), 2017‒2031
Figure 13: Global Photoelectric Sensor Market Attractiveness, by Application, Value (US$ Mn), 2022‒2031
Figure 14: Global Photoelectric Sensor Market Size & Forecast, by Application, Value (US$ Mn), 2017‒2031
Figure 15: Global Photoelectric Sensor Market Attractiveness, by End-use industry, Value (US$ Mn), 2022‒2031
Figure 16: Global Photoelectric Sensor Market Attractiveness, by End-use industry, Value (US$ Mn), 2022‒2031
Figure 17: Global Photoelectric Sensor Market Size & Forecast, by End-use industry, Value (US$ Mn), 2022‒2031
Figure 18: Global Photoelectric Sensor Market Size & Forecast, by Region, Value (US$ Mn), 2022‒2031
Figure 19: Global Photoelectric Sensor Market Size & Forecast, by Region, Value (US$ Mn), 2022‒2031
Figure 20: Global Photoelectric Sensor Market Size & Forecast, by Region, Value (US$ Mn), 2022‒2031
Figure 21: North America Photoelectric Sensor Market Size & Forecast, by Region, Value (US$ Mn), 2022‒2031
Figure 22: North America Photoelectric Sensor Market, Value (US$ Mn), 2017‒2031
Figure 23: North America Photoelectric Sensor Market, Volume (Million Units), 2017‒2031
Figure 24: North America Photoelectric Sensor Market, Volume (Million Units), 2017‒2031
Figure 25: North America Photoelectric Sensor Market Size & Forecast, by Type, Value (US$ Mn), 2017‒2031
Figure 26: North America Photoelectric Sensor Market Attractiveness, by Type, Value (US$ Mn), 2022‒2031
Figure 27: North America Photoelectric Sensor Market Size & Forecast, by Type, Value (US$ Mn), 2022‒2031
Figure 28: North America Photoelectric Sensor Market Size & Forecast, by Range, Value (US$ Mn), 2017‒2031
Figure 29: North America Photoelectric Sensor Market Attractiveness, by Range, Value (US$ Mn), 2022‒2031
Figure 30: North America Photoelectric Sensor Market Size & Forecast, by Range, Value (US$ Mn), 2022‒2031
Figure 31: North America Photoelectric Sensor Market Size & Forecast, by Configuration, Value (US$ Mn), 2017‒2031
Figure 32: North America Photoelectric Sensor Market Attractiveness, by Configuration, Value (US$ Mn), 2022‒2031
Figure 33: North America Photoelectric Sensor Market Size & Forecast, by Configuration, Value (US$ Mn), 2017‒2031
Figure 34: North America Photoelectric Sensor Market Size & Forecast, by Application, Value (US$ Mn), 2017‒2031
Figure 35: North America Photoelectric Sensor Market Attractiveness, by Application, Value (US$ Mn), 2022‒2031
Figure 36: North America Photoelectric Sensor Market Size & Forecast, by Application, Value (US$ Mn), 2017‒2031
Figure 37: North America Photoelectric Sensor Market Size & Forecast, by End-use industry, Value (US$ Mn), 2017‒2031
Figure 38: North America Photoelectric Sensor Market Attractiveness, by End-use industry, Value (US$ Mn), 2022‒2031
Figure 39: North America Photoelectric Sensor Market Size & Forecast, by End-use industry, Value (US$ Mn), 2022‒2031
Figure 40: North America Photoelectric Sensor Market Size & Forecast, by Country & Sub-region, Value (US$ Mn), 2022‒2031
Figure 41: North America Photoelectric Sensor Market Size & Forecast, by Country & Sub-region, Value (US$ Mn), 2022‒2031
Figure 42: North America Photoelectric Sensor Market Size & Forecast, by Country & Sub-region, Value (US$ Mn), 2022‒2031
Figure 43: Europe Photoelectric Sensor Market Size & Forecast, by Region, Value (US$ Mn), 2022‒2031
Figure 44: Europe Photoelectric Sensor Market, Value (US$ Mn), 2017‒2031
Figure 45: Europe Photoelectric Sensor Market, Volume (Million Units), 2017‒2031
Figure 46: Europe Photoelectric Sensor Market, Volume (Million Units), 2017‒2031
Figure 47: Europe Photoelectric Sensor Market Size & Forecast, by Type, Value (US$ Mn), 2017‒2031
Figure 48: Europe Photoelectric Sensor Market Attractiveness, by Type, Value (US$ Mn), 2022‒2031
Figure 49: Europe Photoelectric Sensor Market Size & Forecast, by Type, Value (US$ Mn), 2022‒2031
Figure 50: Europe Photoelectric Sensor Market Size & Forecast, by Range, Value (US$ Mn), 2017‒2031
Figure 51: Europe Photoelectric Sensor Market Attractiveness, by Range, Value (US$ Mn), 2022‒2031
Figure 52: Europe Photoelectric Sensor Market Size & Forecast, by Range, Value (US$ Mn), 2022‒2031
Figure 53: Europe Photoelectric Sensor Market Size & Forecast, by Configuration, Value (US$ Mn), 2017‒2031
Figure 54: Europe Photoelectric Sensor Market Attractiveness, by Configuration, Value (US$ Mn), 2022‒2031
Figure 55: Europe Photoelectric Sensor Market Size & Forecast, by Configuration, Value (US$ Mn), 2022‒2031
Figure 56: Europe Photoelectric Sensor Market Size & Forecast, by Application, Value (US$ Mn), 2017‒2031
Figure 57: Europe Photoelectric Sensor Market Attractiveness, by Application, Value (US$ Mn), 2022‒2031
Figure 58: Europe Photoelectric Sensor Market Size & Forecast, by Application, Value (US$ Mn), 2022‒2031
Figure 59: Europe Photoelectric Sensor Market Size & Forecast, by End-use industry, Value (US$ Mn), 2017‒2031
Figure 60: Europe Photoelectric Sensor Market Attractiveness, by End-use industry, Value (US$ Mn), 2022‒2031
Figure 61: Europe Photoelectric Sensor Market Size & Forecast, by End-use industry, Value (US$ Mn), 2022‒2031
Figure 62: Europe Photoelectric Sensor Market Size & Forecast, by Country & Sub-region, Value (US$ Mn), 2017‒2031
Figure 63: Europe Photoelectric Sensor Market Attractiveness, by Country & Sub-region, Value (US$ Mn), 2022‒2031
Figure 64: Europe Photoelectric Sensor Market Size & Forecast, by Country & Sub-region, Value (US$ Mn), 2022‒2031
Figure 65: Europe Photoelectric Sensor Market Size & Forecast, by Country & Sub-region, Value (US$ Mn), 2022‒2031
Figure 66: Europe Photoelectric Sensor Market Size & Forecast, by Country & Sub-region, Value (US$ Mn), 2022‒2031
Figure 67: Asia Pacific Photoelectric Sensor Market Size & Forecast, by Region, Value (US$ Mn), 2022‒2031
Figure 68: Asia Pacific Photoelectric Sensor Market, Value (US$ Mn), 2017‒2031
Figure 69: Asia Pacific Photoelectric Sensor Market, Volume (Million Units), 2017‒2031
Figure 70: Asia Pacific Photoelectric Sensor Market, Volume (Million Units), 2017‒2031
Figure 71: Asia Pacific Photoelectric Sensor Market Size & Forecast, by Type, Value (US$ Mn), 2017‒2031
Figure 72: Asia Pacific Photoelectric Sensor Market Attractiveness, by Type, Value (US$ Mn), 2022‒2031
Figure 73: Asia Pacific Photoelectric Sensor Market Size & Forecast, by Type, Value (US$ Mn), 2022‒2031
Figure 74: Asia Pacific Photoelectric Sensor Market Size & Forecast, by Range, Value (US$ Mn), 2017‒2031
Figure 75: Asia Pacific Photoelectric Sensor Market Attractiveness, by Range, Value (US$ Mn), 2022‒2031
Figure 76: Asia Pacific Photoelectric Sensor Market Size & Forecast, by Range, Value (US$ Mn), 2022‒2031
Figure 77: Asia Pacific Photoelectric Sensor Market Size & Forecast, by Configuration, Value (US$ Mn), 2017‒2031
Figure 78: Asia Pacific Photoelectric Sensor Market Attractiveness, by Configuration, Value (US$ Mn), 2022‒2031
Figure 79: Asia Pacific Photoelectric Sensor Market Size & Forecast, by Configuration, Value (US$ Mn), 2022‒2031
Figure 80: Asia Pacific Photoelectric Sensor Market Size & Forecast, by Application, Value (US$ Mn), 2017‒2031
Figure 81: Asia Pacific Photoelectric Sensor Market Attractiveness, by Application, Value (US$ Mn), 2022‒2031
Figure 82: Asia Pacific Photoelectric Sensor Market Size & Forecast, by Application, Value (US$ Mn), 2022‒2031
Figure 83: Asia Pacific Photoelectric Sensor Market Size & Forecast, by End-use industry, Value (US$ Mn), 2022‒2031
Figure 84: Asia Pacific Photoelectric Sensor Market Size & Forecast, by End-use industry, Value (US$ Mn), 2022‒2031
Figure 85: Asia Pacific Photoelectric Sensor Market Size & Forecast, by End-use industry, Value (US$ Mn), 2022‒2031
Figure 86: Asia Pacific Photoelectric Sensor Market Size & Forecast, by Country & Sub-region, Value (US$ Mn), 2017‒2031
Figure 87: Asia Pacific Photoelectric Sensor Market Attractiveness, by Country & Sub-region, Value (US$ Mn), 2022‒2031
Figure 88: Asia Pacific Photoelectric Sensor Market Size & Forecast, by Country & Sub-region, Value (US$ Mn), 2022‒2031
Figure 89: Middle East & Africa Photoelectric Sensor Market Size & Forecast, by Region, Value (US$ Mn), 2022‒2031
Figure 90: Middle East & Africa Photoelectric Sensor Market, Value (US$ Mn), 2017‒2031
Figure 91: Middle East & Africa Photoelectric Sensor Market, Volume (Million Units), 2017‒2031
Figure 92: Middle East & Africa Photoelectric Sensor Market, Volume (Million Units), 2017‒2031
Figure 93: Middle East & Africa Photoelectric Sensor Market Size & Forecast, by Type, Value (US$ Mn), 2017‒2031
Figure 94: Middle East & Africa Photoelectric Sensor Market Attractiveness, by Type, Value (US$ Mn), 2022‒2031
Figure 95: Middle East & Africa Photoelectric Sensor Market Size & Forecast, by Type, Value (US$ Mn), 2022‒2031
Figure 96: Middle East & Africa Photoelectric Sensor Market Size & Forecast, by Range, Value (US$ Mn), 2017‒2031
Figure 97: Middle East & Africa Photoelectric Sensor Market Attractiveness, by Range, Value (US$ Mn), 2022‒2031
Figure 98: Middle East & Africa Photoelectric Sensor Market Size & Forecast, by Range, Value (US$ Mn), 2022‒2031
Figure 99: Middle East & Africa Photoelectric Sensor Market Size & Forecast, by Configuration, Value (US$ Mn), 2017‒2031
Figure 100: Middle East & Africa Photoelectric Sensor Market Attractiveness, by Configuration, Value (US$ Mn), 2022‒2031
Figure 101: Middle East & Africa Photoelectric Sensor Market Size & Forecast, by Configuration, Value (US$ Mn), 2022‒2031
Figure 102: Middle East & Africa Photoelectric Sensor Market Size & Forecast, by Application, Value (US$ Mn), 2017‒2031
Figure 103: Middle East & Africa Photoelectric Sensor Market Attractiveness, by Application, Value (US$ Mn), 2022‒2031
Figure 104: Middle East & Africa Photoelectric Sensor Market Size & Forecast, by Application, Value (US$ Mn), 2022‒2031
Figure 105: Middle East & Africa Photoelectric Sensor Market Size & Forecast, by End-use industry, Value (US$ Mn), 2022‒2031
Figure 106: Middle East & Africa Photoelectric Sensor Market Size & Forecast, by End-use industry, Value (US$ Mn), 2022‒2031
Figure 107: Middle East & Africa Photoelectric Sensor Market Size & Forecast, by End-use industry, Value (US$ Mn), 2022‒2031
Figure 108: Middle East & Africa Photoelectric Sensor Market Size & Forecast, by Country & Sub-region, Value (US$ Mn), 2017‒2031
Figure 109: Middle East & Africa Photoelectric Sensor Market Attractiveness, by Country & Sub-region, Value (US$ Mn), 2022‒2031
Figure 110: Middle East & Africa Photoelectric Sensor Market Size & Forecast, by Country & Sub-region, Value (US$ Mn), 2022‒2031
Figure 111: South America Photoelectric Sensor Market Size & Forecast, by Region, Value (US$ Mn), 2022‒2031
Figure 112: South America Photoelectric Sensor Market, Value (US$ Mn), 2017‒2031
Figure 113: South America Photoelectric Sensor Market, Volume (Million Units), 2017‒2031
Figure 114: South America Photoelectric Sensor Market, Volume (Million Units), 2017‒2031
Figure 115: South America Photoelectric Sensor Market Size & Forecast, by Type, Value (US$ Mn), 2017‒2031
Figure 116: South America Photoelectric Sensor Market Attractiveness, by Type, Value (US$ Mn), 2022‒2031
Figure 117: South America Photoelectric Sensor Market Size & Forecast, by Type, Value (US$ Mn), 2022‒2031
Figure 118: South America Photoelectric Sensor Market Size & Forecast, by Range, Value (US$ Mn), 2017‒2031
Figure 119: South America Photoelectric Sensor Market Attractiveness, by Range, Value (US$ Mn), 2022‒2031
Figure 120: South America Photoelectric Sensor Market Size & Forecast, by Range, Value (US$ Mn), 2022‒2031
Figure 121: South America Photoelectric Sensor Market Size & Forecast, by Configuration, Value (US$ Mn), 2017‒2031
Figure 122: South America Photoelectric Sensor Market Attractiveness, by Configuration, Value (US$ Mn), 2022‒2031
Figure 123: South America Photoelectric Sensor Market Size & Forecast, by Configuration, Value (US$ Mn), 2022‒2031
Figure 124: South America Photoelectric Sensor Market Size & Forecast, by Application, Value (US$ Mn), 2017‒2031
Figure 125: South America Photoelectric Sensor Market Attractiveness, by Application, Value (US$ Mn), 2022‒2031
Figure 126: South America Photoelectric Sensor Market Size & Forecast, by Application, Value (US$ Mn), 2022‒2031
Figure 127: South America Photoelectric Sensor Market Size & Forecast, by End-use industry, Value (US$ Mn), 2022‒2031
Figure 128: South America Photoelectric Sensor Market Size & Forecast, by End-use industry, Value (US$ Mn), 2022‒2031
Figure 129: South America Photoelectric Sensor Market Size & Forecast, by End-use industry, Value (US$ Mn), 2022‒2031
Figure 130: South America Photoelectric Sensor Market Size & Forecast, by Country & Sub-region, Value (US$ Mn), 2017‒2031
Figure 131: South America Photoelectric Sensor Market Attractiveness, by Country & Sub-region, Value (US$ Mn), 2022‒2031
Figure 132: South America Photoelectric Sensor Market Size & Forecast, by Country & Sub-region, Value (US$ Mn), 2022‒2031
Figure 133: Global Photoelectric Sensor Market Share Analysis, by Company
Copyright © Transparency Market Research, Inc. All Rights reserved
Trust Online

Photoelectric Sensors Market