

Reports
Reports
The global PCSK9 Inhibitor Market size was valued at USD 2.3 Billion in 2025 and is projected to reach USD 12.9 Billion by 2036, expanding at a CAGR of 16.9% from 2026 to 2036. PCSK9 inhibitors are seeing a steady rise in their demand due to the prevalence of cardiovascular diseases and hypercholesterolemia in the global market. These medications can only be prescribed in cases where statin medications do not suffice and in such instances, they assist in reducing the level of LDL cholesterol considerably.
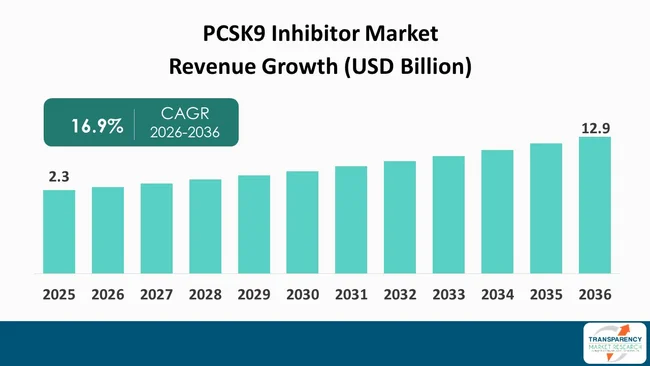
The PCSK9 inhibitor market is projected to see solid growth in the next several years, due to cardiovascular diseases are showing up more and more, and high cholesterol levels are also becoming more common worldwide. Many analysts think these therapies have turned into a fairly crucial option for patients who are unable to reach target LDL cholesterol levels with statins alone, or for those who run into adverse effects with older, conventional cholesterol-lowering drugs. The track record of PCSK9 inhibitors-how they can cut LDL cholesterol and also bring down the odds of major cardiovascular events has really helped cement their role in the overall treatment landscape The move toward long-acting therapies, basically giving patients more ease and less hassle. The arrival of siRNA-based treatments has widened the market, opening fresh room for new ideas and better formats. Beyond that, ongoing spending on cardiovascular research, plus work on next-generation lipid lowering therapies, should back up more expansion later.
Analysts also say that favorable clinical guidelines and the growing awareness among healthcare professionals are both nudging adoption rates up, especially for people who are high risk in cardiovascular terms. The PCSK9 Inhibitor market facing challenges, like the high cost of therapy and some reimbursement limitations in a few regions. Together these things could limit access, notably in developing countries where coverage can be more complicated. Higher healthcare spending, better diagnosis rates, and the pipeline work that keeps moving forward are anticipated to build a more supportive landscape for market expansion
The PCSK9 inhibitor market, is one key segment within global cardiovascular therapeutics and it really centers on the more advanced ways to bring down low-density lipoprotein, LDL cholesterol levels. In practice, PCSK9 inhibitors are given to people with familial hypercholesterolemia, plus those dealing with atherosclerotic cardiovascular disease, ASCVD and also to patients who just can’t get sufficient cholesterol control from statin therapy alone. Basically these treatments act by blocking the PCSK9 protein, so the liver can pull out more LDL cholesterol from the blood stream, and in turn that helps lower the chance of cardiovascular events.
The PCSK9 Inhibitor market is getting a lot of attention lately, mostly because cardiovascular diseases have become more common, people are more aware of cholesterol control and there is a bigger need for real lipid lowering options. Biologics improvements and RNA based therapies are showing up more often, so the treatment choices for patients have expanded. Clinical guidance that keeps getting reinforced, plus all the ongoing research, is pushing the use of PCSK9 inhibitors in both established and developing healthcare markets and since health systems keep putting more focus on prevention, especially preventive cardiovascular care, the demand for innovative cholesterol-lowering therapies is expected to increase steadily.
| Attribute | Detail |
|---|---|
| PCSK9 Inhibitor Market Drivers |
|
The rising prevalence of hypercholesterolemia, and cardiovascular diseases is one of the most important factors pushing growth in the PCSK9 inhibitor market. Higher low-density lipoprotein or LDL cholesterol, is one of the as a key driver for atherosclerosis, myocardial infarctions and strokes, so there’s a clear need for stronger lipid reducing treatments that actually work. According to the World Health Organization, WHO, cardiovascular diseases stayed the number one cause of death worldwide. In 2022 they were behind roughly 19.8 million deaths, which is close to 32% of all deaths globally. Roughly 85% of those deaths came from heart attacks and strokes, so the load on healthcare systems is pretty heavy. The WHO also reports that over three-quarters of cardiovascular disease deaths happen in low and middle income countries, which suggests many patients still go without treatment.
High cholesterol keeps being a pretty common health trouble, and it really pushes up cardiovascular risk too. The U.S. Centers for Disease Control and Prevention, (CDC) says around 86 million adults age 20 and older in the United States had total cholesterol above 200 mg/dL from 2017 through 2020. And close to 25 million adults had cholesterol that went past 240 mg/dL. The CDC also noted something like only 54.5% of adults who could benefit from cholesterol lowering medication, were actually getting treatment. So as more patients end up needing stronger LDL cholesterol reduction, the demand for advanced options like PCSK9 inhibitors is expected to keep rising, more or less steadily across healthcare markets worldwide.
The growing use of advanced fat-lowering therapies is proving to be a big driver for the PCSK9 inhibitor market. Healthcare systems and clinical organizations are putting more weight on reaching tough LDL cholesterol reduction goals, so the chance of cardiovascular events can be reduced. Because of that, care pathways are not just sticking with traditional statin therapy anymore. Instead they are increasingly mixing in new options such as PCSK9 inhibitors and siRNA based lipid-lowering drugs.
As per the U.S. Centers for Disease Control and Prevention (CDC), about 86.4 million adults age 20 years and older in the United States were living with high or borderline-high cholesterol levels in 2017-2020 and honestly that shows a huge pool of patients who really need solid cholesterol management. The CDC also says 63.1 million U.S. adults had LDL cholesterol levels at 130 mg/dL or higher during that same period, so it kind of points toward strong need for more intensive lipid lowering treatment.
Clinical guidelines are sort of also pushing advanced therapies for folks who are still stuck at high cardiovascular risk even after standard treatment. The American College of Cardiology (ACC) and the American Heart Association (AHA) say that the newer dyslipidemia guidance, out in 2026, basically widened where PCSK9 inhibitors and inclisiran fit in at the same time. At the same time, it seems to point clinicians toward tighter LDL-cholesterol targets, kind of more rigid. Like for example, very-high-risk patients are being guided to aim for LDL levels under 55 mg/dL, which is pretty strict. These recommendations reflect a broader shift toward more intensive cholesterol management and earlier intervention strategies. The mix of a large high risk patient pool, a growing clinical focus on reducing LDL and wider guideline backing is, overall, creating a strong demand for advanced lipid lowering therapies, which then pushes growth in the PCSK9 inhibitor market.
| Attribute | Detail |
|---|---|
| PCSK9 Inhibitor Market Opportunities |
|
The growth of siRNA -based PCSK9 therapies is showing up as a pretty big chance in the PCSK9 inhibitor market, mostly because these options can keep lowering cholesterol for a long time while needing fewer doses than the usual treatments. In simple terms, the siRNA approach works by blocking the liver from making the PCSK9 protein. As a result, LDL cholesterol levels can stay down over time. It also tackles a real, everyday problem in cardiovascular care, namely patient adherence, since long term treatment is hard to keep up with, even when people try.
So as stated by the World Health Organization, WHO, cardiovascular diseases were behind about 19.8 million deaths worldwide in 2022, roughly around one third of all deaths. And because the cardiovascular disease burden keeps going up, the need for new therapies that can deliver lasting management of lipids keeps climbing as well. As per the U.S. Centers for Disease Control and Prevention (CDC), roughly 38% of U.S. adults had high total cholesterol, or they were already taking cholesterol-lowering medication during the last assessment window, which shows how many people could potentially benefit from newer lipid-reduction approaches. The rise of siRNA-style treatments fits neatly with the broader movement toward better treatment adherence and less healthcare strain that comes with frequent dosing plans. The National Institutes of Health (NIH) says RNA-based therapeutics are turning into one of the speediest-growing corners of pharmaceutical innovation, with clinical uses widening across several long-term conditions. With clinicians putting more weight on long-lasting results and easier administration routines, siRNA-based PCSK9 therapies are set to unlock big commercial chances, and help drive the next step of growth in the overall global PCSK9 inhibitor market.
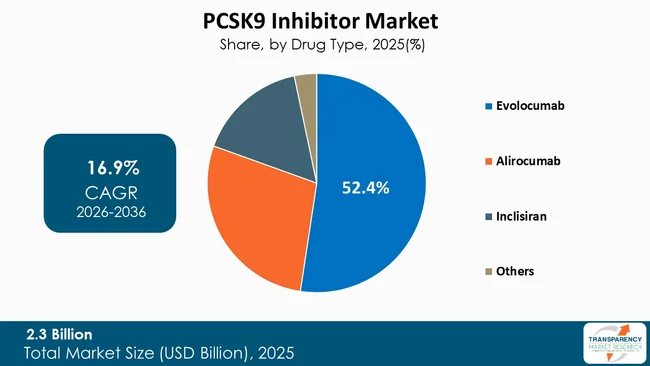
Among the drug type segment, Evolocumab hold the dominant position and account for approximately 52.4% share of the total PCSK9 Inhibitor Market because it’s already-established clinical profile, plus broad regulatory approvals and the general widespread use among people living with atherosclerotic cardiovascular disease (ASCVD) and familial hypercholesterolemia. As per the American Heart Association (AHA), cardiovascular disease was tied to 941,652 deaths in the United States in 2022. It stayed one of the leading causes of mortality. The burden of heart-related conditions keeps climbing, so there is a greater need for effective cholesterol-lowering therapies that can lower cardiovascular risk for high-risk patient groups.
The dominance of this segment is supported even more by a growing clinical push toward hitting lower LDL cholesterol targets. As per the National Center for Health Statistics, (NCHS) 11.3% of U.S. adults said they had high total cholesterol during August 2021- August 2023. Also, the American Heart Association (AHA) Heart Disease and Stroke Statistics 2025 update notes that roughly 127.9 million U.S. adults were living with one or more cardiovascular conditions such as coronary heart disease, heart failure stroke or hypertension. Because there is such a big group of patients that needs ongoing lipid management, the market has leaned into advanced options such as Evolocumab. Physicians also seem quite comfortable with these treatments, and there’s a wide base of real-world support plus proven LDL-C drop results which keep strengthening the segment’s leadership while growing emphasis on preventive cardiovascular care is expected to support future demand.
| Attribute | Detail |
|---|---|
| Leading Region |
|
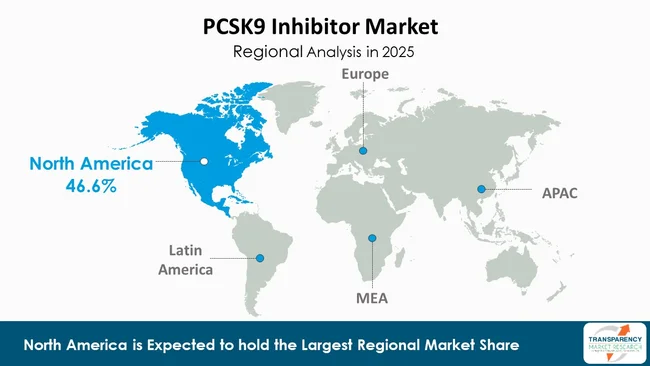
North America leads the PCSK9 Inhibitor Market which is expected to reach 46.6% of the global market share in 2025, mainly because the region has a region has a very developed healthcare system, plus specialty pharmaceuticals are widely available and reimbursement policies look pretty supportive. Also, there is a strong uptake of newer cardiovascular treatments, so adoption tends to move faster than in many other places.
The United States still remains the primary contributor of the regional revenue, mainly because healthcare spending is high, diagnostic capabilities are advanced, and there is a solid structure in place for handling long-term cardiovascular issues. Major pharmaceutical companies are active there, along with a lot of clinical research work, helps keep momentum. New therapies are then integrated quickly into everyday clinical practice, which just reinforces the region’s overall position. According to the U.S. Centers for Medicare & Medicaid Services (CMS), national health expenditures touched roughly USD 4.9 trillion in 2023, and that is about a 7.5% jump vs 2022. Healthcare spending made up 17.6% of U.S. gross domestic product (GDP), so the country stays among the most expensive healthcare spenders worldwide. These helps for enable access to high-end biologic therapies, like PCSK9 inhibitors and also broaden treatment options for qualifying patient groups.
The Centers for Disease Control and Prevention (CDC) notes that almost 47% of U.S. adults lived with hypertension during 2021-2023, which underscores how large the at-risk population is for cardiovascular problems. The region moreover gets a boost from steady backing by professional groups, including the American Heart Association (AHA) and the American College of Cardiology (ACC), who keep pushing aggressive LDL-cholesterol management for people who are high risk.
On the subject of competitiveness, PCSK9 inhibitors' market has competitive rivalry involving a small number of pharmaceuticals that concentrate on lipid-lowering treatments, cardiovascular outcomes, and advancements in cholesterol management technologies. Some examples of the leading companies in this market are Amgen Inc., Regeneron Pharmaceuticals, Inc., Sanofi S.A., Novartis AG, and Arrowhead Pharmaceuticals, Inc. Amgen Inc.'s competitive advantage is due to the success achieved by Evolocumab based on well-developed evidence, physician support, and the large global market share. The competitive rivalry on the market is driven by Alirocumab by Regeneron Pharmaceuticals, Inc. and Sanofi S.A., who have expertise in developing biological medications and cardiovascular drugs. Novartis AG is gaining competitiveness through Inclisiran, which utilizes siRNA technology for delivering prolonged and infrequent reductions in levels of LDL-cholesterol. Arrowhead Pharmaceuticals, Inc. develops RNAi-based drugs and is known for its breakthrough technologies in RNAi gene silencing platform dedicated to treating cardiometabolic disorders.
The competitive scene is getting more and more shaped by what people are putting into RNA therapeutics type things, cardiovascular outcome studies and also the next generation gene-editing methods. Most companies are trying to grow their product portfolios, they want better clinical evidence, and they are also aiming to make it easier for patients with longer-lasting treatment options,
| Attribute | Detail |
|---|---|
| Size in 2025 | USD 2.3 Billion |
| Forecast Value in 2036 | USD 12.9 Billion |
| CAGR | 16.9% |
| Forecast Period | 2026-2036 |
| Historical Data Available for | 2021-2025 |
| Quantitative Units | USD Billion |
| PCSK9 Inhibitor Market Analysis | It includes segment analysis and regional level analysis. Qualitative analysis includes drivers, restraints, opportunities, key trends, value chain analysis and key trend analysis. |
| Competition Landscape |
|
| Format | Electronic (PDF) + Excel |
| Segmentation | Drug Type
|
| Regions Covered |
|
| Countries Covered |
|
| Companies Profiled |
|
| Customization Scope | Available upon request |
| Pricing | Available upon request |
The market was valued at USD 2.3 Billion in 2025.
The industry is projected to reach USD 12.9 Billion by the end of 2036.
The market is driven by the factor such as growing global burden of high cholesterol and cardiovascular diseases accelerating demand for PCSK9 inhibitors and expanding use of advanced lipid-lowering therapies supporting PCSK9 inhibitor adoption.
The CAGR is anticipated to be 16.9% from 2026 to 2036.
North America is expected to account for the largest share from 2026 to 2036.
Amgen Inc., Regeneron Pharmaceuticals, Inc., Sanofi S.A., Novartis AG, Merck & Co., Inc., Pfizer Inc., Eli Lilly and Company, AstraZeneca PLC, Esperion Therapeutics, Inc., Arrowhead Pharmaceuticals, Inc., Silence Therapeutics plc, LIB Therapeutics Inc., CRISPR Therapeutics AG, Verve Therapeutics, Inc., Ionis Pharmaceuticals, Inc., Alnylam Pharmaceuticals, Inc., Daiichi Sankyo Company, Limited, Shanghai Junshi Biosciences Co., Ltd., NewAmsterdam Pharma Company N.V., and Lepu Biopharma Co., Ltd.
Table 01: Global PCSK9 Inhibitor Market Value (USD Billion) Forecast, by Drug Type, 2021 to 2036
Table 02: Global PCSK9 Inhibitor Market Value (USD Billion) Forecast, by Modality, 2021 to 2036
Table 03: Global PCSK9 Inhibitor Market Value (USD Billion) Forecast, by Indication, 2021 to 2036
Table 04: Global PCSK9 Inhibitor Market Value (USD Billion) Forecast, by Route of Administration, 2021 to 2036
Table 05: Global PCSK9 Inhibitor Market Value (USD Billion) Forecast, by Distribution Channel, 2021 to 2036
Table 06: Global PCSK9 Inhibitor Market Value (USD Billion) Forecast, by Country/Sub-region, 2021 to 2036
Table 07: North America PCSK9 Inhibitor Market Value (USD Billion) Forecast, by Drug Type, 2021 to 2036
Table 08: North America PCSK9 Inhibitor Market Value (USD Billion) Forecast, by Modality, 2021 to 2036
Table 09: North America PCSK9 Inhibitor Market Value (USD Billion) Forecast, by Indication, 2021 to 2036
Table 10: North America PCSK9 Inhibitor Market Value (USD Billion) Forecast, by Route of Administration, 2021 to 2036
Table 11: North America PCSK9 Inhibitor Market Value (USD Billion) Forecast, by Distribution Channel, 2021 to 2036
Table 12: North America PCSK9 Inhibitor Market Value (USD Billion) Forecast, by Country/Sub-region, 2021 to 2036
Table 13: U.S. PCSK9 Inhibitor Market Value (USD Billion) Forecast, by Drug Type, 2021 to 2036
Table 14: U.S. PCSK9 Inhibitor Market Value (USD Billion) Forecast, by Modality, 2021 to 2036
Table 15: U.S. PCSK9 Inhibitor Market Value (USD Billion) Forecast, by Indication, 2021 to 2036
Table 16: U.S. PCSK9 Inhibitor Market Value (USD Billion) Forecast, by Route of Administration, 2021 to 2036
Table 17: U.S. PCSK9 Inhibitor Market Value (USD Billion) Forecast, by Distribution Channel, 2021 to 2036
Table 18: Canada PCSK9 Inhibitor Market Value (USD Billion) Forecast, by Drug Type, 2021 to 2036
Table 19: Canada PCSK9 Inhibitor Market Value (USD Billion) Forecast, by Modality, 2021 to 2036
Table 20: Canada PCSK9 Inhibitor Market Value (USD Billion) Forecast, by Indication, 2021 to 2036
Table 21: Canada PCSK9 Inhibitor Market Value (USD Billion) Forecast, by Route of Administration, 2021 to 2036
Table 22: Canada PCSK9 Inhibitor Market Value (USD Billion) Forecast, by Distribution Channel, 2021 to 2036
Table 23: Europe PCSK9 Inhibitor Market Value (USD Billion) Forecast, by Drug Type, 2021 to 2036
Table 24: Europe PCSK9 Inhibitor Market Value (USD Billion) Forecast, by Modality, 2021 to 2036
Table 25: Europe PCSK9 Inhibitor Market Value (USD Billion) Forecast, by Indication, 2021 to 2036
Table 26: Europe PCSK9 Inhibitor Market Value (USD Billion) Forecast, by Route of Administration, 2021 to 2036
Table 27: Europe PCSK9 Inhibitor Market Value (USD Billion) Forecast, by Distribution Channel, 2021 to 2036
Table 28: Europe PCSK9 Inhibitor Market Value (USD Billion) Forecast, by Country/Sub-region, 2021 to 2036
Table 29: Germany PCSK9 Inhibitor Market Value (USD Billion) Forecast, by Drug Type, 2021 to 2036
Table 30: Germany PCSK9 Inhibitor Market Value (USD Billion) Forecast, by Modality, 2021 to 2036
Table 31: Germany PCSK9 Inhibitor Market Value (USD Billion) Forecast, by Indication, 2021 to 2036
Table 32: Germany PCSK9 Inhibitor Market Value (USD Billion) Forecast, by Route of Administration, 2021 to 2036
Table 33: Germany PCSK9 Inhibitor Market Value (USD Billion) Forecast, by Distribution Channel, 2021 to 2036
Table 34: U.K. PCSK9 Inhibitor Market Value (USD Billion) Forecast, by Drug Type, 2021 to 2036
Table 35: U.K. PCSK9 Inhibitor Market Value (USD Billion) Forecast, by Modality, 2021 to 2036
Table 36: U.K. PCSK9 Inhibitor Market Value (USD Billion) Forecast, by Indication, 2021 to 2036
Table 37: U.K. PCSK9 Inhibitor Market Value (USD Billion) Forecast, by Route of Administration, 2021 to 2036
Table 38: U.K. PCSK9 Inhibitor Market Value (USD Billion) Forecast, by Distribution Channel, 2021 to 2036
Table 39: France PCSK9 Inhibitor Market Value (USD Billion) Forecast, by Drug Type, 2021 to 2036
Table 40: France PCSK9 Inhibitor Market Value (USD Billion) Forecast, by Modality, 2021 to 2036
Table 41: France PCSK9 Inhibitor Market Value (USD Billion) Forecast, by Indication, 2021 to 2036
Table 42: France PCSK9 Inhibitor Market Value (USD Billion) Forecast, by Route of Administration, 2021 to 2036
Table 43: France PCSK9 Inhibitor Market Value (USD Billion) Forecast, by Distribution Channel, 2021 to 2036
Table 44: Italy PCSK9 Inhibitor Market Value (USD Billion) Forecast, by Drug Type, 2021 to 2036
Table 45: Italy PCSK9 Inhibitor Market Value (USD Billion) Forecast, by Modality, 2021 to 2036
Table 46: Italy PCSK9 Inhibitor Market Value (USD Billion) Forecast, by Indication, 2021 to 2036
Table 47: Italy PCSK9 Inhibitor Market Value (USD Billion) Forecast, by Route of Administration, 2021 to 2036
Table 48: Italy PCSK9 Inhibitor Market Value (USD Billion) Forecast, by Distribution Channel, 2021 to 2036
Table 49: Spain PCSK9 Inhibitor Market Value (USD Billion) Forecast, by Drug Type, 2021 to 2036
Table 50: Spain PCSK9 Inhibitor Market Value (USD Billion) Forecast, by Modality, 2021 to 2036
Table 51: Spain PCSK9 Inhibitor Market Value (USD Billion) Forecast, by Indication, 2021 to 2036
Table 52: Spain PCSK9 Inhibitor Market Value (USD Billion) Forecast, by Route of Administration, 2021 to 2036
Table 53: Spain PCSK9 Inhibitor Market Value (USD Billion) Forecast, by Distribution Channel, 2021 to 2036
Table 54: The Netherlands PCSK9 Inhibitor Market Value (USD Billion) Forecast, by Drug Type, 2021 to 2036
Table 55: The Netherlands PCSK9 Inhibitor Market Value (USD Billion) Forecast, by Modality, 2021 to 2036
Table 56: The Netherlands PCSK9 Inhibitor Market Value (USD Billion) Forecast, by Indication, 2021 to 2036
Table 57: The Netherlands PCSK9 Inhibitor Market Value (USD Billion) Forecast, by Route of Administration, 2021 to 2036
Table 58: The Netherlands PCSK9 Inhibitor Market Value (USD Billion) Forecast, by Distribution Channel, 2021 to 2036
Table 59: Switzerland PCSK9 Inhibitor Market Value (USD Billion) Forecast, by Drug Type, 2021 to 2036
Table 60: Switzerland PCSK9 Inhibitor Market Value (USD Billion) Forecast, by Modality, 2021 to 2036
Table 61: Switzerland PCSK9 Inhibitor Market Value (USD Billion) Forecast, by Indication, 2021 to 2036
Table 62: Switzerland PCSK9 Inhibitor Market Value (USD Billion) Forecast, by Route of Administration, 2021 to 2036
Table 63: Switzerland PCSK9 Inhibitor Market Value (USD Billion) Forecast, by Distribution Channel, 2021 to 2036
Table 64: Rest of Europe PCSK9 Inhibitor Market Value (USD Billion) Forecast, by Drug Type, 2021 to 2036
Table 65: Rest of Europe PCSK9 Inhibitor Market Value (USD Billion) Forecast, by Modality, 2021 to 2036
Table 66: Rest of Europe PCSK9 Inhibitor Market Value (USD Billion) Forecast, by Indication, 2021 to 2036
Table 67: Rest of Europe PCSK9 Inhibitor Market Value (USD Billion) Forecast, by Route of Administration, 2021 to 2036
Table 68: Rest of Europe PCSK9 Inhibitor Market Value (USD Billion) Forecast, by Distribution Channel, 2021 to 2036
Table 69: Asia Pacific PCSK9 Inhibitor Market Value (USD Billion) Forecast, by Drug Type, 2021 to 2036
Table 70: Asia Pacific PCSK9 Inhibitor Market Value (USD Billion) Forecast, by Modality, 2021 to 2036
Table 71: Asia Pacific PCSK9 Inhibitor Market Value (USD Billion) Forecast, by Indication, 2021 to 2036
Table 72: Asia Pacific PCSK9 Inhibitor Market Value (USD Billion) Forecast, by Route of Administration, 2021 to 2036
Table 73: Asia Pacific PCSK9 Inhibitor Market Value (USD Billion) Forecast, by Distribution Channel, 2021 to 2036
Table 74: Asia Pacific PCSK9 Inhibitor Market Value (USD Billion) Forecast, by Country/Sub-region, 2021 to 2036
Table 75: China PCSK9 Inhibitor Market Value (USD Billion) Forecast, by Drug Type, 2021 to 2036
Table 76: China PCSK9 Inhibitor Market Value (USD Billion) Forecast, by Modality, 2021 to 2036
Table 77: China PCSK9 Inhibitor Market Value (USD Billion) Forecast, by Indication, 2021 to 2036
Table 78: China PCSK9 Inhibitor Market Value (USD Billion) Forecast, by Route of Administration, 2021 to 2036
Table 79: China PCSK9 Inhibitor Market Value (USD Billion) Forecast, by Distribution Channel, 2021 to 2036
Table 80: Japan PCSK9 Inhibitor Market Value (USD Billion) Forecast, by Drug Type, 2021 to 2036
Table 81: Japan PCSK9 Inhibitor Market Value (USD Billion) Forecast, by Modality, 2021 to 2036
Table 82: Japan PCSK9 Inhibitor Market Value (USD Billion) Forecast, by Indication, 2021 to 2036
Table 83: Japan PCSK9 Inhibitor Market Value (USD Billion) Forecast, by Route of Administration, 2021 to 2036
Table 84: Japan PCSK9 Inhibitor Market Value (USD Billion) Forecast, by Distribution Channel, 2021 to 2036
Table 85: India PCSK9 Inhibitor Market Value (USD Billion) Forecast, by Drug Type, 2021 to 2036
Table 86: India PCSK9 Inhibitor Market Value (USD Billion) Forecast, by Modality, 2021 to 2036
Table 87: India PCSK9 Inhibitor Market Value (USD Billion) Forecast, by Indication, 2021 to 2036
Table 88: India PCSK9 Inhibitor Market Value (USD Billion) Forecast, by Route of Administration, 2021 to 2036
Table 89: India PCSK9 Inhibitor Market Value (USD Billion) Forecast, by Distribution Channel, 2021 to 2036
Table 90: South Korea PCSK9 Inhibitor Market Value (USD Billion) Forecast, by Drug Type, 2021 to 2036
Table 91: South Korea PCSK9 Inhibitor Market Value (USD Billion) Forecast, by Modality, 2021 to 2036
Table 92: South Korea PCSK9 Inhibitor Market Value (USD Billion) Forecast, by Indication, 2021 to 2036
Table 93: South Korea PCSK9 Inhibitor Market Value (USD Billion) Forecast, by Route of Administration, 2021 to 2036
Table 94: South Korea PCSK9 Inhibitor Market Value (USD Billion) Forecast, by Distribution Channel, 2021 to 2036
Table 95: Australia and New Zealand PCSK9 Inhibitor Market Value (USD Billion) Forecast, by Drug Type, 2021 to 2036
Table 96: Australia and New Zealand PCSK9 Inhibitor Market Value (USD Billion) Forecast, by Modality, 2021 to 2036
Table 97: Australia and New Zealand PCSK9 Inhibitor Market Value (USD Billion) Forecast, by Indication, 2021 to 2036
Table 98: Australia and New Zealand PCSK9 Inhibitor Market Value (USD Billion) Forecast, by Route of Administration, 2021 to 2036
Table 99: Australia and New Zealand PCSK9 Inhibitor Market Value (USD Billion) Forecast, by Distribution Channel, 2021 to 2036
Table 100: Rest of Asia Pacific PCSK9 Inhibitor Market Value (USD Billion) Forecast, by Drug Type, 2021 to 2036
Table 101: Rest of Asia Pacific PCSK9 Inhibitor Market Value (USD Billion) Forecast, by Modality, 2021 to 2036
Table 102: Rest of Asia Pacific PCSK9 Inhibitor Market Value (USD Billion) Forecast, by Indication, 2021 to 2036
Table 103: Rest of Asia Pacific PCSK9 Inhibitor Market Value (USD Billion) Forecast, by Route of Administration, 2021 to 2036
Table 104: Rest of Asia Pacific PCSK9 Inhibitor Market Value (USD Billion) Forecast, by Distribution Channel, 2021 to 2036
Table 105: Latin America PCSK9 Inhibitor Market Value (USD Billion) Forecast, by Drug Type, 2021 to 2036
Table 106: Latin America PCSK9 Inhibitor Market Value (USD Billion) Forecast, by Modality, 2021 to 2036
Table 107: Latin America PCSK9 Inhibitor Market Value (USD Billion) Forecast, by Indication, 2021 to 2036
Table 108: Latin America PCSK9 Inhibitor Market Value (USD Billion) Forecast, by Route of Administration, 2021 to 2036
Table 109: Latin America PCSK9 Inhibitor Market Value (USD Billion) Forecast, by Distribution Channel, 2021 to 2036
Table 110: Latin America PCSK9 Inhibitor Market Value (USD Billion) Forecast, by Country/Sub-region, 2021 to 2036
Table 111: Brazil PCSK9 Inhibitor Market Value (USD Billion) Forecast, by Drug Type, 2021 to 2036
Table 112: Brazil PCSK9 Inhibitor Market Value (USD Billion) Forecast, by Modality, 2021 to 2036
Table 113: Brazil PCSK9 Inhibitor Market Value (USD Billion) Forecast, by Indication, 2021 to 2036
Table 114: Brazil PCSK9 Inhibitor Market Value (USD Billion) Forecast, by Route of Administration, 2021 to 2036
Table 115: Brazil PCSK9 Inhibitor Market Value (USD Billion) Forecast, by Distribution Channel, 2021 to 2036
Table 116: Mexico PCSK9 Inhibitor Market Value (USD Billion) Forecast, by Drug Type, 2021 to 2036
Table 117: Mexico PCSK9 Inhibitor Market Value (USD Billion) Forecast, by Modality, 2021 to 2036
Table 118: Mexico PCSK9 Inhibitor Market Value (USD Billion) Forecast, by Indication, 2021 to 2036
Table 119: Mexico PCSK9 Inhibitor Market Value (USD Billion) Forecast, by Route of Administration, 2021 to 2036
Table 120: Mexico PCSK9 Inhibitor Market Value (USD Billion) Forecast, by Distribution Channel, 2021 to 2036
Table 121: Argentina PCSK9 Inhibitor Market Value (USD Billion) Forecast, by Drug Type, 2021 to 2036
Table 122: Argentina PCSK9 Inhibitor Market Value (USD Billion) Forecast, by Modality, 2021 to 2036
Table 123: Argentina PCSK9 Inhibitor Market Value (USD Billion) Forecast, by Indication, 2021 to 2036
Table 124: Argentina PCSK9 Inhibitor Market Value (USD Billion) Forecast, by Route of Administration, 2021 to 2036
Table 125: Argentina PCSK9 Inhibitor Market Value (USD Billion) Forecast, by Distribution Channel, 2021 to 2036
Table 126: Rest of Latin America PCSK9 Inhibitor Market Value (USD Billion) Forecast, by Drug Type, 2021 to 2036
Table 127: Rest of Latin America PCSK9 Inhibitor Market Value (USD Billion) Forecast, by Modality, 2021 to 2036
Table 128: Rest of Latin America PCSK9 Inhibitor Market Value (USD Billion) Forecast, by Indication, 2021 to 2036
Table 129: Rest of Latin America PCSK9 Inhibitor Market Value (USD Billion) Forecast, by Route of Administration, 2021 to 2036
Table 130: Rest of Latin America PCSK9 Inhibitor Market Value (USD Billion) Forecast, by Distribution Channel, 2021 to 2036
Table 131: Middle East and Africa PCSK9 Inhibitor Market Value (USD Billion) Forecast, by Drug Type, 2021 to 2036
Table 132: Middle East and Africa PCSK9 Inhibitor Market Value (USD Billion) Forecast, by Modality, 2021 to 2036
Table 133: Middle East and Africa PCSK9 Inhibitor Market Value (USD Billion) Forecast, by Indication, 2021 to 2036
Table 134: Middle East and Africa PCSK9 Inhibitor Market Value (USD Billion) Forecast, by Route of Administration, 2021 to 2036
Table 135: Middle East and Africa PCSK9 Inhibitor Market Value (USD Billion) Forecast, by Distribution Channel, 2021 to 2036
Table 136: Middle East and Africa PCSK9 Inhibitor Market Value (USD Billion) Forecast, by Country/Sub-region, 2021 to 2036
Table 137: GCC Countries PCSK9 Inhibitor Market Value (USD Billion) Forecast, by Drug Type, 2021 to 2036
Table 138: GCC Countries PCSK9 Inhibitor Market Value (USD Billion) Forecast, by Modality, 2021 to 2036
Table 139: GCC Countries PCSK9 Inhibitor Market Value (USD Billion) Forecast, by Indication, 2021 to 2036
Table 140: GCC Countries PCSK9 Inhibitor Market Value (USD Billion) Forecast, by Route of Administration, 2021 to 2036
Table 141: GCC Countries PCSK9 Inhibitor Market Value (USD Billion) Forecast, by Distribution Channel, 2021 to 2036
Table 142: South Africa PCSK9 Inhibitor Market Value (USD Billion) Forecast, by Drug Type, 2021 to 2036
Table 143: South Africa PCSK9 Inhibitor Market Value (USD Billion) Forecast, by Modality, 2021 to 2036
Table 144: South Africa PCSK9 Inhibitor Market Value (USD Billion) Forecast, by Indication, 2021 to 2036
Table 145: South Africa PCSK9 Inhibitor Market Value (USD Billion) Forecast, by Route of Administration, 2021 to 2036
Table 146: South Africa PCSK9 Inhibitor Market Value (USD Billion) Forecast, by Distribution Channel, 2021 to 2036
Table 147: Rest of Middle East and Africa PCSK9 Inhibitor Market Value (USD Billion) Forecast, by Drug Type, 2021 to 2036
Table 148: Rest of Middle East and Africa PCSK9 Inhibitor Market Value (USD Billion) Forecast, by Modality, 2021 to 2036
Table 149: Rest of Middle East and Africa PCSK9 Inhibitor Market Value (USD Billion) Forecast, by Indication, 2021 to 2036
Table 150: Rest of Middle East and Africa PCSK9 Inhibitor Market Value (USD Billion) Forecast, by Route of Administration, 2021 to 2036
Table 151: Rest of Middle East and Africa PCSK9 Inhibitor Market Value (USD Billion) Forecast, by Distribution Channel, 2021 to 2036
Figure 01: Global PCSK9 Inhibitor Market Value (USD Billion) Forecast, 2021 to 2036
Figure 02: Global PCSK9 Inhibitor Market Value Share Analysis, by Drug Type, 2025 and 2036
Figure 03: Global PCSK9 Inhibitor Market Attractiveness Analysis, by Drug Type, 2026 to 2036
Figure 04: Global PCSK9 Inhibitor Market Revenue (USD Billion), by Evolocumab, 2021 to 2036
Figure 05: Global PCSK9 Inhibitor Market Revenue (USD Billion), by Alirocumab, 2021 to 2036
Figure 06: Global PCSK9 Inhibitor Market Revenue (USD Billion), by Inclisiran, 2021 to 2036
Figure 07: Global PCSK9 Inhibitor Market Revenue (USD Billion), by Others, 2021 to 2036
Figure 08: Global PCSK9 Inhibitor Market Value Share Analysis, by Modality, 2025 and 2036
Figure 09: Global PCSK9 Inhibitor Market Attractiveness Analysis, by Modality, 2026 to 2036
Figure 10: Global PCSK9 Inhibitor Market Revenue (USD Billion), by Monoclonal Antibodies, 2021 to 2036
Figure 11: Global PCSK9 Inhibitor Market Revenue (USD Billion), by Small Interfering RNA (siRNA) Therapies, 2021 to 2036
Figure 12: Global PCSK9 Inhibitor Market Value Share Analysis, by Indication, 2025 and 2036
Figure 13: Global PCSK9 Inhibitor Market Attractiveness Analysis, by Indication, 2026 to 2036
Figure 14: Global PCSK9 Inhibitor Market Revenue (USD Billion), by Hypercholesterolemia, 2021 to 2036
Figure 15: Global PCSK9 Inhibitor Market Revenue (USD Billion), by Familial Hypercholesterolemia, 2021 to 2036
Figure 16: Global PCSK9 Inhibitor Market Revenue (USD Billion), by Atherosclerotic Cardiovascular Disease (ASCVD), 2021 to 2036
Figure 17: Global PCSK9 Inhibitor Market Revenue (USD Billion), by Statin-Intolerant Patients, 2021 to 2036
Figure 18: Global PCSK9 Inhibitor Market Revenue (USD Billion), by Others, 2021 to 2036
Figure 19: Global PCSK9 Inhibitor Market Value Share Analysis, by Route of Administration, 2025 and 2036
Figure 20: Global PCSK9 Inhibitor Market Attractiveness Analysis, by Route of Administration, 2026 to 2036
Figure 21: Global PCSK9 Inhibitor Market Revenue (USD Billion), by Subcutaneous Injection, 2021 to 2036
Figure 22: Global PCSK9 Inhibitor Market Revenue (USD Billion), by Intravenous Administration, 2021 to 2036
Figure 23: Global PCSK9 Inhibitor Market Value Share Analysis, by Distribution Channel, 2025 and 2036
Figure 24: Global PCSK9 Inhibitor Market Attractiveness Analysis, by Distribution Channel, 2026 to 2036
Figure 25: Global PCSK9 Inhibitor Market Revenue (USD Billion), by Hospital Pharmacies, 2021 to 2036
Figure 26: Global PCSK9 Inhibitor Market Revenue (USD Billion), by Retail Pharmacies, 2021 to 2036
Figure 27: Global PCSK9 Inhibitor Market Revenue (USD Billion), by Online Pharmacies, 2021 to 2036
Figure 28: Global PCSK9 Inhibitor Market Value Share Analysis, by Country/Sub-region, 2025 and 2036
Figure 29: Global PCSK9 Inhibitor Market Attractiveness Analysis, by Country/Sub-region, 2026 to 2036
Figure 30: North America PCSK9 Inhibitor Market Value (USD Billion) Forecast, 2021 to 2036
Figure 31: North America PCSK9 Inhibitor Market Value Share Analysis, by Drug Type, 2025 and 2036
Figure 32: North America PCSK9 Inhibitor Market Attractiveness Analysis, by Drug Type, 2026 to 2036
Figure 33: North America PCSK9 Inhibitor Market Value Share Analysis, by Modality, 2025 and 2036
Figure 34: North America PCSK9 Inhibitor Market Attractiveness Analysis, by Modality, 2026 to 2036
Figure 35: North America PCSK9 Inhibitor Market Value Share Analysis, by Indication, 2025 and 2036
Figure 36: North America PCSK9 Inhibitor Market Attractiveness Analysis, by Indication, 2026 to 2036
Figure 37: North America PCSK9 Inhibitor Market Value Share Analysis, by Route of Administration, 2025 and 2036
Figure 38: North America PCSK9 Inhibitor Market Attractiveness Analysis, by Route of Administration, 2026 to 2036
Figure 39: North America PCSK9 Inhibitor Market Value Share Analysis, by Distribution Channel, 2025 and 2036
Figure 40: North America PCSK9 Inhibitor Market Attractiveness Analysis, by Distribution Channel, 2026 to 2036
Figure 41: North America PCSK9 Inhibitor Market Value Share Analysis, by Country/Sub-region, 2025 and 2036
Figure 42: North America PCSK9 Inhibitor Market Attractiveness Analysis, by Country/Sub-region, 2026 to 2036
Figure 43: U.S. PCSK9 Inhibitor Market Value (USD Billion) Forecast, 2021 to 2036
Figure 44: U.S. PCSK9 Inhibitor Market Value Share Analysis, by Drug Type, 2025 and 2036
Figure 45: U.S. PCSK9 Inhibitor Market Attractiveness Analysis, by Drug Type, 2026 to 2036
Figure 46: U.S. PCSK9 Inhibitor Market Value Share Analysis, by Modality, 2025 and 2036
Figure 47: U.S. PCSK9 Inhibitor Market Attractiveness Analysis, by Modality, 2026 to 2036
Figure 48: U.S. PCSK9 Inhibitor Market Value Share Analysis, by Indication, 2025 and 2036
Figure 49: U.S. PCSK9 Inhibitor Market Attractiveness Analysis, by Indication, 2026 to 2036
Figure 50: U.S. PCSK9 Inhibitor Market Value Share Analysis, by Route of Administration, 2025 and 2036
Figure 51: U.S. PCSK9 Inhibitor Market Attractiveness Analysis, by Route of Administration, 2026 to 2036
Figure 52: U.S. PCSK9 Inhibitor Market Value Share Analysis, by Distribution Channel, 2025 and 2036
Figure 53: U.S. PCSK9 Inhibitor Market Attractiveness Analysis, by Distribution Channel, 2026 to 2036
Figure 54: Canada PCSK9 Inhibitor Market Value (USD Billion) Forecast, 2021 to 2036
Figure 55: Canada PCSK9 Inhibitor Market Value Share Analysis, by Drug Type, 2025 and 2036
Figure 56: Canada PCSK9 Inhibitor Market Attractiveness Analysis, by Drug Type, 2026 to 2036
Figure 57: Canada PCSK9 Inhibitor Market Value Share Analysis, by Modality, 2025 and 2036
Figure 58: Canada PCSK9 Inhibitor Market Attractiveness Analysis, by Modality, 2026 to 2036
Figure 59: Canada PCSK9 Inhibitor Market Value Share Analysis, by Indication, 2025 and 2036
Figure 60: Canada PCSK9 Inhibitor Market Attractiveness Analysis, by Indication, 2026 to 2036
Figure 61: Canada PCSK9 Inhibitor Market Value Share Analysis, by Route of Administration, 2025 and 2036
Figure 62: Canada PCSK9 Inhibitor Market Attractiveness Analysis, by Route of Administration, 2026 to 2036
Figure 63: Canada PCSK9 Inhibitor Market Value Share Analysis, by Distribution Channel, 2025 and 2036
Figure 64: Canada PCSK9 Inhibitor Market Attractiveness Analysis, by Distribution Channel, 2026 to 2036
Figure 65: Europe PCSK9 Inhibitor Market Value (USD Billion) Forecast, 2021 to 2036
Figure 66: Europe PCSK9 Inhibitor Market Value Share Analysis, by Drug Type, 2025 and 2036
Figure 67: Europe PCSK9 Inhibitor Market Attractiveness Analysis, by Drug Type, 2026 to 2036
Figure 68: Europe PCSK9 Inhibitor Market Value Share Analysis, by Modality, 2025 and 2036
Figure 69: Europe PCSK9 Inhibitor Market Attractiveness Analysis, by Modality, 2026 to 2036
Figure 70: Europe PCSK9 Inhibitor Market Value Share Analysis, by Indication, 2025 and 2036
Figure 71: Europe PCSK9 Inhibitor Market Attractiveness Analysis, by Indication, 2026 to 2036
Figure 72: Europe PCSK9 Inhibitor Market Value Share Analysis, by Route of Administration, 2025 and 2036
Figure 73: Europe PCSK9 Inhibitor Market Attractiveness Analysis, by Route of Administration, 2026 to 2036
Figure 74: Europe PCSK9 Inhibitor Market Value Share Analysis, by Distribution Channel, 2025 and 2036
Figure 75: Europe PCSK9 Inhibitor Market Attractiveness Analysis, by Distribution Channel, 2026 to 2036
Figure 76: Europe PCSK9 Inhibitor Market Value Share Analysis, by Country/Sub-region, 2025 and 2036
Figure 77: Europe PCSK9 Inhibitor Market Attractiveness Analysis, by Country/Sub-region, 2026 to 2036
Figure 78: Germany PCSK9 Inhibitor Market Value (USD Billion) Forecast, 2021 to 2036
Figure 79: Germany PCSK9 Inhibitor Market Value Share Analysis, by Drug Type, 2025 and 2036
Figure 80: Germany PCSK9 Inhibitor Market Attractiveness Analysis, by Drug Type, 2026 to 2036
Figure 81: Germany PCSK9 Inhibitor Market Value Share Analysis, by Modality, 2025 and 2036
Figure 82: Germany PCSK9 Inhibitor Market Attractiveness Analysis, by Modality, 2026 to 2036
Figure 83: Germany PCSK9 Inhibitor Market Value Share Analysis, by Indication, 2025 and 2036
Figure 84: Germany PCSK9 Inhibitor Market Attractiveness Analysis, by Indication, 2026 to 2036
Figure 85: Germany PCSK9 Inhibitor Market Value Share Analysis, by Route of Administration, 2025 and 2036
Figure 86: Germany PCSK9 Inhibitor Market Attractiveness Analysis, by Route of Administration, 2026 to 2036
Figure 87: Germany PCSK9 Inhibitor Market Value Share Analysis, by Distribution Channel, 2025 and 2036
Figure 88: Germany PCSK9 Inhibitor Market Attractiveness Analysis, by Distribution Channel, 2026 to 2036
Figure 89: U.K. PCSK9 Inhibitor Market Value (USD Billion) Forecast, 2021 to 2036
Figure 90: U.K. PCSK9 Inhibitor Market Value Share Analysis, by Drug Type, 2025 and 2036
Figure 91: U.K. PCSK9 Inhibitor Market Attractiveness Analysis, by Drug Type, 2026 to 2036
Figure 92: U.K. PCSK9 Inhibitor Market Value Share Analysis, by Modality, 2025 and 2036
Figure 93: U.K. PCSK9 Inhibitor Market Attractiveness Analysis, by Modality, 2026 to 2036
Figure 94: U.K. PCSK9 Inhibitor Market Value Share Analysis, by Indication, 2025 and 2036
Figure 95: U.K. PCSK9 Inhibitor Market Attractiveness Analysis, by Indication, 2026 to 2036
Figure 96: U.K. PCSK9 Inhibitor Market Value Share Analysis, by Route of Administration, 2025 and 2036
Figure 97: U.K. PCSK9 Inhibitor Market Attractiveness Analysis, by Route of Administration, 2026 to 2036
Figure 98: U.K. PCSK9 Inhibitor Market Value Share Analysis, by Distribution Channel, 2025 and 2036
Figure 99: U.K. PCSK9 Inhibitor Market Attractiveness Analysis, by Distribution Channel, 2026 to 2036
Figure 100: France PCSK9 Inhibitor Market Value (USD Billion) Forecast, 2021 to 2036
Figure 101: France PCSK9 Inhibitor Market Value Share Analysis, by Drug Type, 2025 and 2036
Figure 102: France PCSK9 Inhibitor Market Attractiveness Analysis, by Drug Type, 2026 to 2036
Figure 103: France PCSK9 Inhibitor Market Value Share Analysis, by Modality, 2025 and 2036
Figure 104: France PCSK9 Inhibitor Market Attractiveness Analysis, by Modality, 2026 to 2036
Figure 105: France PCSK9 Inhibitor Market Value Share Analysis, by Indication, 2025 and 2036
Figure 106: France PCSK9 Inhibitor Market Attractiveness Analysis, by Indication, 2026 to 2036
Figure 107: France PCSK9 Inhibitor Market Value Share Analysis, by Route of Administration, 2025 and 2036
Figure 108: France PCSK9 Inhibitor Market Attractiveness Analysis, by Route of Administration, 2026 to 2036
Figure 109: France PCSK9 Inhibitor Market Value Share Analysis, by Distribution Channel, 2025 and 2036
Figure 110: France PCSK9 Inhibitor Market Attractiveness Analysis, by Distribution Channel, 2026 to 2036
Figure 111: Italy PCSK9 Inhibitor Market Value (USD Billion) Forecast, 2021 to 2036
Figure 112: Italy PCSK9 Inhibitor Market Value Share Analysis, by Drug Type, 2025 and 2036
Figure 113: Italy PCSK9 Inhibitor Market Attractiveness Analysis, by Drug Type, 2026 to 2036
Figure 114: Italy PCSK9 Inhibitor Market Value Share Analysis, by Modality, 2025 and 2036
Figure 115: Italy PCSK9 Inhibitor Market Attractiveness Analysis, by Modality, 2026 to 2036
Figure 116: Italy PCSK9 Inhibitor Market Value Share Analysis, by Indication, 2025 and 2036
Figure 117: Italy PCSK9 Inhibitor Market Attractiveness Analysis, by Indication, 2026 to 2036
Figure 118: Italy PCSK9 Inhibitor Market Value Share Analysis, by Route of Administration, 2025 and 2036
Figure 119: Italy PCSK9 Inhibitor Market Attractiveness Analysis, by Route of Administration, 2026 to 2036
Figure 120: Italy PCSK9 Inhibitor Market Value Share Analysis, by Distribution Channel, 2025 and 2036
Figure 121: Italy PCSK9 Inhibitor Market Attractiveness Analysis, by Distribution Channel, 2026 to 2036
Figure 122: Spain PCSK9 Inhibitor Market Value (USD Billion) Forecast, 2021 to 2036
Figure 123: Spain PCSK9 Inhibitor Market Value Share Analysis, by Drug Type, 2025 and 2036
Figure 124: Spain PCSK9 Inhibitor Market Attractiveness Analysis, by Drug Type, 2026 to 2036
Figure 125: Spain PCSK9 Inhibitor Market Value Share Analysis, by Modality, 2025 and 2036
Figure 126: Spain PCSK9 Inhibitor Market Attractiveness Analysis, by Modality, 2026 to 2036
Figure 127: Spain PCSK9 Inhibitor Market Value Share Analysis, by Indication, 2025 and 2036
Figure 128: Spain PCSK9 Inhibitor Market Attractiveness Analysis, by Indication, 2026 to 2036
Figure 129: Spain PCSK9 Inhibitor Market Value Share Analysis, by Route of Administration, 2025 and 2036
Figure 130: Spain PCSK9 Inhibitor Market Attractiveness Analysis, by Route of Administration, 2026 to 2036
Figure 131: Spain PCSK9 Inhibitor Market Value Share Analysis, by Distribution Channel, 2025 and 2036
Figure 132: Spain PCSK9 Inhibitor Market Attractiveness Analysis, by Distribution Channel, 2026 to 2036
Figure 133: The Netherlands PCSK9 Inhibitor Market Value (USD Billion) Forecast, 2021 to 2036
Figure 134: The Netherlands PCSK9 Inhibitor Market Value Share Analysis, by Drug Type, 2025 and 2036
Figure 135: The Netherlands PCSK9 Inhibitor Market Attractiveness Analysis, by Drug Type, 2026 to 2036
Figure 136: The Netherlands PCSK9 Inhibitor Market Value Share Analysis, by Modality, 2025 and 2036
Figure 137: The Netherlands PCSK9 Inhibitor Market Attractiveness Analysis, by Modality, 2026 to 2036
Figure 138: The Netherlands PCSK9 Inhibitor Market Value Share Analysis, by Indication, 2025 and 2036
Figure 139: The Netherlands PCSK9 Inhibitor Market Attractiveness Analysis, by Indication, 2026 to 2036
Figure 140: The Netherlands PCSK9 Inhibitor Market Value Share Analysis, by Route of Administration, 2025 and 2036
Figure 141: The Netherlands PCSK9 Inhibitor Market Attractiveness Analysis, by Route of Administration, 2026 to 2036
Figure 142: The Netherlands PCSK9 Inhibitor Market Value Share Analysis, by Distribution Channel, 2025 and 2036
Figure 143: The Netherlands PCSK9 Inhibitor Market Attractiveness Analysis, by Distribution Channel, 2026 to 2036
Figure 144: Switzerland PCSK9 Inhibitor Market Value (USD Billion) Forecast, 2021 to 2036
Figure 145: Switzerland PCSK9 Inhibitor Market Value Share Analysis, by Drug Type, 2025 and 2036
Figure 146: Switzerland PCSK9 Inhibitor Market Attractiveness Analysis, by Drug Type, 2026 to 2036
Figure 147: Switzerland PCSK9 Inhibitor Market Value Share Analysis, by Modality, 2025 and 2036
Figure 148: Switzerland PCSK9 Inhibitor Market Attractiveness Analysis, by Modality, 2026 to 2036
Figure 149: Switzerland PCSK9 Inhibitor Market Value Share Analysis, by Indication, 2025 and 2036
Figure 150: Switzerland PCSK9 Inhibitor Market Attractiveness Analysis, by Indication, 2026 to 2036
Figure 151: Switzerland PCSK9 Inhibitor Market Value Share Analysis, by Route of Administration, 2025 and 2036
Figure 152: Switzerland PCSK9 Inhibitor Market Attractiveness Analysis, by Route of Administration, 2026 to 2036
Figure 153: Switzerland PCSK9 Inhibitor Market Value Share Analysis, by Distribution Channel, 2025 and 2036
Figure 154: Switzerland PCSK9 Inhibitor Market Attractiveness Analysis, by Distribution Channel, 2026 to 2036
Figure 155: Rest of Europe PCSK9 Inhibitor Market Value (USD Billion) Forecast, 2021 to 2036
Figure 156: Rest of Europe PCSK9 Inhibitor Market Value Share Analysis, by Drug Type, 2025 and 2036
Figure 157: Rest of Europe PCSK9 Inhibitor Market Attractiveness Analysis, by Drug Type, 2026 to 2036
Figure 158: Rest of Europe PCSK9 Inhibitor Market Value Share Analysis, by Modality, 2025 and 2036
Figure 159: Rest of Europe PCSK9 Inhibitor Market Attractiveness Analysis, by Modality, 2026 to 2036
Figure 160: Rest of Europe PCSK9 Inhibitor Market Value Share Analysis, by Indication, 2025 and 2036
Figure 161: Rest of Europe PCSK9 Inhibitor Market Attractiveness Analysis, by Indication, 2026 to 2036
Figure 162: Rest of Europe PCSK9 Inhibitor Market Value Share Analysis, by Route of Administration, 2025 and 2036
Figure 163: Rest of Europe PCSK9 Inhibitor Market Attractiveness Analysis, by Route of Administration, 2026 to 2036
Figure 164: Rest of Europe PCSK9 Inhibitor Market Value Share Analysis, by Distribution Channel, 2025 and 2036
Figure 165: Rest of Europe PCSK9 Inhibitor Market Attractiveness Analysis, by Distribution Channel, 2026 to 2036
Figure 166: Asia Pacific PCSK9 Inhibitor Market Value (USD Billion) Forecast, 2021 to 2036
Figure 167: Asia Pacific PCSK9 Inhibitor Market Value Share Analysis, by Drug Type, 2025 and 2036
Figure 168: Asia Pacific PCSK9 Inhibitor Market Attractiveness Analysis, by Drug Type, 2026 to 2036
Figure 169: Asia Pacific PCSK9 Inhibitor Market Value Share Analysis, by Modality, 2025 and 2036
Figure 170: Asia Pacific PCSK9 Inhibitor Market Attractiveness Analysis, by Modality, 2026 to 2036
Figure 171: Asia Pacific PCSK9 Inhibitor Market Value Share Analysis, by Indication, 2025 and 2036
Figure 172: Asia Pacific PCSK9 Inhibitor Market Attractiveness Analysis, by Indication, 2026 to 2036
Figure 173: Asia Pacific PCSK9 Inhibitor Market Value Share Analysis, by Route of Administration, 2025 and 2036
Figure 174: Asia Pacific PCSK9 Inhibitor Market Attractiveness Analysis, by Route of Administration, 2026 to 2036
Figure 175: Asia Pacific PCSK9 Inhibitor Market Value Share Analysis, by Distribution Channel, 2025 and 2036
Figure 176: Asia Pacific PCSK9 Inhibitor Market Attractiveness Analysis, by Distribution Channel, 2026 to 2036
Figure 177: Asia Pacific PCSK9 Inhibitor Market Value Share Analysis, by Country/Sub-region, 2025 and 2036
Figure 178: Asia Pacific PCSK9 Inhibitor Market Attractiveness Analysis, by Country/Sub-region, 2026 to 2036
Figure 179: China PCSK9 Inhibitor Market Value (USD Billion) Forecast, 2021 to 2036
Figure 180: China PCSK9 Inhibitor Market Value Share Analysis, by Drug Type, 2025 and 2036
Figure 181: China PCSK9 Inhibitor Market Attractiveness Analysis, by Drug Type, 2026 to 2036
Figure 182: China PCSK9 Inhibitor Market Value Share Analysis, by Modality, 2025 and 2036
Figure 183: China PCSK9 Inhibitor Market Attractiveness Analysis, by Modality, 2026 to 2036
Figure 184: China PCSK9 Inhibitor Market Value Share Analysis, by Indication, 2025 and 2036
Figure 185: China PCSK9 Inhibitor Market Attractiveness Analysis, by Indication, 2026 to 2036
Figure 186: China PCSK9 Inhibitor Market Value Share Analysis, by Route of Administration, 2025 and 2036
Figure 187: China PCSK9 Inhibitor Market Attractiveness Analysis, by Route of Administration, 2026 to 2036
Figure 188: China PCSK9 Inhibitor Market Value Share Analysis, by Distribution Channel, 2025 and 2036
Figure 189: China PCSK9 Inhibitor Market Attractiveness Analysis, by Distribution Channel, 2026 to 2036
Figure 190: Japan PCSK9 Inhibitor Market Value (USD Billion) Forecast, 2021 to 2036
Figure 191: Japan PCSK9 Inhibitor Market Value Share Analysis, by Drug Type, 2025 and 2036
Figure 192: Japan PCSK9 Inhibitor Market Attractiveness Analysis, by Drug Type, 2026 to 2036
Figure 193: Japan PCSK9 Inhibitor Market Value Share Analysis, by Modality, 2025 and 2036
Figure 194: Japan PCSK9 Inhibitor Market Attractiveness Analysis, by Modality, 2026 to 2036
Figure 195: Japan PCSK9 Inhibitor Market Value Share Analysis, by Indication, 2025 and 2036
Figure 196: Japan PCSK9 Inhibitor Market Attractiveness Analysis, by Indication, 2026 to 2036
Figure 197: Japan PCSK9 Inhibitor Market Value Share Analysis, by Route of Administration, 2025 and 2036
Figure 198: Japan PCSK9 Inhibitor Market Attractiveness Analysis, by Route of Administration, 2026 to 2036
Figure 199: Japan PCSK9 Inhibitor Market Value Share Analysis, by Distribution Channel, 2025 and 2036
Figure 200: Japan PCSK9 Inhibitor Market Attractiveness Analysis, by Distribution Channel, 2026 to 2036
Figure 201: India PCSK9 Inhibitor Market Value (USD Billion) Forecast, 2021 to 2036
Figure 202: India PCSK9 Inhibitor Market Value Share Analysis, by Drug Type, 2025 and 2036
Figure 203: India PCSK9 Inhibitor Market Attractiveness Analysis, by Drug Type, 2026 to 2036
Figure 204: India PCSK9 Inhibitor Market Value Share Analysis, by Modality, 2025 and 2036
Figure 205: India PCSK9 Inhibitor Market Attractiveness Analysis, by Modality, 2026 to 2036
Figure 206: India PCSK9 Inhibitor Market Value Share Analysis, by Indication, 2025 and 2036
Figure 207: India PCSK9 Inhibitor Market Attractiveness Analysis, by Indication, 2026 to 2036
Figure 208: India PCSK9 Inhibitor Market Value Share Analysis, by Route of Administration, 2025 and 2036
Figure 209: India PCSK9 Inhibitor Market Attractiveness Analysis, by Route of Administration, 2026 to 2036
Figure 210: India PCSK9 Inhibitor Market Value Share Analysis, by Distribution Channel, 2025 and 2036
Figure 211: India PCSK9 Inhibitor Market Attractiveness Analysis, by Distribution Channel, 2026 to 2036
Figure 212: South Korea PCSK9 Inhibitor Market Value (USD Billion) Forecast, 2021 to 2036
Figure 213: South Korea PCSK9 Inhibitor Market Value Share Analysis, by Drug Type, 2025 and 2036
Figure 214: South Korea PCSK9 Inhibitor Market Attractiveness Analysis, by Drug Type, 2026 to 2036
Figure 215: South Korea PCSK9 Inhibitor Market Value Share Analysis, by Modality, 2025 and 2036
Figure 216: South Korea PCSK9 Inhibitor Market Attractiveness Analysis, by Modality, 2026 to 2036
Figure 217: South Korea PCSK9 Inhibitor Market Value Share Analysis, by Indication, 2025 and 2036
Figure 218: South Korea PCSK9 Inhibitor Market Attractiveness Analysis, by Indication, 2026 to 2036
Figure 219: South Korea PCSK9 Inhibitor Market Value Share Analysis, by Route of Administration, 2025 and 2036
Figure 220: South Korea PCSK9 Inhibitor Market Attractiveness Analysis, by Route of Administration, 2026 to 2036
Figure 221: South Korea PCSK9 Inhibitor Market Value Share Analysis, by Distribution Channel, 2025 and 2036
Figure 222: South Korea PCSK9 Inhibitor Market Attractiveness Analysis, by Distribution Channel, 2026 to 2036
Figure 223: Australia and New Zealand PCSK9 Inhibitor Market Value (USD Billion) Forecast, 2021 to 2036
Figure 224: Australia and New Zealand PCSK9 Inhibitor Market Value Share Analysis, by Drug Type, 2025 and 2036
Figure 225: Australia and New Zealand PCSK9 Inhibitor Market Attractiveness Analysis, by Drug Type, 2026 to 2036
Figure 226: Australia and New Zealand PCSK9 Inhibitor Market Value Share Analysis, by Modality, 2025 and 2036
Figure 227: Australia and New Zealand PCSK9 Inhibitor Market Attractiveness Analysis, by Modality, 2026 to 2036
Figure 228: Australia and New Zealand PCSK9 Inhibitor Market Value Share Analysis, by Indication, 2025 and 2036
Figure 229: Australia and New Zealand PCSK9 Inhibitor Market Attractiveness Analysis, by Indication, 2026 to 2036
Figure 230: Australia and New Zealand PCSK9 Inhibitor Market Value Share Analysis, by Route of Administration, 2025 and 2036
Figure 231: Australia and New Zealand PCSK9 Inhibitor Market Attractiveness Analysis, by Route of Administration, 2026 to 2036
Figure 232: Australia and New Zealand PCSK9 Inhibitor Market Value Share Analysis, by Distribution Channel, 2025 and 2036
Figure 233: Australia and New Zealand PCSK9 Inhibitor Market Attractiveness Analysis, by Distribution Channel, 2026 to 2036
Figure 234: Rest of Asia Pacific PCSK9 Inhibitor Market Value (USD Billion) Forecast, 2021 to 2036
Figure 235: Rest of Asia Pacific PCSK9 Inhibitor Market Value Share Analysis, by Drug Type, 2025 and 2036
Figure 236: Rest of Asia Pacific PCSK9 Inhibitor Market Attractiveness Analysis, by Drug Type, 2026 to 2036
Figure 237: Rest of Asia Pacific PCSK9 Inhibitor Market Value Share Analysis, by Modality, 2025 and 2036
Figure 238: Rest of Asia Pacific PCSK9 Inhibitor Market Attractiveness Analysis, by Modality, 2026 to 2036
Figure 239: Rest of Asia Pacific PCSK9 Inhibitor Market Value Share Analysis, by Indication, 2025 and 2036
Figure 240: Rest of Asia Pacific PCSK9 Inhibitor Market Attractiveness Analysis, by Indication, 2026 to 2036
Figure 241: Rest of Asia Pacific PCSK9 Inhibitor Market Value Share Analysis, by Route of Administration, 2025 and 2036
Figure 242: Rest of Asia Pacific PCSK9 Inhibitor Market Attractiveness Analysis, by Route of Administration, 2026 to 2036
Figure 243: Rest of Asia Pacific PCSK9 Inhibitor Market Value Share Analysis, by Distribution Channel, 2025 and 2036
Figure 244: Rest of Asia Pacific PCSK9 Inhibitor Market Attractiveness Analysis, by Distribution Channel, 2026 to 2036
Figure 245: Latin America PCSK9 Inhibitor Market Value (USD Billion) Forecast, 2021 to 2036
Figure 246: Latin America PCSK9 Inhibitor Market Value Share Analysis, by Drug Type, 2025 and 2036
Figure 247: Latin America PCSK9 Inhibitor Market Attractiveness Analysis, by Drug Type, 2026 to 2036
Figure 248: Latin America PCSK9 Inhibitor Market Value Share Analysis, by Modality, 2025 and 2036
Figure 249: Latin America PCSK9 Inhibitor Market Attractiveness Analysis, by Modality, 2026 to 2036
Figure 250: Latin America PCSK9 Inhibitor Market Value Share Analysis, by Indication, 2025 and 2036
Figure 251: Latin America PCSK9 Inhibitor Market Attractiveness Analysis, by Indication, 2026 to 2036
Figure 252: Latin America PCSK9 Inhibitor Market Value Share Analysis, by Route of Administration, 2025 and 2036
Figure 253: Latin America PCSK9 Inhibitor Market Attractiveness Analysis, by Route of Administration, 2026 to 2036
Figure 254: Latin America PCSK9 Inhibitor Market Value Share Analysis, by Distribution Channel, 2025 and 2036
Figure 255: Latin America PCSK9 Inhibitor Market Attractiveness Analysis, by Distribution Channel, 2026 to 2036
Figure 256: Latin America PCSK9 Inhibitor Market Value Share Analysis, by Country/Sub-region, 2025 and 2036
Figure 257: Latin America PCSK9 Inhibitor Market Attractiveness Analysis, by Country/Sub-region, 2026 to 2036
Figure 258: Brazil PCSK9 Inhibitor Market Value (USD Billion) Forecast, 2021 to 2036
Figure 259: Brazil PCSK9 Inhibitor Market Value Share Analysis, by Drug Type, 2025 and 2036
Figure 260: Brazil PCSK9 Inhibitor Market Attractiveness Analysis, by Drug Type, 2026 to 2036
Figure 261: Brazil PCSK9 Inhibitor Market Value Share Analysis, by Modality, 2025 and 2036
Figure 262: Brazil PCSK9 Inhibitor Market Attractiveness Analysis, by Modality, 2026 to 2036
Figure 263: Brazil PCSK9 Inhibitor Market Value Share Analysis, by Indication, 2025 and 2036
Figure 264: Brazil PCSK9 Inhibitor Market Attractiveness Analysis, by Indication, 2026 to 2036
Figure 265: Brazil PCSK9 Inhibitor Market Value Share Analysis, by Route of Administration, 2025 and 2036
Figure 266: Brazil PCSK9 Inhibitor Market Attractiveness Analysis, by Route of Administration, 2026 to 2036
Figure 267: Brazil PCSK9 Inhibitor Market Value Share Analysis, by Distribution Channel, 2025 and 2036
Figure 268: Brazil PCSK9 Inhibitor Market Attractiveness Analysis, by Distribution Channel, 2026 to 2036
Figure 269: Mexico PCSK9 Inhibitor Market Value (USD Billion) Forecast, 2021 to 2036
Figure 270: Mexico PCSK9 Inhibitor Market Value Share Analysis, by Drug Type, 2025 and 2036
Figure 271: Mexico PCSK9 Inhibitor Market Attractiveness Analysis, by Drug Type, 2026 to 2036
Figure 272: Mexico PCSK9 Inhibitor Market Value Share Analysis, by Modality, 2025 and 2036
Figure 273: Mexico PCSK9 Inhibitor Market Attractiveness Analysis, by Modality, 2026 to 2036
Figure 274: Mexico PCSK9 Inhibitor Market Value Share Analysis, by Indication, 2025 and 2036
Figure 275: Mexico PCSK9 Inhibitor Market Attractiveness Analysis, by Indication, 2026 to 2036
Figure 276: Mexico PCSK9 Inhibitor Market Value Share Analysis, by Route of Administration, 2025 and 2036
Figure 277: Mexico PCSK9 Inhibitor Market Attractiveness Analysis, by Route of Administration, 2026 to 2036
Figure 278: Mexico PCSK9 Inhibitor Market Value Share Analysis, by Distribution Channel, 2025 and 2036
Figure 279: Mexico PCSK9 Inhibitor Market Attractiveness Analysis, by Distribution Channel, 2026 to 2036
Figure 280: Argentina PCSK9 Inhibitor Market Value (USD Billion) Forecast, 2021 to 2036
Figure 281: Argentina PCSK9 Inhibitor Market Value Share Analysis, by Drug Type, 2025 and 2036
Figure 282: Argentina PCSK9 Inhibitor Market Attractiveness Analysis, by Drug Type, 2026 to 2036
Figure 283: Argentina PCSK9 Inhibitor Market Value Share Analysis, by Modality, 2025 and 2036
Figure 284: Argentina PCSK9 Inhibitor Market Attractiveness Analysis, by Modality, 2026 to 2036
Figure 285: Argentina PCSK9 Inhibitor Market Value Share Analysis, by Indication, 2025 and 2036
Figure 286: Argentina PCSK9 Inhibitor Market Attractiveness Analysis, by Indication, 2026 to 2036
Figure 287: Argentina PCSK9 Inhibitor Market Value Share Analysis, by Route of Administration, 2025 and 2036
Figure 288: Argentina PCSK9 Inhibitor Market Attractiveness Analysis, by Route of Administration, 2026 to 2036
Figure 289: Argentina PCSK9 Inhibitor Market Value Share Analysis, by Distribution Channel, 2025 and 2036
Figure 290: Argentina PCSK9 Inhibitor Market Attractiveness Analysis, by Distribution Channel, 2026 to 2036
Figure 291: Rest of Latin America PCSK9 Inhibitor Market Value (USD Billion) Forecast, 2021 to 2036
Figure 292: Rest of Latin America PCSK9 Inhibitor Market Value Share Analysis, by Drug Type, 2025 and 2036
Figure 293: Rest of Latin America PCSK9 Inhibitor Market Attractiveness Analysis, by Drug Type, 2026 to 2036
Figure 294: Rest of Latin America PCSK9 Inhibitor Market Value Share Analysis, by Modality, 2025 and 2036
Figure 295: Rest of Latin America PCSK9 Inhibitor Market Attractiveness Analysis, by Modality, 2026 to 2036
Figure 296: Rest of Latin America PCSK9 Inhibitor Market Value Share Analysis, by Indication, 2025 and 2036
Figure 297: Rest of Latin America PCSK9 Inhibitor Market Attractiveness Analysis, by Indication, 2026 to 2036
Figure 298: Rest of Latin America PCSK9 Inhibitor Market Value Share Analysis, by Route of Administration, 2025 and 2036
Figure 299: Rest of Latin America PCSK9 Inhibitor Market Attractiveness Analysis, by Route of Administration, 2026 to 2036
Figure 300: Rest of Latin America PCSK9 Inhibitor Market Value Share Analysis, by Distribution Channel, 2025 and 2036
Figure 301: Rest of Latin America PCSK9 Inhibitor Market Attractiveness Analysis, by Distribution Channel, 2026 to 2036
Figure 302: Middle East and Africa PCSK9 Inhibitor Market Value (USD Billion) Forecast, 2021 to 2036
Figure 303: Middle East and Africa PCSK9 Inhibitor Market Value Share Analysis, by Drug Type, 2025 and 2036
Figure 304: Middle East and Africa PCSK9 Inhibitor Market Attractiveness Analysis, by Drug Type, 2026 to 2036
Figure 305: Middle East and Africa PCSK9 Inhibitor Market Value Share Analysis, by Modality, 2025 and 2036
Figure 306: Middle East and Africa PCSK9 Inhibitor Market Attractiveness Analysis, by Modality, 2026 to 2036
Figure 307: Middle East and Africa PCSK9 Inhibitor Market Value Share Analysis, by Indication, 2025 and 2036
Figure 308: Middle East and Africa PCSK9 Inhibitor Market Attractiveness Analysis, by Indication, 2026 to 2036
Figure 309: Middle East and Africa PCSK9 Inhibitor Market Value Share Analysis, by Route of Administration, 2025 and 2036
Figure 310: Middle East and Africa PCSK9 Inhibitor Market Attractiveness Analysis, by Route of Administration, 2026 to 2036
Figure 311: Middle East and Africa PCSK9 Inhibitor Market Value Share Analysis, by Distribution Channel, 2025 and 2036
Figure 312: Middle East and Africa PCSK9 Inhibitor Market Attractiveness Analysis, by Distribution Channel, 2026 to 2036
Figure 313: Middle East and Africa PCSK9 Inhibitor Market Value Share Analysis, by Country/Sub-region, 2025 and 2036
Figure 314: Middle East and Africa PCSK9 Inhibitor Market Attractiveness Analysis, by Country/Sub-region, 2026 to 2036
Figure 315: GCC Countries PCSK9 Inhibitor Market Value (USD Billion) Forecast, 2021 to 2036
Figure 316: GCC Countries PCSK9 Inhibitor Market Value Share Analysis, by Drug Type, 2025 and 2036
Figure 317: GCC Countries PCSK9 Inhibitor Market Attractiveness Analysis, by Drug Type, 2026 to 2036
Figure 318: GCC Countries PCSK9 Inhibitor Market Value Share Analysis, by Modality, 2025 and 2036
Figure 319: GCC Countries PCSK9 Inhibitor Market Attractiveness Analysis, by Modality, 2026 to 2036
Figure 320: GCC Countries PCSK9 Inhibitor Market Value Share Analysis, by Indication, 2025 and 2036
Figure 321: GCC Countries PCSK9 Inhibitor Market Attractiveness Analysis, by Indication, 2026 to 2036
Figure 322: GCC Countries PCSK9 Inhibitor Market Value Share Analysis, by Route of Administration, 2025 and 2036
Figure 323: GCC Countries PCSK9 Inhibitor Market Attractiveness Analysis, by Route of Administration, 2026 to 2036
Figure 324: GCC Countries PCSK9 Inhibitor Market Value Share Analysis, by Distribution Channel, 2025 and 2036
Figure 325: GCC Countries PCSK9 Inhibitor Market Attractiveness Analysis, by Distribution Channel, 2026 to 2036
Figure 326: South Africa PCSK9 Inhibitor Market Value (USD Billion) Forecast, 2021 to 2036
Figure 327: South Africa PCSK9 Inhibitor Market Value Share Analysis, by Drug Type, 2025 and 2036
Figure 328: South Africa PCSK9 Inhibitor Market Attractiveness Analysis, by Drug Type, 2026 to 2036
Figure 329: South Africa PCSK9 Inhibitor Market Value Share Analysis, by Modality, 2025 and 2036
Figure 330: South Africa PCSK9 Inhibitor Market Attractiveness Analysis, by Modality, 2026 to 2036
Figure 331: South Africa PCSK9 Inhibitor Market Value Share Analysis, by Indication, 2025 and 2036
Figure 332: South Africa PCSK9 Inhibitor Market Attractiveness Analysis, by Indication, 2026 to 2036
Figure 333: South Africa PCSK9 Inhibitor Market Value Share Analysis, by Route of Administration, 2025 and 2036
Figure 334: South Africa PCSK9 Inhibitor Market Attractiveness Analysis, by Route of Administration, 2026 to 2036
Figure 335: South Africa PCSK9 Inhibitor Market Value Share Analysis, by Distribution Channel, 2025 and 2036
Figure 336: South Africa PCSK9 Inhibitor Market Attractiveness Analysis, by Distribution Channel, 2026 to 2036
Figure 337: Rest of Middle East and Africa PCSK9 Inhibitor Market Value (USD Billion) Forecast, 2021 to 2036
Figure 338: Rest of Middle East and Africa PCSK9 Inhibitor Market Value Share Analysis, by Drug Type, 2025 and 2036
Figure 339: Rest of Middle East and Africa PCSK9 Inhibitor Market Attractiveness Analysis, by Drug Type, 2026 to 2036
Figure 340: Rest of Middle East and Africa PCSK9 Inhibitor Market Value Share Analysis, by Modality, 2025 and 2036
Figure 341: Rest of Middle East and Africa PCSK9 Inhibitor Market Attractiveness Analysis, by Modality, 2026 to 2036
Figure 342: Rest of Middle East and Africa PCSK9 Inhibitor Market Value Share Analysis, by Indication, 2025 and 2036
Figure 343: Rest of Middle East and Africa PCSK9 Inhibitor Market Attractiveness Analysis, by Indication, 2026 to 2036
Figure 344: Rest of Middle East and Africa PCSK9 Inhibitor Market Value Share Analysis, by Route of Administration, 2025 and 2036
Figure 345: Rest of Middle East and Africa PCSK9 Inhibitor Market Attractiveness Analysis, by Route of Administration, 2026 to 2036
Figure 346: Rest of Middle East and Africa PCSK9 Inhibitor Market Value Share Analysis, by Distribution Channel, 2025 and 2036
Figure 347: Rest of Middle East and Africa PCSK9 Inhibitor Market Attractiveness Analysis, by Distribution Channel, 2026 to 2036
Copyright © Transparency Market Research, Inc. All Rights reserved
Trust Online


PCSK9 Inhibitor Market
