
Reports
Reports
The prevailing unhealthy food habits and hectic lifestyle of consumers across the world are the primary drivers of the global migraine drugs market. Further, the growing population and increasing awareness among consumers regarding the availability of the migraine treatment drugs are prominent factors fueling the growth in the global migraine drugs market. Furthermore, development of advanced drugs by the migraine drugs manufacturers is some other factor influencing growth in the market.
As per the Transparency Market Research, the global migraine drugs market reached a value of US$2.72 bn in 2016 and is expected to reach a value of US$3.72 bn by 2025. The global migraine drugs market is expected to register a steady CAGR 3.50% between 2017 and 2025. The market is mainly segmented into three segments namely Treatment, Route of Administration, and Distribution Channel.
Development of Advanced Migraine Drugs to Boost Growth of Migraine Drugs Market
From the perspective of treatment, the global migraine drugs market is divided into- Abortive, and Prophylactic segments. Further, Abortive segment is classified into triptans, alkoids, ergot and others based on the drug class. While prophylactic treatment is segmented into botulinum toxin, topiramate and others. Among these treatment segments, abortive procedure is likely to dominant market share in the global migraine drugs market whereas prophylactic treatment segment is projected to register a healthy growth during the forecast period that is from 2017 to 2025.
On the basis of route of administration segment, the global migraine drugs market is mainly segmented into oral, injectable and others. The other segment of route of administration includes nasal, spray, transdermal, patches and likewise. Among all of them, orally administrable drugs is likely to holds maximum potential for the global migraine market. And this is projected to continue in the upcoming years as well. This is mainly due to the low cost associated with the usage of oral drugs and vast availability of the oral drugs as compared to the other form across the globe. While on the basis of distribution channel the global migraine drugs market is segmented into hospital pharmacy and retail pharmacy.
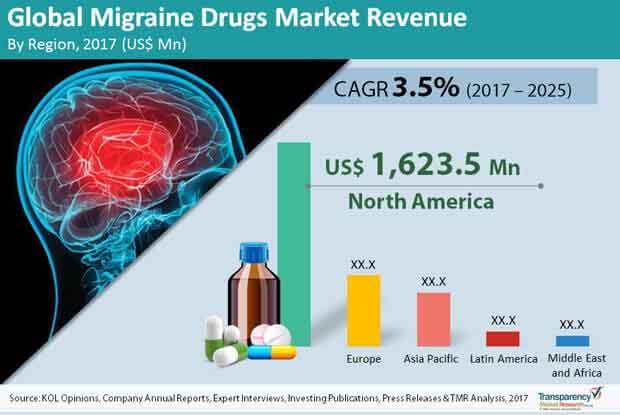
North America Holds Immense Potential in Migraine Drugs Market
Based on Geography the global migraine drugs market segment is classified into five prime regions: North America, Asia Pacific, Europe, Latin America, and the Middle East and Africa. Among all these five region, North America is expected to account highest share in the global migraine drugs market during the upcoming years. This is mainly because of the increasing healthcare investment by the private and government bodies. Apart from this, increasing cases of migraine and easy avaiblity of the specialized migraine treatment are the some other headwinds propelling growth in the market. The region is anticipated to register a healthy 3.40% CAGR between 2017 and 2025.
The global migraine drug market depicts a fragmented competitive landscape owing to the presence of several players in the market. Some of the predominant players in the global migraine drugs market are Novartis AG, GlaxoSmithKline plc., Allergan Plc.,Avanir Pharmaceuticals, Inc., Janssen Pharmaceutical Company and ., Eisai Co.,
Migraine Drugs Market - Snapshot
The migraine drugs market features a fragmented and intensely competitive vendor landscape with the presence of several large players in the fray. To stay competitive, several large players are considering to launch revised version of their existing patent drugs and at the same launch new drugs. Besides this, large players in the migraine drugs market are striving for mergers and collaborations with regional players to consolidate their position in the global migraine drugs market.
North America is a prominent region in the global migraine drugs market. The presence of a well-established pharmaceutical industry in the region is a key factor for strong position of North America in the overall migraine drugs market. Moreover, high awareness for the risks of migraine, and the way it impacts quality of life accounts for substantial demand for migraine drugs in the region.
Meanwhile, the demand for migraine drugs is rising steadily in other key regions too. Firstly, the prevalence of migraine among individuals of all age groups that needs to be subsided with drugs fuels the migraine drugs market. Migraine is related to several factors, including food triggers, environment, hormones, or genetics. Nonetheless, so far, there has not been any line of treatment apart from prescription drugs to subside the pain. This creates massive opportunities in the migraine drugs market. In the coming years too, the migraine drugs market is anticipated to witness outstanding growth to be worth close to four billion dollars in the near future.
Key segments of the migraine drugs market based on treatment type are abortive and prophylactic. The abortive segment is further divided into alkoids, triptans, ergot, and others. On the other hand, prophylactic treatment segment is divided into topiramate, botulinum toxin, and others. The migraine drugs market is studied on the basis of route of administration as well. Oral, injectable, and others (transdermal, nasal spray, patches) are key segments of the migraine drugs market on the basis of route of administration.
1. Preface
1.1. Market Definition and Scope
1.2. Market Segmentation
1.3. Key Research Objectives
1.4. Research Highlights
2. Assumptions and Research Methodology
3. Executive Summary: Global Migraine Drugs Market
4. Market Overview
4.1. Introduction
4.1.1. Product Definition
4.1.2. Industry Evolution / Developments
4.2. Market Overview
4.3. Market Dynamics
4.3.1. Drivers
4.3.1.1. High prevalence of migraine and increasing transition from episodic to chronic migraine
4.3.1.2. Increasing investment in R&D and promising pipeline of novel drugs
4.3.1.3. Aging population and increasing proportion of female population
4.3.1.4. Increasing awareness among patients and high promotional investment by key players
4.3.2. Restraints
4.3.2.1. Fragmented Market with vast availability of generic drugs
4.3.2.2. Ongoing investment in alternative therapies
4.3.3. Opportunities
4.3.4. Trends
4.4. Migraine Drugs Market Analysis and Forecast, 2017 – 2025
4.4.1. Market Revenue Projections (US$ Mn)
4.5. Porter’s five forces analysis
4.6. Value Chain Analysis
4.7. Global Prevalence of Migraine
4.8. Pipeline Analysis
4.8.1. Pipeline Analysis: Migraine Treatment Drugs
4.8.2. Pipeline Analysis: Migraine Treatment Devices
4.9. Market Outlook
5. Global Migraine Drugs Market Analysis and Forecasts, By Treatment
5.1. Introduction & Definition
5.2. Key Findings
5.3. Market Size (US$ Mn) Forecast, By Treatment
5.3.1. Abortive
5.3.1.1. Triptans
5.3.1.2. Ergot Alkaloids
5.3.1.3. Others
5.3.2. Prophylactic
5.3.2.1. Botulinum Toxin
5.3.2.2. Topiramate
5.3.2.3. Others
5.4. New (Pipeline) Migraine Drugs Market Revenue (US$) Forecast, 2017-2025
5.5. Market Attractiveness, By Treatment
5.6. Key Trends
6. Global Migraine Drugs Market Analysis and Forecasts, By Route of Administration
6.1. Introduction & Definition
6.2. Key Findings
6.3. Market Size (US$ Mn) Forecast, By Route of Administration
6.3.1. Oral
6.3.2. Injectable
6.3.3. Other
6.4. Market Attractiveness, By Route of Administration
6.5. Key Trends
7. Global Migraine Drugs Market Analysis and Forecasts, By Distribution Channel
7.1. Introduction & Definition
7.2. Key Findings
7.3. Market Size (US$ Mn) Forecast, By Distribution Chanel
7.3.1. Retail Pharmacies
7.3.2. Hospital Pharmacies
7.3.3. Others
7.4. Market Attractiveness, By Distribution Channel
7.5. Key Trends
8. Global Migraine Drugs Market Analysis and Forecasts, By Region
8.1. Key Findings
8.2. Global Market Scenario
8.3. Market Size (US$ Mn) Forecast, By Region
8.3.1. North America
8.3.2. Europe
8.3.3. Asia Pacific
8.3.4. Latin America
8.3.5. Middle East & Africa
8.4. Market Attractiveness, By Region
8.5. Key Trends, By Region
9. North America Migraine Drugs Market Analysis and Forecast
9.1. Key Findings
9.2. Market Size (US$ Mn) Forecast, By Treatment
9.2.1. Abortive
9.2.1.1. Triptans
9.2.1.2. Ergot Alkaloids
9.2.1.3. Others
9.2.2. Prophylactic
9.2.2.1. Botulinum Toxin
9.2.2.2. Topiramate
9.2.2.3. Others
9.3. Market Size (US$ Mn) Forecast, By Route of Administration
9.3.1. Oral
9.3.2. Injectable
9.3.3. Others
9.4. Market Size (US$ Mn) Forecast, By Distribution Chanel
9.4.1. Retail Pharmacies
9.4.2. Hospital Pharmacies
9.4.3. Others
9.5. Market Size by Value (US$ Mn) Forecast, By Country
9.5.1. U.S.
9.5.2. Canada
9.6. Market Attractiveness Analysis
9.6.1. By Treatment
9.6.2. By Route of Administration
9.6.3. By Distribution Channel
9.6.4. By Country
10. Europe Migraine Drugs Market Analysis and Forecast
10.1. Key Findings
10.2. Market Size (US$ Mn) Forecast, By Treatment
10.2.1. Abortive
10.2.1.1. Triptans
10.2.1.2. Ergot Alkaloids
10.2.1.3. Others
10.2.2. Prophylactic
10.2.2.1. Botulinum Toxin
10.2.2.2. Topiramate
10.2.2.3. Others
10.3. Market Size (US$ Mn) Forecast, By Route of Administration
10.3.1. Oral
10.3.2. Injectable
10.3.3. Others
10.4. Market Size (US$ Mn) Forecast, By Distribution Chanel
10.4.1. Retail Pharmacies
10.4.2. Hospital Pharmacies
10.4.3. Others
10.5. Market Size by Value (US$ Mn) Forecast, By Country
10.5.1. Germany
10.5.2. France
10.5.3. U.K.
10.5.4. Spain
10.5.5. Italy
10.5.6. Rest of Europe
10.6. Market Attractiveness Analysis
10.6.1. By Treatment
10.6.2. By Route of Administration
10.6.3. By Distribution Channel
10.6.4. By Country
11. Asia Pacific Anti-migraine Drugs Market Analysis and Forecast
11.1. Key Findings
11.2. Market Size (US$ Mn) Forecast, By Treatment
11.2.1. Abortive
11.2.1.1. Triptans
11.2.1.2. Ergot Alkaloids
11.2.1.3. Others
11.2.2. Prophylactic
11.2.2.1. Botulinum Toxin
11.2.2.2. Topiramate
11.2.2.3. Others
11.3. Market Size (US$ Mn) Forecast, By Route of Administration
11.3.1. Oral
11.3.2. Injectable
11.3.3. Others
11.4. Market Size (US$ Mn) Forecast, By Distribution Chanel
11.4.1. Retail Pharmacies
11.4.2. Hospital Pharmacies
11.4.3. Others
11.5. Market Size by Value (US$ Mn) Forecast, By Country
11.5.1. India
11.5.2. China
11.5.3. Japan
11.5.4. Australia & New Zealand
11.5.5. Rest of Asia Pacific
11.6. Market Attractiveness Analysis
11.6.1. By Treatment
11.6.2. By Route of Administration
11.6.3. By Distribution Channel
11.6.4. By Country
12. Latin America Anti-migraine Drugs Market Analysis and Forecast
12.1. Key Findings
12.2. Market Size (US$ Mn) Forecast, By Treatment
12.2.1. Abortive
12.2.1.1. Triptans
12.2.1.2. Ergot Alkaloids
12.2.1.3. Others
12.2.2. Prophylactic
12.2.2.1. Botulinum Toxin
12.2.2.2. Topiramate
12.2.2.3. Others
12.3. Market Size (US$ Mn) Forecast, By Route of Administration
12.3.1. Oral
12.3.2. Injectable
12.3.3. Others
12.4. Market Size (US$ Mn) Forecast, By Distribution Chanel
12.4.1. Retail Pharmacies
12.4.2. Hospital Pharmacies
12.4.3. Others
12.5. Market Size by Value (US$ Mn) Forecast, By Country
12.5.1. Brazil
12.5.2. Mexico
12.5.3. Rest of Latin America
12.6. Market Attractiveness Analysis
12.6.1. By Treatment
12.6.2. By Route of Administration
12.6.3. By Distribution Channel
12.6.4. By Country
13. Middle East and Africa Anti-migraine Drugs Market Analysis and Forecast
13.1. Key Findings
13.2. Market Size (US$ Mn) Forecast, By Treatment
13.2.1. Abortive
13.2.1.1. Triptans
13.2.1.2. Ergot Alkaloids
13.2.1.3. Others
13.2.2. Prophylactic
13.2.2.1. Botulinum Toxin
13.2.2.2. Topiramate
13.2.2.3. Others
13.3. Market Size (US$ Mn) Forecast, By Route of Administration
13.3.1. Oral
13.3.2. Injectable
13.3.3. Others
13.4. Market Size (US$ Mn) Forecast, By Distribution Chanel
13.4.1. Retail Pharmacies
13.4.2. Hospital Pharmacies
13.4.3. Others
13.5. Market Size by Value (US$ Mn) Forecast, By Country
13.5.1. Saudi Arabia
13.5.2. South Africa
13.5.3. Israel
13.5.4. Rest of Middle East and Africa
13.6. Market Attractiveness Analysis
13.6.1. By Treatment
13.6.2. By Route of Administration
13.6.3. By Distribution Channel
13.6.4. By Country
14. Competition Landscape
14.1. Market Player – Competition Matrix (By Tier and Size of companies)
14.2. Company Profiles (Details – Overview, Financials, Recent Developments, Strategy)
14.2.1. AstraZeneca Plc.
14.2.1.1. Company Overview (HQ, Business Segments, Employee Strength)
14.2.1.2. Product Portfolio
14.2.1.3. SWOT Analysis
14.2.1.4. Financial Overview
14.2.1.5. Strategic Overview
14.2.2. Allergan Plc.
14.2.2.1. Company Overview (HQ, Business Segments, Employee Strength)
14.2.2.2. Product Portfolio
14.2.2.3. SWOT Analysis
14.2.2.4. Financial Overview
14.2.2.5. Strategic Overview
14.2.3. GlaxoSmithKline Plc.
14.2.3.1. Company Overview (HQ, Business Segments, Employee Strength)
14.2.3.2. Product Portfolio
14.2.3.3. SWOT Analysis
14.2.3.4. Financial Overview
14.2.3.5. Strategic Overview
14.2.4. Novartis AG
14.2.4.1. Company Overview (HQ, Business Segments, Employee Strength)
14.2.4.2. Product Portfolio
14.2.4.3. SWOT Analysis
14.2.4.4. Financial Overview
14.2.4.5. Strategic Overview
14.2.5. Pfizer, Inc.
14.2.5.1. Company Overview (HQ, Business Segments, Employee Strength)
14.2.5.2. Product Portfolio
14.2.5.3. SWOT Analysis
14.2.5.4. Financial Overview
14.2.5.5. Strategic Overview
14.2.6. Valeant Pharmaceuticals International, Inc.
14.2.6.1. Company Overview (HQ, Business Segments, Employee Strength)
14.2.6.2. Product Portfolio
14.2.6.3. SWOT Analysis
14.2.6.4. Financial Overview
14.2.6.5. Strategic Overview
14.2.7. Teva Pharmaceutical Industries, Ltd.
14.2.7.1. Company Overview (HQ, Business Segments, Employee Strength)
14.2.7.2. Product Portfolio
14.2.7.3. SWOT Analysis
14.2.7.4. Financial Overview
14.2.7.5. Strategic Overview
14.2.8. Eli Lilly & Company
14.2.8.1. Company Overview (HQ, Business Segments, Employee Strength)
14.2.8.2. Product Portfolio
14.2.8.3. SWOT Analysis
14.2.8.4. Financial Overview
14.2.8.5. Strategic Overview
14.2.9. Merck & Co., Inc.
14.2.9.1. Company Overview (HQ, Business Segments, Employee Strength)
14.2.9.2. Product Portfolio
14.2.9.3. SWOT Analysis
14.2.9.4. Financial Overview
14.2.9.5. Strategic Overview
14.2.10. Janssen Pharmaceutical Company (Johnson & Johnson)
14.2.10.1. Company Overview (HQ, Business Segments, Employee Strength)
14.2.10.2. Product Portfolio
14.2.10.3. SWOT Analysis
14.2.10.4. Financial Overview
14.2.10.5. Strategic Overview
14.2.11. Endo Pharmaceutical Inc.
14.2.11.1. Company Overview (HQ, Business Segments, Employee Strength)
14.2.11.2. Product Portfolio
14.2.11.3. SWOT Analysis
14.2.11.4. Financial Overview
14.2.11.5. Strategic Overview
14.2.12. Zosano Pharma Corporation
14.2.12.1. Company Overview (HQ, Business Segments, Employee Strength)
14.2.12.2. Product Portfolio
14.2.12.3. SWOT Analysis
14.2.12.4. Financial Overview
14.2.12.5. Strategic Overview
14.2.13. Alder BioPharmaceutical, Inc.
14.2.13.1. Company Overview (HQ, Business Segments, Employee Strength)
14.2.13.2. Product Portfolio
14.2.13.3. SWOT Analysis
14.2.13.4. Financial Overview
14.2.13.5. Strategic Overview
14.2.14. Avanir Pharmaceuticals, Inc.
14.2.14.1. Company Overview (HQ, Business Segments, Employee Strength)
14.2.14.2. Product Portfolio
14.2.14.3. SWOT Analysis
14.2.14.4. Financial Overview
14.2.14.5. Strategic Overview
14.2.15. Eisai Co., Ltd.
14.2.15.1. Company Overview (HQ, Business Segments, Employee Strength)
14.2.15.2. Product Portfolio
14.2.15.3. SWOT Analysis
14.2.15.4. Financial Overview
14.2.15.5. Strategic Overview
List of Tables
Table 01: Pipeline Analysis, Migraine Therapy Drugs (1/3)
Table 02: Pipeline Analysis, Migraine Therapy Drugs (2/3)
Table 03: Pipeline Analysis, Migraine Therapy Drugs (3/3)
Table 04: Pipeline Analysis, Migraine Therapy Devices
Table 05: Global Migraine Drugs Market Size (US$ Mn) Forecast, by Treatment, 2015–2025
Table 06: Global Migraine Drugs Market Size (US$ Mn) Forecast, by Abortive Treatment, 2015–2025
Table 07: Global Migraine Drugs Market Size (US$ Mn) Forecast, by Prophylactic Treatment, 2015–2025
Table 08: Global New Chronic Constipation Therapies Market Size (US$) Forecast, 2017-2025
Table 09: Global Migraine Drugs Market Size (US$ Mn) Forecast, by Route of Administration, 2015–2025
Table 10: Global Migraine Drugs Market Size (US$ Mn) Forecast, by Distribution Channel, 2015–2025
Table 11: Global Migraine Drugs Market Size (US$ Mn) Forecast, by Region, 2015–2025
Table 12: North America Migraine Drugs Market Size (US$ Mn) Forecast, by Treatment, 2015–2025
Table 13: North America Migraine Drugs Market Size (US$ Mn) Forecast, by Abortive Treatment, 2015–2025
Table 14: North America Migraine Drugs Market Size (US$ Mn) Forecast, by Prophylactic Treatment, 2015–2025
Table 15: North America Migraine Drugs Market Value (US$ Mn) Forecast, by Route of Administration, 2015–2025
Table 16: North America Migraine Drugs Market Value (US$ Mn) Forecast, by Distribution Channel, 2015–2025
Table 17: North America Migraine Drugs Market Value (US$ Mn) Forecast, by Country, 2015–2025
Table 18: Europe Migraine Drugs Market Size (US$ Mn) Forecast, by Treatment, 2015–2025
Table 19: Europe Migraine Drugs Market Size (US$ Mn) Forecast, by Abortive Treatment, 2015–2025
Table 20: Europe Migraine Drugs Market Size (US$ Mn) Forecast, by Prophylactic Treatment, 2015–2025
Table 21: Europe Migraine Drugs Market Value (US$ Mn) Forecast, by Route of Administration, 2015–2025
Table 22: Europe Migraine Drugs Market Value (US$ Mn) Forecast, by Distribution Channel, 2015–2025
Table 23: Europe Migraine Drugs Market Value (US$ Mn) Forecast, by Country/Sub-region, 2015–2025
Table 24: Asia Pacific Migraine Drugs Market Size (US$ Mn) Forecast, by Treatment, 2015–2025
Table 25: Asia Pacific Migraine Drugs Market Size (US$ Mn) Forecast, by Abortive Treatment, 2015–2025
Table 26: Asia Pacific Migraine Drugs Market Size (US$ Mn) Forecast, by Prophylactic Treatment, 2015–2025
Table 27: Asia Pacific Migraine Drugs Market Value (US$ Mn) Forecast, by Route of Administration, 2015–2025
Table 28: Asia Pacific Migraine Drugs Market Value (US$ Mn) Forecast, by Distribution Channel, 2015–2025
Table 29: Asia Pacific Migraine Drugs Market Value (US$ Mn) Forecast, by Country/Sub-region, 2015–2025
Table 30: Latin America Migraine Drugs Market Size (US$ Mn) Forecast, by Treatment, 2015–2025
Table 31: Latin America Migraine Drugs Market Size (US$ Mn) Forecast, by Abortive Treatment, 2015–2025
Table 32: Latin America Migraine Drugs Market Size (US$ Mn) Forecast, by Prophylactic Treatment, 2015–2025
Table 33: Latin America Migraine Drugs Market Value (US$ Mn) Forecast, by Route of Administration, 2015–2025
Table 34: Latin America Migraine Drugs Market Value (US$ Mn) Forecast, by Distribution Channel, 2015–2025
Table 35: Latin America Migraine Drugs Market Value (US$ Mn) Forecast, by Country/Sub-region, 2015–2025
Table 36: Middle East & Africa Migraine Drugs Market Size (US$ Mn) Forecast, by Treatment, 2015–2025
Table 37: Middle East & Africa Migraine Drugs Market Size (US$ Mn) Forecast, by Abortive Treatment, 2015–2025
Table 38: Middle East & Africa Migraine Drugs Market Size (US$ Mn) Forecast, by Prophylactic Treatment, 2015–2025
Table 39: Middle East & Africa Migraine Drugs Market Value (US$ Mn) Forecast, by Route of Administration, 2015–2025
Table 40: Middle East & Africa Migraine Drugs Market Value (US$ Mn) Forecast, by Distribution Channel, 2015–2025
Table 41: Middle East & Africa Migraine Drugs Market Value (US$ Mn) Forecast, by Country/Sub-region, 2015–2025
List of Figures
Figure 01: Migraine Drugs Market, by Treatment, Market Size (US$ Mn), 2016 (A)
Figure 02: Migraine Drugs Market Revenue (%), by Route of Administration, 2016 (A)
Figure 03: Migraine Drugs Market Revenue (%), by Rigion, 2016 (A)
Figure 04: Treatment Revenue (%), 2016
Figure 05: Route of Administration Revenue (%), 2016
Figure 06: Distribution Channel Revenue (%), 2016
Figure 07: Global Migraine Drugs Market Size (US$ Mn) Forecast, 2015–2025
Figure 08 : Global Prevalence of Migraine
Figure 09: Market Value Share, by Treatment (2016)
Figure 10: Market Value Share, by Route of Administration (2016)
Figure 11: Market Value Share, by Distribution Channel (2016)
Figure 12: Global Migraine Drugs Market Value Share, by Treatment, 2016 and 2025
Figure 13: Global Migraine Drugs Market Attractiveness, by Treatment, 2017–2025
Figure 14: Global Migraine Drugs Market Revenue (US$ Mn) and Y-o-Y Growth (%), by Abortive Treatment, 2015–2025
Figure 15: Global Migraine Drugs Market Revenue (US$ Mn) and Y-o-Y Growth (%), by Prophylactic Treatment, 2015–2025
Figure 16: Global Migraine Drugs Market Revenue (US$ Mn) and Y-o-Y Growth (%), by Triptans, 2015–2025
Figure 17: Global Migraine Drugs Market Revenue (US$ Mn) and Y-o-Y Growth (%), by Ergot Alkoids, 2015–2025
Figure 18: Global Migraine Drugs Market Revenue (US$ Mn) and Y-o-Y Growth (%), by Abortive Treatment - Others, 2015–2025
Figure 19: Global Migraine Drugs Market Revenue (US$ Mn) and Y-o-Y Growth (%), by Botulinum Toxin, 2015–2025
Figure 20: Global Migraine Drugs Market Revenue (US$ Mn) and Y-o-Y Growth (%), by Topiramate, 2015–2025
Figure 21: Global Migraine Drugs Market Revenue (US$ Mn) and Y-o-Y Growth (%), by Prophylactic Treatment - Others, 2015–2025
Figure 22: Global Migraine Drugs Market Value Share, by Route of Administration, 2016 and 2025
Figure 23: Global Migraine Drugs Market Attractiveness, by Route of Administration, 2017–2025
Figure 24: Global Migraine Drugs Market Revenue (US$ Mn) and Y-o-Y Growth (%), by Oral, 2015–2025
Figure 25: Global Migraine Drugs Market Revenue (US$ Mn) and Y-o-Y Growth (%), by Injectable, 2015–2025
Figure 26: Global Migraine Drugs Market Revenue (US$ Mn) and Y-o-Y Growth (%), by Others, 2015–2025
Figure 27: Global Migraine Drugs Market Value Share, by Distribution Channel, 2016 and 2025
Figure 28: Global Migraine Drugs Market Attractiveness, by Distribution Channel, 2017–2025
Figure 29: Global Migraine Drugs Market Revenue (US$ Mn) and Y-o-Y Growth (%), by Retail Pharmacies, 2015–2025
Figure 30: Global Migraine Drugs Market Revenue (US$ Mn) and Y-o-Y Growth (%), by Hospital Pharmacies, 2015–2025
Figure 31: Global Migraine Drugs Market Revenue (US$ Mn) and Y-o-Y Growth (%), by Others, 2015–2025
Figure 32: Global Migraine Drugs Market Value Share, by Region, 2016 and 2025
Figure 33: Global Migraine Drugs Market Attractiveness, by Region, 2017–2025
Figure 34: North America Migraine Drugs Market Size (US$ Mn) and Y-o-Y Growth (%) Forecast, 2017–2025
Figure 35: North America Migraine Drugs Market Value Share Analysis, by Treatment, 2016 and 2025
Figure 36: North America Migraine Drugs Market Value Share Analysis, by Route of Administration, 2016 and 2025
Figure 37: North America Migraine Drugs Market Value Share Analysis, by Distribution Channel, 2016 and 2025
Figure 38: North America Migraine Drugs Market Value Share Analysis, by Country, 2016 and 2025
Figure 39: North America Migraine Drugs Market Attractiveness Analysis, by Treatment
Figure 40: North America Migraine Drugs Market Attractiveness Analysis, by Route of Administration
Figure 41: North America Migraine Drugs Market Attractiveness Analysis, by Distribution Channel
Figure 42: North America Migraine Drugs Market Attractiveness Analysis, by Country
Figure 43: Europe Migraine Drugs Market Size (US$ Mn) and Y-o-Y Growth (%) Forecast, 2017–2025
Figure 44: Europe Migraine Drugs Market Value Share Analysis, by Treatment, 2016 and 2025
Figure 45: Europe Migraine Drugs Market Value Share Analysis, by Route of Administration, 2016 and 2025
Figure 46: Europe Migraine Drugs Market Value Share Analysis, by Distribution Channel, 2016 and 2025
Figure 47: Europe Migraine Drugs Market Value Share Analysis, by Country/Sub-region, 2016 and 2025
Figure 48: Europe Migraine Drugs Market Attractiveness Analysis, by Treatment
Figure 49: Europe Migraine Drugs Market Attractiveness Analysis, by Route of Administration
Figure 50: Europe Migraine Drugs Market Attractiveness Analysis, by Distribution Channel
Figure 51: Europe Migraine Drugs Market Attractiveness Analysis, by Country / Sub-region
Figure 52: Asia Pacific Migraine Drugs Market Size (US$ Mn) and Y-o-Y Growth (%) Forecast, 2017–2025
Figure 53: Asia Pacific Migraine Drugs Market Value Share Analysis, by Treatment, 2016 and 2025
Figure 54: Asia Pacific Migraine Drugs Market Value Share Analysis, by Route of Administration, 2016 and 2025
Figure 55: Asia Pacific Migraine Drugs Market Value Share Analysis, by Distribution Channel, 2016 and 2025
Figure 56: Asia Pacific Migraine Drugs Market Value Share Analysis, by Country/Sub-region, 2016 and 2025
Figure 57: Asia Pacific Migraine Drugs Market Attractiveness Analysis, by Treatment
Figure 58: Asia Pacific Migraine Drugs Market Attractiveness Analysis, by Route of Administration
Figure 59: Asia Pacific Migraine Drugs Market Attractiveness Analysis, by Distribution Channel
Figure 60: Asia Pacific Migraine Drugs Market Attractiveness Analysis, by Country
Figure 61: Latin America Migraine Drugs Market Size (US$ Mn) and Y-o-Y Growth (%) Forecast, 2017–2025
Figure 62: Latin America Migraine Drugs Market Value Share Analysis, by Treatment, 2016 and 2025
Figure 63: Latin America Migraine Drugs Market Value Share Analysis, by Route of Administration, 2016 and 2025
Figure 64: Latin America Migraine Drugs Market Value Share Analysis, by Distribution Channel, 2016 and 2025
Figure 65: Latin America Migraine Drugs Market Value Share Analysis, by Country/Sub-region, 2016 and 2025
Figure 66: Latin America Migraine Drugs Market Attractiveness Analysis, by Treatment
Figure 67: Latin America Migraine Drugs Market Attractiveness Analysis, by Route of Administration
Figure 68: Latin America Migraine Drugs Market Attractiveness Analysis, by Distribution Channel
Figure 69: Latin America Migraine Drugs Market Attractiveness Analysis, by Country / Sub-region
Figure 70: Middle East & Africa Migraine Drugs Market Size (US$ Mn) and Y-o-Y Growth (%) Forecast, 2017–2025
Figure 71: Middle East & Africa Migraine Drugs Market Value Share Analysis, by Treatment, 2016 and 2025
Figure 72: Middle East & Africa Migraine Drugs Market Value Share Analysis, by Route of Administration, 2016 and 2025
Figure 73: Middle East & Africa Migraine Drugs Market Value Share Analysis, by Distribution Channel, 2016 and 2025
Figure 74: Middle East & Africa Migraine Drugs Market Value Share Analysis, by Country/Sub-region, 2016 and 2025
Figure 75: Middle East & Africa Migraine Drugs Market Attractiveness Analysis, by Treatment
Figure 76: Middle East & Africa Migraine Drugs Market Attractiveness Analysis, by Route of Administration
Figure 77: Middle East & Africa Migraine Drugs Market Attractiveness Analysis, by Distribution Channel
Figure 78: Middle East & Africa Migraine Drugs Market Attractiveness Analysis, by Country
Copyright © Transparency Market Research, Inc. All Rights reserved
Trust Online

Migraine Drugs Market