Reports
Reports
The demand for mass spectrometers is experiencing an incredible growth as spectrometers have an essential application in various industries including pharmaceutical, environment monitoring, and food security. With advancements analyses’ techniques, mass spectrometry is gaining popularity.

Technological advancements in biopharmaceuticals and drug development have supplemented the need for mass spectrometry in drug discovery and development. Drug control agencies insist on rigorous testing of drug efficacy and safety, thereby pushing the market even further.
Mass spectrometry implies a quantitative method to measure the mass-to-charge ratio of ions and obtain information regarding the molecular shape of substances. It constitutes chemical substance ionization and separation of the resulting product ions based on their mass-to-charge values with the help of electromagnetic fields. It is especially helpful in pharmaceuticals, food safety, and environmental science since it can analyse and quantify complex mixtures accurately.
Mass spectrometers comprise quadrupole, time-of-flight (TOF), and ion trap spectrometers - all of which are specifically formulated for a purpose. As the requirement for precise analysis methods grows, the mass spectrometry technology compacts the equipment and simplifies its usage.
| Attribute | Detail |
|---|---|
| Mass Spectrometer Market Drivers |
|
One of the primary drivers to the mass spectrometer market is increasing research and development (R&D) expenditure in the biotechnology and pharmaceutical industries. These industries are seriously trying to develop new drugs, and they have to employ precise analytical machinery to ensure safety and effectiveness of the drugs.
Pharmaceutical companies are handsomely investing in R&D to comply with strict regulatory requirements and expedite the process of drug development. The shift is being propelled by rising incidence of chronic diseases and need for customized medication. As such, the mass spectrometry market is experiencing robust growth, especially in Europe and North America's healthcare sectors, which have big investments in these new initiatives behind them. Increased R&D focus is likely to be the reason behind increasing applications of mass spectrometry technologies.
As healthcare systems increasingly demand improved and more precise diagnostic devices, mass spectrometry has turned out to be a leading technology for diagnosing biological specimens like blood, urine, and tissue. With its ability to provide rapid and accurate report of identification of biomarkers, it is essential for early detection of the disease, treatment monitoring, and targeted therapy.
As the incidence of chronic diseases witnesses exponentiation, physicians are increasingly looking for advanced diagnostic platforms. Mass spectrometers enable identification of disease-specific proteins and metabolites that enable physicians to make appropriate decisions at the appropriate time.
New mass spectrometry equipment including automation and miniaturization, have also made the equipment affordable to install in clinical laboratories. Europe and North America, where they have substantial health expenditures and a focus on improved patient outcomes, further consolidate the place of mass spectrometry in diagnostics today.

Instrument product segments are dominating the mass spectrometer market with their own worth in various analytical solutions in various industries. Mass spectrometers, as instruments, are unparalleled in accuracy and sensitivity in examining and determining complex mixtures and thus becoming extremely valuable in the pharma industry, environmental monitoring, and food safety. Continuous technological development has led to better and easier-to-use mass spectrometers into the market, hence making laboratories and research centers interested in them.
There are a number of key drivers for instrument type of products that dominate the market. Firstly, there is greater demand for high levels of analytical precision in drug discovery and development, which makes pharmaceutical firms invest in first-class mass spectrometry equipment. Secondly, there is more focus on the application of personalized medicine and biomarker research, which has necessitated the need for the use of mass spectrometers for accurate diagnostics. Finally, there is regulatory demand for high-quality control across numerous industries that is driving the application of such devices.
Moreover, the miniaturization and automation wave of mass spectrometry has made this device available, thereby putting the laboratories at a position to increase their throughput as well as effectiveness. Therefore, the instrument product type is still the most prevalent form of mass spectrometer available in the market in response to changing demands from various industries.

| Attribute | Detail |
|---|---|
| Leading Region |
|
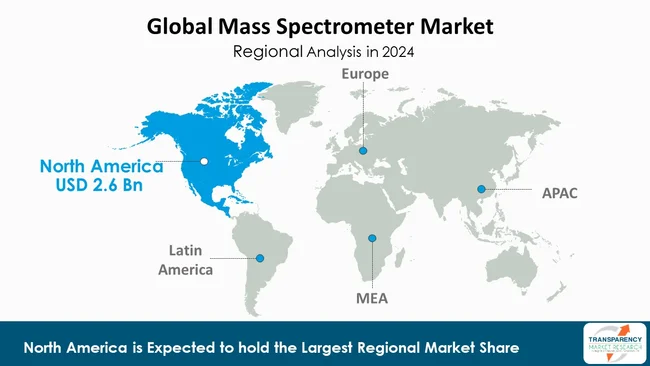
North America dominates the mass spectrometer market due to a combination of several factors. The healthcare infrastructure, scientific research priorities, and subsequent focus on R&D. The major companies and research institutions in the U.S. and Canada also heavily value advanced analytical methodologies, which should assist in the future for the advancement of mass spectrometry and all projects associated with scientific focus.
Additionally, there are also a fairly disproportionate number of manufacturers/technology innovators in the same space and, naturally, competing against one another in North America, which has led to a situation that is advantageous to the development of mass spectrometry systems/futures/technologies.
The agencies or regulatory organizations present in North America typically require superior to excellent standards of quality control, and reference standard quality control tools for their public health safety and health and safety needs and compliance. As such, there is a preference for access to superior quality analytical instruments of all analysis type with positive market influence.
Key players in the global market are investing in innovation, technological advancements, and forming alliances. Their objective is to improve the precision of testing, diversify their products, and gain a stronger market presence in order to be ahead of the curve in the evolving healthcare market.
Thermo Fisher Scientific Inc., JEOL Ltd., PerkinElmer Inc., Shimadzu, SCIEX, Linseis Inc., Agilent Technologies, Inc., Waters Corporation, Teledyne Technologies Incorporated, Hitachi High‑Tech Corporation, Hiden Analytical, Charles River Laboratories, Variolytics GmbH, Nu Instruments, Advanced Energy are some of the leading players.
Each of these players has been profiled in the mass spectrometer industry research report based on parameters such as company overview, financial overview, business strategies, product portfolio, business segments, and recent developments.
| Attribute | Detail |
|---|---|
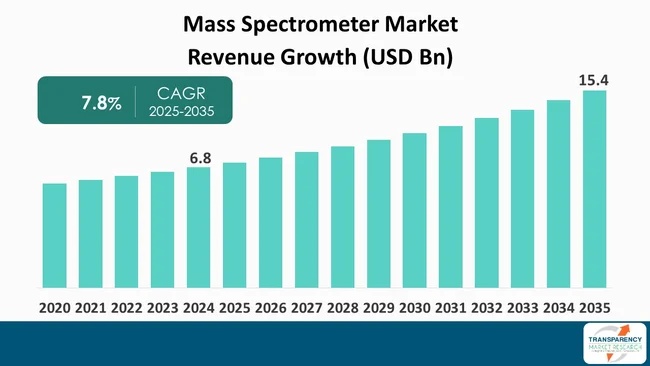
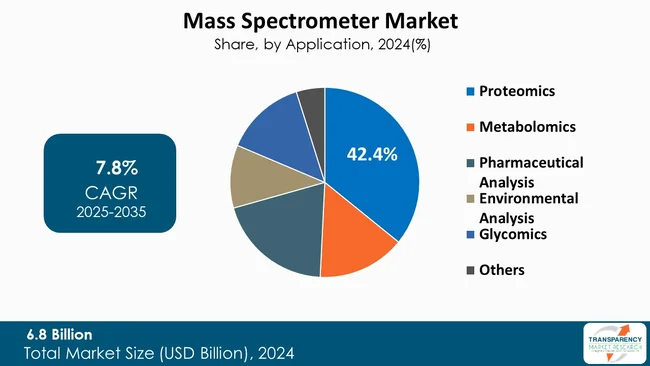
| Size in 2024 | US$ 6.8 Bn |
| Forecast Value in 2035 | US$ 15.4 Bn |
| CAGR | 7.8% |
| Forecast Period | 2025–2035 |
| Historical Data Available for | 2020–2023 |
| Quantitative Units | US$ Bn |
| Mass Spectrometer Market Analysis | It includes segment analysis as well as regional level analysis. Moreover, qualitative analysis includes drivers, restraints, opportunities, key trends, value chain analysis, and key trend analysis. |
| Competition Landscape |
|
| Format | Electronic (PDF) + Excel |
| Segmentation | Product Type
|
| Regions Covered |
|
| Countries Covered |
|
| Companies Profiled |
|
| Customization Scope | Available upon request |
| Pricing | Available upon request |
The global mass spectrometer market was valued at US$ 6.8 Bn in 2024
The global mass spectrometer market is projected to cross US$ 15.4 Bn by the end of 2035
Increasing R&D Investments in the pharmaceutical and biotechnology industry and rising adoption in clinical diagnostics
The global mass spectrometer industry is anticipated to grow at a CAGR of 7.8% from 2025 to 2035
North America is expected to account for the largest share from 2025 to 2035
Thermo Fisher Scientific Inc., JEOL Ltd., PerkinElmer Inc., Shimadzu, SCIEX, Linseis Inc., Agilent Technologies, Inc., Waters Corporation, Teledyne Technologies Incorporated, Hitachi High‑Tech Corporation, Hiden Analytical, Charles River Laboratories, Variolytics GmbH, Nu Instruments, Advanced Energy and Others
Table 01: Global Mass Spectrometer Market Value (US$ Bn) Forecast, By Product Type, 2020 to 2035
Table 02: Global Mass Spectrometer Market Value (US$ Bn) Forecast, By Instrument, 2020 to 2035
Table 03: Global Mass Spectrometer Market Value (US$ Bn) Forecast, By Application, 2020 to 2035
Table 04: Global Mass Spectrometer Market Value (US$ Bn) Forecast, By Proteomics, 2020 to 2035
Table 05: Global Mass Spectrometer Market Value (US$ Bn) Forecast, By Metabolomics, 2020 to 2035
Table 06: Global Mass Spectrometer Market Value (US$ Bn) Forecast, By Pharmaceutical Analysis, 2020 to 2035
Table 07: Global Mass Spectrometer Market Value (US$ Bn) Forecast, By Environmental Analysis, 2020 to 2035
Table 08: Global Mass Spectrometer Market Value (US$ Bn) Forecast, By Region, 2020 to 2035
Table 09: North America Mass Spectrometer Market Value (US$ Bn) Forecast, by Country, 2020 to 2035
Table 10: North America Mass Spectrometer Market Value (US$ Bn) Forecast, By Product Type, 2020 to 2035
Table 11: North America Mass Spectrometer Market Value (US$ Bn) Forecast, By Instrument, 2020 to 2035
Table 12: North America Mass Spectrometer Market Value (US$ Bn) Forecast, By Application, 2020 to 2035
Table 13: North America Mass Spectrometer Market Value (US$ Bn) Forecast, By Proteomics, 2020 to 2035
Table 14: North America Mass Spectrometer Market Value (US$ Bn) Forecast, By Metabolomics, 2020 to 2035
Table 15: North America Mass Spectrometer Market Value (US$ Bn) Forecast, By Pharmaceutical Analysis, 2020 to 2035
Table 16: North America Mass Spectrometer Market Value (US$ Bn) Forecast, By Environmental Analysis, 2020 to 2035
Table 14: Europe Mass Spectrometer Market Value (US$ Bn) Forecast, by Country / Sub-region, 2020 to 2035
Table 18: Europe Mass Spectrometer Market Value (US$ Bn) Forecast, By Product Type, 2020 to 2035
Table 19: Europe Mass Spectrometer Market Value (US$ Bn) Forecast, By Instrument, 2020 to 2035
Table 20: Europe Mass Spectrometer Market Value (US$ Bn) Forecast, By Application, 2020 to 2035
Table 21: Europe Mass Spectrometer Market Value (US$ Bn) Forecast, By Proteomics, 2020 to 2035
Table 22: Europe Mass Spectrometer Market Value (US$ Bn) Forecast, By Metabolomics, 2020 to 2035
Table 23: Europe Mass Spectrometer Market Value (US$ Bn) Forecast, By Pharmaceutical Analysis, 2020 to 2035
Table 24: Europe Mass Spectrometer Market Value (US$ Bn) Forecast, By Environmental Analysis, 2020 to 2035
Table 25: Asia Pacific Mass Spectrometer Market Value (US$ Bn) Forecast, by Country / Sub-region, 2020 to 2035
Table 26: Asia Pacific Mass Spectrometer Market Value (US$ Bn) Forecast, By Product Type, 2020 to 2035
Table 27: Asia Pacific Mass Spectrometer Market Value (US$ Bn) Forecast, By Instrument, 2020 to 2035
Table 28: Asia Pacific Mass Spectrometer Market Value (US$ Bn) Forecast, By Application, 2020 to 2035
Table 29: Asia Pacific Mass Spectrometer Market Value (US$ Bn) Forecast, By Proteomics, 2020 to 2035
Table 30: Asia Pacific Mass Spectrometer Market Value (US$ Bn) Forecast, By Metabolomics, 2020 to 2035
Table 31: Asia Pacific Mass Spectrometer Market Value (US$ Bn) Forecast, By Pharmaceutical Analysis, 2020 to 2035
Table 32: Asia Pacific Mass Spectrometer Market Value (US$ Bn) Forecast, By Environmental Analysis, 2020 to 2035
Table 33: Latin America Mass Spectrometer Market Value (US$ Bn) Forecast, by Country / Sub-region, 2020 to 2035
Table 34: Latin America Mass Spectrometer Market Value (US$ Bn) Forecast, By Product Type, 2020 to 2035
Table 35: Latin America Mass Spectrometer Market Value (US$ Bn) Forecast, By Instrument, 2020 to 2035
Table 36: Latin America Mass Spectrometer Market Value (US$ Bn) Forecast, By Application, 2020 to 2035
Table 37: Latin America Mass Spectrometer Market Value (US$ Bn) Forecast, By Proteomics, 2020 to 2035
Table 38: Latin America Mass Spectrometer Market Value (US$ Bn) Forecast, By Metabolomics, 2020 to 2035
Table 39: Latin America Mass Spectrometer Market Value (US$ Bn) Forecast, By Pharmaceutical Analysis, 2020 to 2035
Table 40: Latin America Mass Spectrometer Market Value (US$ Bn) Forecast, By Environmental Analysis, 2020 to 2035
Table 41: Middle East & Africa Mass Spectrometer Market Value (US$ Bn) Forecast, by Country / Sub-region, 2020 to 2035
Table 42: Middle East & Africa Mass Spectrometer Market Value (US$ Bn) Forecast, By Product Type, 2020 to 2035
Table 43: Middle East & Africa Mass Spectrometer Market Value (US$ Bn) Forecast, By Instrument, 2020 to 2035
Table 44: Middle East & Africa Mass Spectrometer Market Value (US$ Bn) Forecast, By Application, 2020 to 2035
Table 45: Middle East & Africa Mass Spectrometer Market Value (US$ Bn) Forecast, By Proteomics, 2020 to 2035
Table 46: Middle East & Africa Mass Spectrometer Market Value (US$ Bn) Forecast, By Metabolomics, 2020 to 2035
Table 47: Middle East & Africa Mass Spectrometer Market Value (US$ Bn) Forecast, By Pharmaceutical Analysis, 2020 to 2035
Table 48: Middle East & Africa Mass Spectrometer Market Value (US$ Bn) Forecast, By Environmental Analysis, 2020 to 2035
Figure 01: Global Mass Spectrometer Market Value Share Analysis, By Product Type, 2024 and 2035
Figure 02: Global Mass Spectrometer Market Attractiveness Analysis, By Product Type, 2025 to 2035
Figure 03: Global Mass Spectrometer Market Revenue (US$ Bn), by Instrument, 2020 to 2035
Figure 04: Global Mass Spectrometer Market Revenue (US$ Bn), by Software and Services, 2020 to 2035
Figure 05: Global Mass Spectrometer Market Value Share Analysis, By Application, 2024 and 2035
Figure 06: Global Mass Spectrometer Market Attractiveness Analysis, By Application, 2025 to 2035
Figure 07: Global Mass Spectrometer Market Revenue (US$ Bn), by Proteomics, 2020 to 2035
Figure 08: Global Mass Spectrometer Market Revenue (US$ Bn), by Metabolomics, 2020 to 2035
Figure 09: Global Mass Spectrometer Market Revenue (US$ Bn), by Pharmaceutical Analysis, 2020 to 2035
Figure 10: Global Mass Spectrometer Market Revenue (US$ Bn), by Environmental Analysis, 2020 to 2035
Figure 11: Global Mass Spectrometer Market Revenue (US$ Bn), by Glycomics, 2020 to 2035
Figure 12: Global Mass Spectrometer Market Revenue (US$ Bn), by Others, 2020 to 2035
Figure 13: Global Mass Spectrometer Market Value Share Analysis, By Region, 2024 and 2035
Figure 14: Global Mass Spectrometer Market Attractiveness Analysis, By Region, 2025 to 2035
Figure 15: North America Mass Spectrometer Market Value (US$ Bn) Forecast, 2020 to 2035
Figure 16: North America Mass Spectrometer Market Value Share Analysis, by Country, 2024 and 2035
Figure 14: North America Mass Spectrometer Market Attractiveness Analysis, by Country, 2025 to 2035
Figure 18: North America Mass Spectrometer Market Value Share Analysis, By Product Type, 2024 and 2035
Figure 19: North America Mass Spectrometer Market Attractiveness Analysis, By Product Type, 2025 to 2035
Figure 20: North America Mass Spectrometer Market Value Share Analysis, By Application, 2024 and 2035
Figure 21: North America Mass Spectrometer Market Attractiveness Analysis, By Application, 2025 to 2035
Figure 22: Europe Mass Spectrometer Market Value (US$ Bn) Forecast, 2020 to 2035
Figure 23: Europe Mass Spectrometer Market Value Share Analysis, by Country / Sub-region, 2024 and 2035
Figure 24: Europe Mass Spectrometer Market Attractiveness Analysis, by Country / Sub-region, 2025 to 2035
Figure 25: Europe Mass Spectrometer Market Value Share Analysis, By Product Type, 2024 and 2035
Figure 26: Europe Mass Spectrometer Market Attractiveness Analysis, By Product Type, 2025 to 2035
Figure 27: Europe Mass Spectrometer Market Value Share Analysis, By Application, 2024 and 2035
Figure 28: Europe Mass Spectrometer Market Attractiveness Analysis, By Application, 2025 to 2035
Figure 29: Asia Pacific Mass Spectrometer Market Value (US$ Bn) Forecast, 2020 to 2035
Figure 30: Asia Pacific Mass Spectrometer Market Value Share Analysis, by Country/Sub-region, 2024 and 2035
Figure 31: Asia Pacific Mass Spectrometer Market Attractiveness Analysis, by Country/Sub-region, 2025 to 2035
Figure 32: Asia Pacific Mass Spectrometer Market Value Share Analysis, By Product Type, 2024 and 2035
Figure 33: Asia Pacific Mass Spectrometer Market Attractiveness Analysis, By Product Type, 2025 to 2035
Figure 34: Asia Pacific Mass Spectrometer Market Value Share Analysis, By Application, 2024 and 2035
Figure 35: Asia Pacific Mass Spectrometer Market Attractiveness Analysis, By Application, 2025 to 2035
Figure 36: Latin America Mass Spectrometer Market Value (US$ Bn) Forecast, 2020 to 2035
Figure 37: Latin America Mass Spectrometer Market Value Share Analysis, by Country / Sub-region, 2024 and 2035
Figure 38: Latin America Mass Spectrometer Market Attractiveness Analysis, by Country / Sub-region, 2025 to 2035
Figure 39: Latin America Mass Spectrometer Market Value Share Analysis, By Product Type, 2024 and 2035
Figure 40: Latin America Mass Spectrometer Market Attractiveness Analysis, By Product Type, 2025 to 2035
Figure 41: Latin America Mass Spectrometer Market Value Share Analysis, By Application, 2024 and 2035
Figure 42: Latin America Mass Spectrometer Market Attractiveness Analysis, By Application, 2025 to 2035
Figure 43: Middle East & Africa Mass Spectrometer Market Value (US$ Bn) Forecast, 2020 to 2035
Figure 44: Middle East & Africa Mass Spectrometer Market Value Share Analysis, by Country / Sub-region, 2024 and 2035
Figure 45: Middle East & Africa Mass Spectrometer Market Attractiveness Analysis, by Country / Sub-region, 2025 to 2035
Figure 46: Middle East & Africa Mass Spectrometer Market Value Share Analysis, By Product Type, 2024 and 2035
Figure 47: Middle East & Africa Mass Spectrometer Market Attractiveness Analysis, By Product Type, 2025 to 2035
Figure 48: Middle East & Africa Mass Spectrometer Market Value Share Analysis, By Application, 2024 and 2035
Figure 49: Middle East & Africa Mass Spectrometer Market Attractiveness Analysis, By Application, 2025 to 2035