
Reports
Reports
Analysts’ Viewpoint on Low Voltage (LV) and Medium Voltage (MV) Switchgear Market Scenario
Switchgear refers to an amalgamation of electrical switching devices whose function is to switch, control, regulate, isolate, and protect electrical circuits and equipment. Products in the switchgear ambit include switches, circuit breakers, switch fuse units, contractors, HRC fuses, offload isolators, and earth leakage circuit breakers. Demand for low and medium voltage switchgear is expected to increase consistently in Asia Pacific owing to industrial development, rise in expenditure by governments on boosting infrastructure development, and addition of power capacity by key players. Rapid expansion and modernization of power generation plants across different parts of Asia Pacific in order to cater to the rising demand for electricity is anticipated to propel the adoption rate of switchgears in various power generation plants.
Rise in concerns about emission of CO2 of old transmission and distribution networks has triggered the demand for the installation of new medium voltage switchgear assembly. Low and medium voltage switchgears are directly linked to reliability of the supply of electricity. Advancements in features of SF6 switchgear, such as low noise level during operation, long maintenance intervals, excellent interrupting performance, environment compatibility, and small space requirement, are propelling the low and medium voltage switchgear market. The upgrade of aging transmission and distribution infrastructure is further anticipated to fuel the market. Around 65 gigawatts of onshore wind turbines are expected to reach end-of-design-life in Europe by 2028. The upgrade of equipment in order to extend their lifespan is estimated to drive the market for low and medium voltage switchgear. New regulations to reduce or limit power blackouts and strengthen power distribution networks are creating opportunities for manufacturers of the power sector equipment. Growth in usage of the equipment to make smarter decisions by providing real-time data is a major factor driving the global market.
Lack of electrification in various countries across the world has been inhibiting the use of switchgear and other advanced equipment, which require electricity. Grid electrification and adoption is high among rural households; electric grid has become the primary source of electricity and lighting. This is boosting the demand for low voltage and medium voltage switchgear. As of 2018, the electrification rate stood at less than 75% in rural areas in various countries in Asia such as Myanmar, Pakistan, North Korea, and Bangladesh. It was less than 50% in several countries in Africa. Initiatives taken by the governments of China, Sri Lanka, and India to achieve 100% rural electrification are also anticipated to propel the demand for low and medium voltage switchgear in the next few years. Increase in electrification and adoption of smart grid technology across different parts of the world is likely to augment the demand for low and medium voltage switchgear from 2022 to 2031.
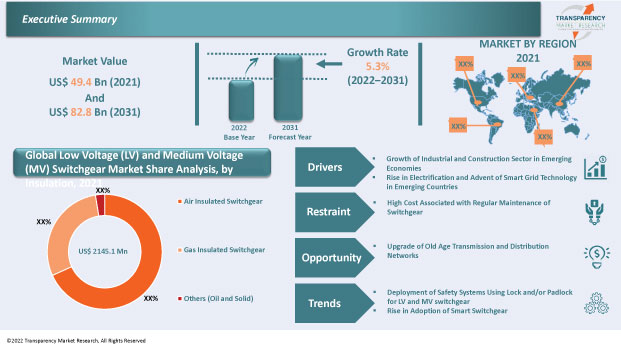
In terms of insulation, the global low voltage (LV) and medium voltage (MV) switchgear market has been split into air insulated switchgear, gas insulated switchgear, and others (oil and solid). The air insulated switchgear segment held major share of 68.24% in 2021. It is likely to maintain the status quo and expand at a growth rate of 5.6% during the forecast period. In this type of switchgear, the air is utilized as the primary dielectric from phase to ground or for phase to phase insulation technology. These switchgears are extensively employed in areas where weather conditions, space, seismic occurrences, and environmental concerns are generally not an issue such as favourable offsite terrain and rural areas. Air insulation offers several advantages such as easy installation, remote monitoring and control, reliable switching of SF6 gas, and ease of transport and storage. Thus, manufacturers are increasingly focusing on the development of air insulated low and medium voltage switchgears. For Instance, MITSUBISHI ELECTRIC provides a variety of medium/low voltage products to ensure the safe and reliable operation of modern power network. The company is also focusing on offering the society a clean environment (sf6-free) and energy-efficient low lifecycle cost solutions.
Based on installation, the global low voltage (LV) and medium voltage (MV) switchgear market has been bifurcated into indoor and outdoor. The indoor low and medium voltage switchgear segment held a share of 65.20% in 2021. Furthermore, the segment is expected to register a CAGR of 5.6% during the forecast period. Indoor switchgear is preferred for voltages below 40kV. The pieces of equipment in the system are packed together in an earthed metal case, i.e., most of the low and medium voltage switchgear are indoor installed. Outdoor type switchgear is used for voltages above 66kV. Equipment used by the system such as transformers, switches, and circuit breakers requires a considerably large surface area and wide electrical clearance between conductors at such high magnitude of voltages. This type of installation is not cost-effective.
Asia Pacific held a prominent share of 39.12% of the global low voltage (LV) and medium voltage (MV) switchgear market in 2021. Asia Pacific and North America are major hubs of research and development activities in the field of technology and new product development. Lucrative presence of low voltage switchgear and medium voltage switchgear manufacturers is driving the market in these regions. North America held 26.36% share of the global market in 2021 due to the presence of several prominent manufacturing corporations that offer electrification components for various industries. China dominated the market in Asia Pacific in 2021 due to the increase in power grid construction in the country. Government initiatives in renewable energy is also boosting the LV and MV switchgear market in the country. For instance, in December 2020, Hitachi ABB Power Grids introduced a 72.5 kV high-voltage hybrid switchgear for offshore wind – Plug and Switch System (PASS) M00 – Wind. The hybrid switchgear would be installed at China’s first 66-kilovolt offshore wind farm, Huadian Yuhuan Phase 1, to optimize the energy landscape in the Yangtze River Delta. This has boosted the adoption LV switchgears and MV switchgears in the country.
The global low voltage (LV) and medium voltage (MV) switchgear market is consolidated with the presence of established players who have stronghold on the global market for LV and MV switchgear. Majority of medium and low voltage switchgear companies are spending significantly on comprehensive research & development activities, primarily to develop environment-friendly products. Most of the low voltage switchgear manufacturers can choose their suppliers from a large number of raw interface suppliers worldwide. Large numbers of raw material suppliers are available across the globe. Sometimes, clients also provide a raw interface to meet their requirements. Expansion of product portfolios and mergers and acquisitions are notable strategies adopted by key players. ABB, CG Power & Industrial Solutions Ltd., Eaton Corporation plc., Efacec, Fuji Electric Co., Ltd., General Electric, Hyosung Heavy Industries, Powell Industries Inc., Siemens AG, Schneider Electric SE, Mitsubishi Electric Corporation, BHEL, and Regal Rexnord Corporation are the prominent entities operating in the market.
Each of these players has been profiled in the low voltage (LV) and medium voltage (MV) switchgear market report based on parameters such as company overview, financial overview, business strategies, product portfolio, business segments, and recent developments.
|
Attribute |
Detail |
|
Market Size Value in 2021 |
US$ 49.4 Bn |
|
Market Forecast Value in 2031 |
US$ 82.8 Bn |
|
Growth Rate (CAGR) |
5.3% |
|
Forecast Period |
2022–2031 |
|
Historical Data Available for |
2017–2020 |
|
Quantitative Units |
US$ Mn for Value & Thousand Units for Volume |
|
Market Analysis |
It includes cross segment analysis at global as well as regional level. Furthermore, qualitative analysis includes drivers, restraints, opportunities, key trends, Porter’s Five Forces analysis, value chain analysis, and key trend analysis. |
|
Competition Landscape |
|
|
Format |
Electronic (PDF) + Excel |
|
Market Segmentation |
|
|
Regions Covered |
|
|
Countries Covered |
|
|
Companies Profiled |
|
|
Customization Scope |
Available upon request |
|
Pricing |
Available upon request |
The low voltage (LV) and medium voltage (MV) switchgear market stood at US$ 49.4 Bn in 2021.
The low voltage (LV) and medium voltage (MV) switchgear market is expected to grow at a CAGR of 5.3% by 2031.
The low voltage (LV) and medium voltage (MV) switchgear market would reach US$ 82.8 Bn in 2031.
Prominent players operating in the low voltage (LV) and medium voltage (MV) switchgear market include ABB, Schneider Electric SE, Siemens AG, General Electric, Eaton Corporation plc, Mitsubishi Electric Corporation, Powell Industries Inc., Fuji Electric Co., Ltd., BHEL, Hyosung Heavy Industries, Regal Rexnord Corporation, CG Power & Industrial Solutions Ltd., and Efacec.
The U.S. accounted for 19.54% of share of the low voltage (LV) and medium voltage (MV) switchgear market in 2021.
Based on type, the air insulated segment held 68.24% share of the low voltage (LV) and medium voltage (MV) switchgear market in 2021.
Deployment of safety systems using lock and/or padlock for LV and MV switchgear and rising adoption of smart switchgear are key factors driving the market.
Asia Pacific is a more lucrative region of the global low voltage (LV) and medium voltage (MV) switchgear market.
1. Preface
1.1. Market Introduction
1.2. Market and Segments Definition
1.3. Market Taxonomy
1.4. Research Methodology
1.5. Assumption and Acronyms
2. Executive Summary
2.1. Global Low Voltage (LV) and Medium Voltage (MV) Switchgear Market Overview
2.2. Regional Outline
2.3. Industry Outline
2.4. Market Dynamics Snapshot
2.5. Competition Blueprint
3. Market Dynamics
3.1. Macro-economic Factors
3.2. Drivers
3.3. Restraints
3.4. Opportunities
3.5. Key Trends
3.6. Regulatory Framework
4. Associated Industry and Key Indicator Assessment
4.1. Parent Industry Overview – Global Switchgear Industry Overview
4.2. Supply Chain Analysis
4.3. Pricing Analysis
4.4. Technology Roadmap Analysis
4.5. Industry SWOT Analysis
4.6. Porter Five Forces Analysis
4.7. Covid-19 Impact and Recovery Analysis
5. Global Low Voltage (LV) and Medium Voltage (MV) Switchgear Market Analysis, by Voltage Range
5.1. Low Voltage (LV) and Medium Voltage (MV) Switchgear Market Value (US$ Mn) and Volume (Thousand Units) Analysis & Forecast, by Voltage Range, 2017–2031
5.1.1. Less than 1kV
5.1.2. 1kV – 5kV
5.1.3. 6kV – 15kV
5.1.4. 17kV – 27kV
5.1.5. 28kV – 40kV
5.2. Market Attractiveness Analysis, by Voltage Range
6. Global Low Voltage (LV) and Medium Voltage (MV) Switchgear Market Analysis, by Components
6.1. Low Voltage (LV) and Medium Voltage (MV) Switchgear Market Value (US$ Mn) and Volume (Thousand Units) Analysis & Forecast, by Components, 2017–2031
6.1.1. Circuit Breaker
6.1.2. Relays
6.1.3. Bus Bars and Switches
6.1.4. Others (Enclosure, Isolators, Fuses)
6.2. Market Attractiveness Analysis, by Components
7. Global Low Voltage (LV) and Medium Voltage (MV) Switchgear Market Analysis, by Insulation
7.1. Low Voltage (LV) and Medium Voltage (MV) Switchgear Market Value (US$ Mn) and Volume (Thousand Units) Analysis & Forecast, by Insulation, 2017–2031
7.1.1. Air Insulated Switchgear
7.1.2. Gas Insulated Switchgear
7.1.3. Others (Oil and Solid)Others (Enclosure, Isolators, Fuses)
7.2. Market Attractiveness Analysis, by Insulation
8. Global Low Voltage (LV) and Medium Voltage (MV) Switchgear Market Analysis, by Installation
8.1. Low Voltage (LV) and Medium Voltage (MV) Switchgear Market Value (US$ Mn) Analysis & Forecast, by Installation, 2017–2031
8.1.1. Indoor
8.1.2. Outdoor
8.2. Market Attractiveness Analysis, by Installation
9. Global Low Voltage (LV) and Medium Voltage (MV) Switchgear Market Analysis, by End-use Industry
9.1. Low Voltage (LV) and Medium Voltage (MV) Switchgear Market Value (US$ Mn) Analysis & Forecast, by End-use Industry, 2017–2031
9.1.1. Automotive
9.1.2. IT and Telecommunication
9.1.3. Energy & Utility
9.1.4. Metals & Mining
9.1.5. Food & Beverage
9.1.6. Chemicals
9.1.7. Oil & Gas
9.1.8. Building & Construction
9.1.9. Others (Water & Waste Water, Textile, etc.)
9.2. Market Attractiveness Analysis, by End-use Industry
10. Global Low Voltage (LV) and Medium Voltage (MV) Switchgear Market Analysis and Forecast, by Region
10.1. Low Voltage (LV) and Medium Voltage (MV) Switchgear Market Value (US$ Mn) and Volume (Thousand Units) Analysis & Forecast, by Region, 2017–2031
10.1.1. North America
10.1.2. Europe
10.1.3. Asia Pacific
10.1.4. Middle East & Africa
10.1.5. South America
10.2. Market Attractiveness Analysis, by Region
11. North America Low Voltage (LV) and Medium Voltage (MV) Switchgear Market Analysis and Forecast
11.1. Market Snapshot
11.2. Low Voltage (LV) and Medium Voltage (MV) Switchgear Market Value (US$ Mn) and Volume (Thousand Units) Analysis & Forecast, by Voltage Range, 2017–2031
11.2.1. Less than 1kV
11.2.2. 1kV – 5kV
11.2.3. 6kV – 15kV
11.2.4. 17kV – 27kV
11.2.5. 28kV – 40kV
11.3. Low Voltage (LV) and Medium Voltage (MV) Switchgear Market Value (US$ Mn) and Volume (Thousand Units) Analysis & Forecast, by Components, 2017–2031
11.3.1. Circuit Breaker
11.3.2. Relays
11.3.3. Bus Bars and Switches
11.3.4. Others (Enclosure, Isolators, Fuses)
11.4. Low Voltage (LV) and Medium Voltage (MV) Switchgear Market Value (US$ Mn) and Volume (Thousand Units) Analysis & Forecast, by Insulation, 2017–2031
11.4.1. Air Insulated Switchgear
11.4.2. Gas Insulated Switchgear
11.4.3. Others (Oil and Solid)Others (Enclosure, Isolators, Fuses)
11.5. Low Voltage (LV) and Medium Voltage (MV) Switchgear Market Value (US$ Mn) Analysis & Forecast, by Installation, 2017–2031
11.5.1. Indoor
11.5.2. Outdoor
11.6. Low Voltage (LV) and Medium Voltage (MV) Switchgear Market Value (US$ Mn) Analysis & Forecast, by End-use Industry, 2017–2031
11.6.1. Automotive
11.6.2. IT and Telecommunication
11.6.3. Energy & Utility
11.6.4. Metals & Mining
11.6.5. Food & Beverage
11.6.6. Chemicals
11.6.7. Oil & Gas
11.6.8. Building & Construction
11.6.9. Others (Water & Waste Water, Textile, etc.)
11.7. Low Voltage (LV) and Medium Voltage (MV) Switchgear Value (US$ Mn) and Volume (Thousand Units) Analysis & Forecast, by Country/Sub-region and Sub-region, 2017–2031
11.7.1. The U.S.
11.7.2. Canada
11.7.3. Rest of North America
11.8. Market Attractiveness Analysis
11.8.1. By Voltage Range
11.8.2. By Components
11.8.3. By Insulation
11.8.4. By Installation
11.8.5. By End-use Industry
11.8.6. By Country/Sub-region/Sub-region
12. Europe Low Voltage (LV) and Medium Voltage (MV) Switchgear Market Analysis and Forecast
12.1. Market Snapshot
12.2. Low Voltage (LV) and Medium Voltage (MV) Switchgear Market Value (US$ Mn) and Volume (Thousand Units) Analysis & Forecast, by Voltage Range, 2017–2031
12.2.1. Less than 1kV
12.2.2. 1kV – 5kV
12.2.3. 6kV – 15kV
12.2.4. 17kV – 27kV
12.2.5. 28kV – 40kV
12.3. Low Voltage (LV) and Medium Voltage (MV) Switchgear Market Value (US$ Mn) and Volume (Thousand Units) Analysis & Forecast, by Components, 2017–2031
12.3.1. Circuit Breaker
12.3.2. Relays
12.3.3. Bus Bars and Switches
12.3.4. Others (Enclosure, Isolators, Fuses)
12.4. Low Voltage (LV) and Medium Voltage (MV) Switchgear Market Value (US$ Mn) and Volume (Thousand Units) Analysis & Forecast, by Insulation, 2017–2031
12.4.1. Air Insulated Switchgear
12.4.2. Gas Insulated Switchgear
12.4.3. Others (Oil and Solid)Others (Enclosure, Isolators, Fuses)
12.5. Low Voltage (LV) and Medium Voltage (MV) Switchgear Market Value (US$ Mn) Analysis & Forecast, by Installation, 2017–2031
12.5.1. Indoor
12.5.2. Outdoor
12.6. Low Voltage (LV) and Medium Voltage (MV) Switchgear Market Value (US$ Mn) Analysis & Forecast, by End-use Industry, 2017–2031
12.6.1. Automotive
12.6.2. IT and Telecommunication
12.6.3. Energy & Utility
12.6.4. Metals & Mining
12.6.5. Food & Beverage
12.6.6. Chemicals
12.6.7. Oil & Gas
12.6.8. Building & Construction
12.6.9. Others (Water & Waste Water, Textile, etc.)
12.7. Low Voltage (LV) and Medium Voltage (MV) Switchgear Value (US$ Mn) and Volume (Thousand Units) Analysis & Forecast, by Country/Sub-region and Sub-region, 2017–2031
12.7.1. The U.K.
12.7.2. Germany
12.7.3. France
12.7.4. Rest of Europe
12.8. Market Attractiveness Analysis
12.8.1. By Voltage Range
12.8.2. By Components
12.8.3. By Insulation
12.8.4. By Installation
12.8.5. By End-use Industry
12.8.6. By Country/Sub-region/Sub-region
13. Asia Pacific Low Voltage (LV) and Medium Voltage (MV) Switchgear Market Analysis and Forecast
13.1. Market Snapshot
13.2. Low Voltage (LV) and Medium Voltage (MV) Switchgear Market Value (US$ Mn) and Volume (Thousand Units) Analysis & Forecast, by Voltage Range, 2017–2031
13.2.1. Less than 1kV
13.2.2. 1kV – 5kV
13.2.3. 6kV – 15kV
13.2.4. 17kV – 27kV
13.2.5. 28kV – 40kV
13.3. Low Voltage (LV) and Medium Voltage (MV) Switchgear Market Value (US$ Mn) and Volume (Thousand Units) Analysis & Forecast, by Components, 2017–2031
13.3.1. Circuit Breaker
13.3.2. Relays
13.3.3. Bus Bars and Switches
13.3.4. Others (Enclosure, Isolators, Fuses)
13.4. Low Voltage (LV) and Medium Voltage (MV) Switchgear Market Value (US$ Mn) and Volume (Thousand Units) Analysis & Forecast, by Insulation, 2017–2031
13.4.1. Air Insulated Switchgear
13.4.2. Gas Insulated Switchgear
13.4.3. Others (Oil and Solid)Others (Enclosure, Isolators, Fuses)
13.5. Low Voltage (LV) and Medium Voltage (MV) Switchgear Market Value (US$ Mn) Analysis & Forecast, by Installation, 2017–2031
13.5.1. Indoor
13.5.2. Outdoor
13.6. Low Voltage (LV) and Medium Voltage (MV) Switchgear Market Value (US$ Mn) Analysis & Forecast, by End-use Industry, 2017–2031
13.6.1. Automotive
13.6.2. IT and Telecommunication
13.6.3. Energy & Utility
13.6.4. Metals & Mining
13.6.5. Food & Beverage
13.6.6. Chemicals
13.6.7. Oil & Gas
13.6.8. Building & Construction
13.6.9. Others (Water & Waste Water, Textile, etc.)
13.7. Low Voltage (LV) and Medium Voltage (MV) Switchgear Value (US$ Mn) and Volume (Thousand Units) Analysis & Forecast, by Country/Sub-region and Sub-region, 2017–2031
13.7.1. China
13.7.2. India
13.7.3. Japan
13.7.4. South Korea
13.7.5. ASEAN
13.7.6. Rest of Asia Pacific
13.8. Market Attractiveness Analysis
13.8.1. By Voltage Range
13.8.2. By Components
13.8.3. By Insulation
13.8.4. By Installation
13.8.5. By End-use Industry
13.8.6. By Country/Sub-region/Sub-region
14. Middle East & Africa Low Voltage (LV) and Medium Voltage (MV) Switchgear Market Analysis and Forecast
14.1. Market Snapshot
14.2. Low Voltage (LV) and Medium Voltage (MV) Switchgear Market Value (US$ Mn) and Volume (Thousand Units) Analysis & Forecast, by Voltage Range, 2017–2031
14.2.1. Less than 1kV
14.2.2. 1kV – 5kV
14.2.3. 6kV – 15kV
14.2.4. 17kV – 27kV
14.2.5. 28kV – 40kV
14.3. Low Voltage (LV) and Medium Voltage (MV) Switchgear Market Value (US$ Mn) and Volume (Thousand Units) Analysis & Forecast, by Components, 2017–2031
14.3.1. Circuit Breaker
14.3.2. Relays
14.3.3. Bus Bars and Switches
14.3.4. Others (Enclosure, Isolators, Fuses)
14.4. Low Voltage (LV) and Medium Voltage (MV) Switchgear Market Value (US$ Mn) and Volume (Thousand Units) Analysis & Forecast, by Insulation, 2017–2031
14.4.1. Air Insulated Switchgear
14.4.2. Gas Insulated Switchgear
14.4.3. Others (Oil and Solid)Others (Enclosure, Isolators, Fuses)
14.5. Low Voltage (LV) and Medium Voltage (MV) Switchgear Market Value (US$ Mn) Analysis & Forecast, by Installation, 2017–2031
14.5.1. Indoor
14.5.2. Outdoor
14.6. Low Voltage (LV) and Medium Voltage (MV) Switchgear Market Value (US$ Mn) Analysis & Forecast, by End-use Industry, 2017–2031
14.6.1. Automotive
14.6.2. IT and Telecommunication
14.6.3. Energy & Utility
14.6.4. Metals & Mining
14.6.5. Food & Beverage
14.6.6. Chemicals
14.6.7. Oil & Gas
14.6.8. Building & Construction
14.6.9. Others (Water & Waste Water, Textile, etc.)
14.7. Low Voltage (LV) and Medium Voltage (MV) Switchgear Market Value (US$ Mn) and Volume (Thousand Units) Analysis & Forecast, by Country/Sub-region and Sub-region, 2017–2031
14.7.1. GCC
14.7.2. South Africa
14.7.3. Rest of Middle East and Africa
14.8. Market Attractiveness Analysis
14.8.1. By Voltage Range
14.8.2. By Components
14.8.3. By Insulation
14.8.4. By Installation
14.8.5. By End-use Industry
14.8.6. By Country/Sub-region/Sub-region
15. South America Low Voltage (LV) and Medium Voltage (MV) Switchgear Market Analysis and Forecast
15.1. Market Snapshot
15.2. Low Voltage (LV) and Medium Voltage (MV) Switchgear Market Value (US$ Mn) and Volume (Thousand Units) Analysis & Forecast, by Voltage Range, 2017–2031
15.2.1. Less than 1kV
15.2.2. 1kV – 5kV
15.2.3. 6kV – 15kV
15.2.4. 17kV – 27kV
15.2.5. 28kV – 40kV
15.3. Low Voltage (LV) and Medium Voltage (MV) Switchgear Market Value (US$ Mn) and Volume (Thousand Units) Analysis & Forecast, by Components, 2017–2031
15.3.1. Circuit Breaker
15.3.2. Relays
15.3.3. Bus Bars and Switches
15.3.4. Others (Enclosure, Isolators, Fuses)
15.4. Low Voltage (LV) and Medium Voltage (MV) Switchgear Market Value (US$ Mn) and Volume (Thousand Units) Analysis & Forecast, by Insulation, 2017–2031
15.4.1. Air Insulated Switchgear
15.4.2. Gas Insulated Switchgear
15.4.3. Others (Oil and Solid)Others (Enclosure, Isolators, Fuses)
15.5. Low Voltage (LV) and Medium Voltage (MV) Switchgear Market Value (US$ Mn) Analysis & Forecast, by Installation, 2017–2031
15.5.1. Indoor
15.5.2. Outdoor
15.6. Low Voltage (LV) and Medium Voltage (MV) Switchgear Market Value (US$ Mn) Analysis & Forecast, by End-use Industry, 2017–2031
15.6.1. Automotive
15.6.2. IT and Telecommunication
15.6.3. Energy & Utility
15.6.4. Metals & Mining
15.6.5. Food & Beverage
15.6.6. Chemicals
15.6.7. Oil & Gas
15.6.8. Building & Construction
15.6.9. Others (Water & Waste Water, Textile, etc.)
15.7. Low Voltage (LV) and Medium Voltage (MV) Switchgear Value (US$ Mn) and Volume (Thousand Units) Analysis & Forecast, by Country/Sub-region and Sub-region, 2017–2031
15.7.1. Brazil
15.7.2. Rest of South America
15.8. Market Attractiveness Analysis
15.8.1. By Voltage Range
15.8.2. By Components
15.8.3. By Insulation
15.8.4. By Installation
15.8.5. By End-use Industry
15.8.6. By Country/Sub-region/Sub-region
16. Competition Assessment
16.1. Global Low Voltage (LV) and Medium Voltage (MV) Switchgear Market Competition Matrix - a Dashboard View
16.1.1. Global Low Voltage (LV) and Medium Voltage (MV) Switchgear Market Company Share Analysis, by Value (2021)
16.1.2. Technological Differentiator
17. Company Profiles (Global Manufacturers/Suppliers)
17.1. ABB
17.1.1. Overview
17.1.2. Product Portfolio
17.1.3. Sales Footprint
17.1.4. Key Subsidiaries or Distributors
17.1.5. Strategy and Recent Developments
17.1.6. Key Financials
17.2. CG Power & Industrial Solutions Ltd.
17.2.1. Overview
17.2.2. Product Portfolio
17.2.3. Sales Footprint
17.2.4. Key Subsidiaries or Distributors
17.2.5. Strategy and Recent Developments
17.2.6. Key Financials
17.3. Eaton Corporation plc.
17.3.1. Overview
17.3.2. Product Portfolio
17.3.3. Sales Footprint
17.3.4. Key Subsidiaries or Distributors
17.3.5. Strategy and Recent Developments
17.3.6. Key Financials
17.4. Efacec
17.4.1. Overview
17.4.2. Product Portfolio
17.4.3. Sales Footprint
17.4.4. Key Subsidiaries or Distributors
17.4.5. Strategy and Recent Developments
17.4.6. Key Financials
17.5. Fuji Electric Co., Ltd.
17.5.1. Overview
17.5.2. Product Portfolio
17.5.3. Sales Footprint
17.5.4. Key Subsidiaries or Distributors
17.5.5. Strategy and Recent Developments
17.5.6. Key Financials
17.6. General Electric
17.6.1. Overview
17.6.2. Product Portfolio
17.6.3. Sales Footprint
17.6.4. Key Subsidiaries or Distributors
17.6.5. Strategy and Recent Developments
17.6.6. Key Financials
17.7. Hyosung Heavy Industries
17.7.1. Overview
17.7.2. Product Portfolio
17.7.3. Sales Footprint
17.7.4. Key Subsidiaries or Distributors
17.7.5. Strategy and Recent Developments
17.7.6. Key Financials
17.8. Powell Industries Inc.
17.8.1. Overview
17.8.2. Product Portfolio
17.8.3. Sales Footprint
17.8.4. Key Subsidiaries or Distributors
17.8.5. Strategy and Recent Developments
17.8.6. Key Financials
17.9. Siemens AG
17.9.1. Overview
17.9.2. Product Portfolio
17.9.3. Sales Footprint
17.9.4. Key Subsidiaries or Distributors
17.9.5. Strategy and Recent Developments
17.9.6. Key Financials
17.10. Schneider Electric SE
17.10.1. Overview
17.10.2. Product Portfolio
17.10.3. Sales Footprint
17.10.4. Key Subsidiaries or Distributors
17.10.5. Strategy and Recent Developments
17.10.6. Key Financials
17.11. Mitsubishi Electric Corporation
17.11.1. Overview
17.11.2. Product Portfolio
17.11.3. Sales Footprint
17.11.4. Key Subsidiaries or Distributors
17.11.5. Strategy and Recent Developments
17.11.6. Key Financials
17.12. BHEL
17.12.1. Overview
17.12.2. Product Portfolio
17.12.3. Sales Footprint
17.12.4. Key Subsidiaries or Distributors
17.12.5. Strategy and Recent Developments
17.12.6. Key Financials
17.13. Regal Rexnord Corporation
17.13.1. Overview
17.13.2. Product Portfolio
17.13.3. Sales Footprint
17.13.4. Key Subsidiaries or Distributors
17.13.5. Strategy and Recent Developments
17.13.6. Key Financials
18. Recommendation
18.1. Opportunity Assessment
18.1.1. By Voltage Range
18.1.2. By Components
18.1.3. By Insulation
18.1.4. By Installation
18.1.5. By End-use Industry
18.1.6. By Region
List of Tables
Table 01: Global Low Voltage (LV) and Medium Voltage (MV) Switchgear Market Size & Forecast, by Voltage Range, Value (US$ Mn), 2017‒2031
Table 02: Global Low Voltage (LV) and Medium Voltage (MV) Switchgear Market Size & Forecast, by Voltage Range, Volume (Thousand Units), 2017‒2031
Table 03: Global Low Voltage (LV) and Medium Voltage (MV) Switchgear Market Size & Forecast, by Components, Value (US$ Mn), 2017‒2031
Table 04: Global Low Voltage (LV) and Medium Voltage (MV) Switchgear Market Size & Forecast, by Components, Volume (Thousand Units), 2017‒2031
Table 05: Global Low Voltage (LV) and Medium Voltage (MV) Switchgear Market Size & Forecast, by Insulation, Value (US$ Mn), 2017‒2031
Table 06: Global Low Voltage (LV) and Medium Voltage (MV) Switchgear Market Size & Forecast, by Insulation, Volume (Thousand Units), 2017‒2031
Table 07: Global Low Voltage (LV) and Medium Voltage (MV) Switchgear Market Size & Forecast, by Installation, Value (US$ Mn), 2017‒2031
Table 08: Global Low Voltage (LV) and Medium Voltage (MV) Switchgear Market Size & Forecast, by End-use Industry, Value (US$ Mn), 2017‒2031
Table 09: Global Low Voltage (LV) and Medium Voltage (MV) Switchgear Market Size & Forecast, by Region, Value (US$ Mn), 2017‒2031
Table 10: Global Low Voltage (LV) and Medium Voltage (MV) Switchgear Market Size & Forecast, by Region, Volume (Thousand Units), 2017‒2031
Table 11: North America Low Voltage (LV) and Medium Voltage (MV) Switchgear Market Size & Forecast, by Voltage Range, Value (US$ Mn), 2017‒2031
Table 12: North America Low Voltage (LV) and Medium Voltage (MV) Switchgear Market Size & Forecast, by Voltage Range, Volume (Thousand Units), 2017‒2031
Table 13: North America Low Voltage (LV) and Medium Voltage (MV) Switchgear Market Size & Forecast, by Components, Value (US$ Mn), 2017‒2031
Table 14: North America Low Voltage (LV) and Medium Voltage (MV) Switchgear Market Size & Forecast, by Components, Volume (Thousand Units), 2017‒2031
Table 15: North America Low Voltage (LV) and Medium Voltage (MV) Switchgear Market Size & Forecast, by Insulation, Value (US$ Mn), 2017‒2031
Table 16: North America Low Voltage (LV) and Medium Voltage (MV) Switchgear Market Size & Forecast, by Insulation, Volume (Thousand Units), 2017‒2031
Table 17: North America Low Voltage (LV) and Medium Voltage (MV) Switchgear Market Size & Forecast, by Installation, Value (US$ Mn), 2017‒2031
Table 18: North America Low Voltage (LV) and Medium Voltage (MV) Switchgear Market Size & Forecast, by End-use Industry, Value (US$ Mn), 2017‒2031
Table 19: North America Low Voltage (LV) and Medium Voltage (MV) Switchgear Market Size & Forecast, by Country/Sub-region, Value (US$ Mn), 2017‒2031
Table 20: North America Low Voltage (LV) and Medium Voltage (MV) Switchgear Market Size & Forecast, by Country/Sub-region, Volume (Thousand Units), 2017‒2031
Table 21: Europe Low Voltage (LV) and Medium Voltage (MV) Switchgear Market Size & Forecast, by Voltage Range, Value (US$ Mn), 2017‒2031
Table 22: Europe Low Voltage (LV) and Medium Voltage (MV) Switchgear Market Size & Forecast, by Voltage Range, Volume (Thousand Units), 2017‒2031
Table 23: Europe Low Voltage (LV) and Medium Voltage (MV) Switchgear Market Size & Forecast, by Components, Value (US$ Mn), 2017‒2031
Table 24: Europe Low Voltage (LV) and Medium Voltage (MV) Switchgear Market Size & Forecast, by Components, Volume (Thousand Units), 2017‒2031
Table 25: Europe Low Voltage (LV) and Medium Voltage (MV) Switchgear Market Size & Forecast, by Insulation, Value (US$ Mn), 2017‒2031
Table 26: Europe Low Voltage (LV) and Medium Voltage (MV) Switchgear Market Size & Forecast, by Insulation, Volume (Thousand Units), 2017‒2031
Table 27: Europe Low Voltage (LV) and Medium Voltage (MV) Switchgear Market Size & Forecast, by Installation, Value (US$ Mn), 2017‒2031
Table 28: Europe Low Voltage (LV) and Medium Voltage (MV) Switchgear Market Size & Forecast, by End-use Industry, Value (US$ Mn), 2017‒2031
Table 29: Europe Low Voltage (LV) and Medium Voltage (MV) Switchgear Market Size & Forecast, by Country and Sub-region, Value (US$ Mn), 2017‒2031
Table 30: Europe Low Voltage (LV) and Medium Voltage (MV) Switchgear Market Size & Forecast, by Country and Sub-region, Volume (Thousand Units), 2017‒2031
Table 31: Asia Pacific Low Voltage (LV) and Medium Voltage (MV) Switchgear Market Size & Forecast, by Voltage Range, Value (US$ Mn), 2017‒2031
Table 32: Asia Pacific Low Voltage (LV) and Medium Voltage (MV) Switchgear Market Size & Forecast, by Voltage Range, Volume (Thousand Units), 2017‒2031
Table 33: Asia Pacific Low Voltage (LV) and Medium Voltage (MV) Switchgear Market Size & Forecast, by Components, Value (US$ Mn), 2017‒2031
Table 34: Asia Pacific Low Voltage (LV) and Medium Voltage (MV) Switchgear Market Size & Forecast, by Components, Volume (Thousand Units), 2017‒2031
Table 35: Asia Pacific Low Voltage (LV) and Medium Voltage (MV) Switchgear Market Size & Forecast, by Insulation, Value (US$ Mn), 2017‒2031
Table 36: Asia Pacific Low Voltage (LV) and Medium Voltage (MV) Switchgear Market Size & Forecast, by Insulation, Volume (Thousand Units), 2017‒2031
Table 37: Asia Pacific Low Voltage (LV) and Medium Voltage (MV) Switchgear Market Size & Forecast, by Installation, Value (US$ Mn), 2017‒2031
Table 38: Asia Pacific Low Voltage (LV) and Medium Voltage (MV) Switchgear Market Size & Forecast, by End-use Industry, Value (US$ Mn), 2017‒2031
Table 39: Asia Pacific Low Voltage (LV) and Medium Voltage (MV) Switchgear Market Size & Forecast, by Country and Sub-region, Value (US$ Mn), 2017‒2031
Table 40: Asia Pacific Low Voltage (LV) and Medium Voltage (MV) Switchgear Market Size & Forecast, by Country and Sub-region, Volume (Thousand Units), 2017‒2031
Table 41: Middle East & Africa Low Voltage (LV) and Medium Voltage (MV) Switchgear Market Size & Forecast, by Voltage Range, Value (US$ Mn), 2017‒2031
Table 42: Middle East & Africa Low Voltage (LV) and Medium Voltage (MV) Switchgear Market Size & Forecast, by Voltage Range, Volume (Mn Units), 2017‒2031
Table 43: Middle East & Africa Low Voltage (LV) and Medium Voltage (MV) Switchgear Market Size & Forecast, by Components, Value (US$ Mn), 2017‒2031
Table 44: Middle East & Africa Low Voltage (LV) and Medium Voltage (MV) Switchgear Market Size & Forecast, by Components, Volume (Mn Units), 2017‒2031
Table 45: Middle East & Africa Low Voltage (LV) and Medium Voltage (MV) Switchgear Market Size & Forecast, by Insulation, Value (US$ Mn), 2017‒2031
Table 46: Middle East & Africa Low Voltage (LV) and Medium Voltage (MV) Switchgear Market Size & Forecast, by Insulation, Volume (Mn Units), 2017‒2031
Table 47: Middle East & Africa Low Voltage (LV) and Medium Voltage (MV) Switchgear Market Size & Forecast, by Installation, Value (US$ Mn), 2017‒2031
Table 48: Middle East & Africa Low Voltage (LV) and Medium Voltage (MV) Switchgear Market Size & Forecast, by End-use Industry, Value (US$ Mn), 2017‒2031
Table 49: Middle East & Africa (MEA) Low Voltage (LV) and Medium Voltage (MV) Switchgear Market Size & Forecast, by Country and Sub-region, Value (US$ Mn), 2017‒2031
Table 50: Middle East & Africa (MEA) Low Voltage (LV) and Medium Voltage (MV) Switchgear Market Size & Forecast, by Country and Sub-region, Volume (Mn Units), 2017‒2031
Table 51: South America Low Voltage (LV) and Medium Voltage (MV) Switchgear Market Size & Forecast, by Voltage Range, Value (US$ Mn), 2017‒2031
Table 52: South America Low Voltage (LV) and Medium Voltage (MV) Switchgear Market Size & Forecast, by Voltage Range, Volume (Mn Units), 2017‒2031
Table 53: South America Low Voltage (LV) and Medium Voltage (MV) Switchgear Market Size & Forecast, by Components, Value (US$ Mn), 2017‒2031
Table 54: South America Low Voltage (LV) and Medium Voltage (MV) Switchgear Market Size & Forecast, by Components, Volume (Mn Units), 2017‒2031
Table 55: South America Low Voltage (LV) and Medium Voltage (MV) Switchgear Market Size & Forecast, by Insulation, Value (US$ Mn), 2017‒2031
Table 56: South America Low Voltage (LV) and Medium Voltage (MV) Switchgear Market Size & Forecast, by Insulation, Volume (Mn Units), 2017‒2031
Table 57: South America Low Voltage (LV) and Medium Voltage (MV) Switchgear Market Size & Forecast, by Installation, Value (US$ Mn), 2017‒2031
Table 58: South America Low Voltage (LV) and Medium Voltage (MV) Switchgear Market Size & Forecast, by End-use Industry, Value (US$ Mn), 2017‒2031
Table 59: South America Low Voltage (LV) and Medium Voltage (MV) Switchgear Market Size & Forecast, by Country and Sub-region, Volume (Mn Units), 2017‒2031
Table 60: South America Low Voltage (LV) and Medium Voltage (MV) Switchgear Market Size & Forecast, by Country and Sub-region, Volume (Mn Units), 2017‒2031
List of Figures
Figure 01: Global Low Voltage (LV) and Medium Voltage (MV) Switchgear Market Size & Forecast, Value (US$ Mn), 2017‒2031
Figure 02: Global Low Voltage (LV) and Medium Voltage (MV) Switchgear Market Size & Forecast, Volume (Thousand Units), 2017‒2031
Figure 03: Global Low Voltage (LV) and Medium Voltage (MV) Switchgear Market, Value (US$ Mn), 2017‒2031
Figure 04: Global Low Voltage (LV) and Medium Voltage (MV) Switchgear Market Size & Forecast, by Voltage Range, Revenue (US$ Mn), 2017‒2031
Figure 05: Global Low Voltage (LV) and Medium Voltage (MV) Switchgear Market Attractiveness, by Voltage Range, Value (US$ Mn), 2022‒2031
Figure 06: Global Low Voltage (LV) and Medium Voltage (MV) Switchgear Market Share Analysis, by Voltage Range, 2022 and 2031
Figure 07: Global Low Voltage (LV) and Medium Voltage (MV) Switchgear Market Size & Forecast, by Components, Revenue (US$ Mn), 2017‒2031
Figure 08: Global Low Voltage (LV) and Medium Voltage (MV) Switchgear Market Attractiveness, by Components, Value (US$ Mn), 2022‒2031
Figure 09: Global Low Voltage (LV) and Medium Voltage (MV) Switchgear Market Share Analysis, by Components, 2022 and 2031
Figure 10: Global Low Voltage (LV) and Medium Voltage (MV) Switchgear Market Size & Forecast, by Insulation, Revenue (US$ Mn), 2017‒2031
Figure 11: Global Low Voltage (LV) and Medium Voltage (MV) Switchgear Market Attractiveness, by Insulation, Value (US$ Mn), 2022‒2031
Figure 12: Global Low Voltage (LV) and Medium Voltage (MV) Switchgear Market Share Analysis, by Insulation, 2022 and 2031
Figure 13: Global Low Voltage (LV) and Medium Voltage (MV) Switchgear Market Size & Forecast, by Installation, Revenue (US$ Mn), 2017‒2031
Figure 14: Global Low Voltage (LV) and Medium Voltage (MV) Switchgear Market Attractiveness, by Installation, Value (US$ Mn), 2022‒2031
Figure 15: Global Low Voltage (LV) and Medium Voltage (MV) Switchgear Market Share Analysis, by Installation, 2022 and 2031
Figure 16: Global Low Voltage (LV) and Medium Voltage (MV) Switchgear Market Size & Forecast, by End-use Industry, Revenue (US$ Mn), 2017‒2031
Figure 17: Global Low Voltage (LV) and Medium Voltage (MV) Switchgear Market Attractiveness, by End-use Industry, Value (US$ Mn), 2022‒2031
Figure 18: Global Low Voltage (LV) and Medium Voltage (MV) Switchgear Market Share Analysis, by End-use Industry, 2022 and 2031
Figure 19: Global Low Voltage (LV) and Medium Voltage (MV) Switchgear Market Size & Forecast, by Region, Revenue (US$ Mn), 2017‒2031
Figure 20: Global Low Voltage (LV) and Medium Voltage (MV) Switchgear Market Attractiveness, by Region, Value (US$ Mn), 2022‒2031
Figure 21: Global Low Voltage (LV) and Medium Voltage (MV) Switchgear Market Share Analysis, by Region, 2022 and 2031
Figure 22: Global Low Voltage (LV) and Medium Voltage (MV) Switchgear Market Size & Forecast, Value (US$ Mn ), 2017‒2031
Figure 23: Global Low Voltage (LV) and Medium Voltage (MV) Switchgear Market Size & Forecast, Volume (Thousand Units), 2017‒2031
Figure 24: North America Low Voltage (LV) and Medium Voltage (MV) Switchgear Market, Value (US$ Mn), 2017‒2031
Figure 25: North America Low Voltage (LV) and Medium Voltage (MV) Switchgear Market Size & Forecast, by Voltage Range, Revenue (US$ Mn), 2017‒2031
Figure 26: North America Low Voltage (LV) and Medium Voltage (MV) Switchgear Market Attractiveness, by Voltage Range, Value (US$ Mn), 2022‒2031
Figure 27: North America Low Voltage (LV) and Medium Voltage (MV) Switchgear Market Share Analysis, by Voltage Range, 2022 and 2031
Figure 28: North America Low Voltage (LV) and Medium Voltage (MV) Switchgear Market Size & Forecast, by Components, Revenue (US$ Mn), 2017‒2031
Figure 29: North America Low Voltage (LV) and Medium Voltage (MV) Switchgear Market Attractiveness, by Components, Value (US$ Mn), 2022‒2031
Figure 30: North America Low Voltage (LV) and Medium Voltage (MV) Switchgear Market Share Analysis, by Components, 2022 and 2031
Figure 31: North America Low Voltage (LV) and Medium Voltage (MV) Switchgear Market Size & Forecast, by Insulation, Revenue (US$ Mn), 2017‒2031
Figure 32: North America Low Voltage (LV) and Medium Voltage (MV) Switchgear Market Attractiveness, by Insulation, Value (US$ Mn), 2022‒2031
Figure 33: North America Low Voltage (LV) and Medium Voltage (MV) Switchgear Market Share Analysis, by Insulation, 2022 and 2031
Figure 34: North America Low Voltage (LV) and Medium Voltage (MV) Switchgear Market Size & Forecast, by Installation, Revenue (US$ Mn), 2017‒2031
Figure 35: North America Low Voltage (LV) and Medium Voltage (MV) Switchgear Market Attractiveness, by Installation, Value (US$ Mn), 2022‒2031
Figure 36: North America Low Voltage (LV) and Medium Voltage (MV) Switchgear Market Share Analysis, by Installation, 2022 and 2031
Figure 37: North America Low Voltage (LV) and Medium Voltage (MV) Switchgear Market Size & Forecast, by End-use Industry, Revenue (US$ Mn), 2017‒2031
Figure 38: North America Low Voltage (LV) and Medium Voltage (MV) Switchgear Market Attractiveness, by End-use Industry, Value (US$ Mn), 2022‒2031
Figure 39: North America Low Voltage (LV) and Medium Voltage (MV) Switchgear Market Share Analysis, by End-use Industry, 2022 and 2031
Figure 40: North America Low Voltage (LV) and Medium Voltage (MV) Switchgear Market Size & Forecast, by Country, Revenue (US$ Mn), 2017‒2031
Figure 41: North America Low Voltage (LV) and Medium Voltage (MV) Switchgear Market Attractiveness, by Country, Value (US$ Mn), 2022‒2031
Figure 42: North America Low Voltage (LV) and Medium Voltage (MV) Switchgear Market Share Analysis, by Country, 2022 and 2031
Figure 43: Europe Low Voltage (LV) and Medium Voltage (MV) Switchgear Market Size & Forecast, Value (US$ Mn ), 2017‒2031
Figure 44: Europe Low Voltage (LV) and Medium Voltage (MV) Switchgear Market Size & Forecast, Volume (Thousand Units), 2017‒2031
Figure 45: Europe Low Voltage (LV) and Medium Voltage (MV) Switchgear Market, Value (US$ Mn), 2017‒2031
Figure 46: Europe Low Voltage (LV) and Medium Voltage (MV) Switchgear Market Size & Forecast, by Voltage Range, Revenue (US$ Mn), 2017‒2031
Figure 47: Europe Low Voltage (LV) and Medium Voltage (MV) Switchgear Market Attractiveness, by Voltage Range, Value (US$ Mn), 2022‒2031
Figure 48: Europe Low Voltage (LV) and Medium Voltage (MV) Switchgear Market Share Analysis, by Voltage Range, 2022 and 2031
Figure 49: Europe Low Voltage (LV) and Medium Voltage (MV) Switchgear Market Size & Forecast, by Components, Revenue (US$ Mn), 2017‒2031
Figure 50: Europe Low Voltage (LV) and Medium Voltage (MV) Switchgear Market Attractiveness, by Components, Value (US$ Mn), 2022‒2031
Figure 51: Europe Low Voltage (LV) and Medium Voltage (MV) Switchgear Market Share Analysis, by Components, 2022 and 2031
Figure 52: Europe Low Voltage (LV) and Medium Voltage (MV) Switchgear Market Size & Forecast, by Insulation, Revenue (US$ Mn), 2017‒2031
Figure 53: Europe Low Voltage (LV) and Medium Voltage (MV) Switchgear Market Attractiveness, by Insulation, Value (US$ Mn), 2022‒2031
Figure 54: Europe Low Voltage (LV) and Medium Voltage (MV) Switchgear Market Share Analysis, by Insulation, 2022 and 2031
Figure 55: Europe Low Voltage (LV) and Medium Voltage (MV) Switchgear Market Size & Forecast, by Installation, Revenue (US$ Mn), 2017‒2031
Figure 56: Europe Low Voltage (LV) and Medium Voltage (MV) Switchgear Market Attractiveness, by Installation, Value (US$ Mn), 2022‒2031
Figure 57: Europe Low Voltage (LV) and Medium Voltage (MV) Switchgear Market Share Analysis, by Installation, 2022 and 2031
Figure 58: Europe Low Voltage (LV) and Medium Voltage (MV) Switchgear Market Size & Forecast, by End-use Industry, Revenue (US$ Mn), 2017‒2031
Figure 59: Europe Low Voltage (LV) and Medium Voltage (MV) Switchgear Market Attractiveness, by End-use Industry, Value (US$ Mn), 2022‒2031
Figure 60: Europe Low Voltage (LV) and Medium Voltage (MV) Switchgear Market Share Analysis, by End-use Industry, 2022 and 2031
Figure 61: Europe Low Voltage (LV) and Medium Voltage (MV) Switchgear Market Size & Forecast, by Country and Sub-region, Revenue (US$ Mn), 2017‒2031
Figure 62: Europe Low Voltage (LV) and Medium Voltage (MV) Switchgear Market Attractiveness, by Country and Sub-region, Value (US$ Mn), 2022‒2031
Figure 63: Europe Low Voltage (LV) and Medium Voltage (MV) Switchgear Market Share Analysis, by Country and Sub-region, 2022 and 2031
Figure 64: Asia Pacific Low Voltage (LV) and Medium Voltage (MV) Switchgear Market Size & Forecast, Value (US$ Mn ), 2017‒2031
Figure 65: Asia Pacific Low Voltage (LV) and Medium Voltage (MV) Switchgear Market Size & Forecast, Volume (Thousand Units), 2017‒2031
Figure 66: Asia Pacific Low Voltage (LV) and Medium Voltage (MV) Switchgear Market, Value (US$ Mn), 2017‒2031
Figure 67: Asia Pacific Low Voltage (LV) and Medium Voltage (MV) Switchgear Market Size & Forecast, by Voltage Range, Revenue (US$ Mn), 2017‒2031
Figure 68: Asia Pacific Low Voltage (LV) and Medium Voltage (MV) Switchgear Market Attractiveness, by Voltage Range, Value (US$ Mn), 2022‒2031
Figure 69: Asia Pacific Low Voltage (LV) and Medium Voltage (MV) Switchgear Market Share Analysis, by Voltage Range, 2022 and 2031
Figure 70: Asia Pacific Low Voltage (LV) and Medium Voltage (MV) Switchgear Market Size & Forecast, by Components, Revenue (US$ Mn), 2017‒2031
Figure 71: Asia Pacific Low Voltage (LV) and Medium Voltage (MV) Switchgear Market Attractiveness, by Components, Value (US$ Mn), 2022‒2031
Figure 72: Asia Pacific Low Voltage (LV) and Medium Voltage (MV) Switchgear Market Share Analysis, by Components, 2022 and 2031
Figure 73: Asia Pacific Low Voltage (LV) and Medium Voltage (MV) Switchgear Market Size & Forecast, by Insulation, Revenue (US$ Mn), 2017‒2031
Figure 74: Asia Pacific Low Voltage (LV) and Medium Voltage (MV) Switchgear Market Attractiveness, by Insulation, Value (US$ Mn), 2022‒2031
Figure 75: Asia Pacific Low Voltage (LV) and Medium Voltage (MV) Switchgear Market Share Analysis, by Insulation, 2022 and 2031
Figure 76: Asia Pacific Low Voltage (LV) and Medium Voltage (MV) Switchgear Market Size & Forecast, by Installation, Revenue (US$ Mn), 2017‒2031
Figure 77: Asia Pacific Low Voltage (LV) and Medium Voltage (MV) Switchgear Market Attractiveness, by Installation, Value (US$ Mn), 2022‒2031
Figure 78: Asia Pacific Low Voltage (LV) and Medium Voltage (MV) Switchgear Market Share Analysis, by Installation, 2022 and 2031
Figure 79: Asia Pacific Low Voltage (LV) and Medium Voltage (MV) Switchgear Market Size & Forecast, by End-use Industry, Revenue (US$ Mn), 2017‒2031
Figure 80: Asia Pacific Low Voltage (LV) and Medium Voltage (MV) Switchgear Market Attractiveness, by End-use Industry, Value (US$ Mn), 2022‒2031
Figure 81: Asia Pacific Low Voltage (LV) and Medium Voltage (MV) Switchgear Market Share Analysis, by End-use Industry, 2022 and 2031
Figure 82: Asia Pacific Low Voltage (LV) and Medium Voltage (MV) Switchgear Market Size & Forecast, by Country and Sub-region, Revenue (US$ Mn), 2017‒2031
Figure 83: Asia Pacific Low Voltage (LV) and Medium Voltage (MV) Switchgear Market Attractiveness, by Country and Sub-region, Value (US$ Mn), 2022‒2031
Figure 84: Asia Pacific Low Voltage (LV) and Medium Voltage (MV) Switchgear Market Share Analysis, by Country and Sub-region, 2022 and 2031
Figure 85: Middle East and Africa Low Voltage (LV) and Medium Voltage (MV) Switchgear Market Size & Forecast, Value (US$ Mn ), 2017‒2031
Figure 86: Middle East & Africa Low Voltage (LV) and Medium Voltage (MV) Switchgear Market Size & Forecast, Volume (Thousand Units), 2017‒2031
Figure 87: Middle East & Africa Low Voltage (LV) and Medium Voltage (MV) Switchgear Market, Value (US$ Mn), 2017‒2031
Figure 88: Middle East & Africa Low Voltage (LV) and Medium Voltage (MV) Switchgear Market Size & Forecast, by Voltage Range, Revenue (US$ Mn), 2017‒2031
Figure 89: Middle East & Africa Low Voltage (LV) and Medium Voltage (MV) Switchgear Market Attractiveness, by Voltage Range, Value (US$ Mn), 2022‒2031
Figure 90: Middle East & Africa Low Voltage (LV) and Medium Voltage (MV) Switchgear Market Share Analysis, by Voltage Range, 2022 and 2031
Figure 91: Middle East & Africa Low Voltage (LV) and Medium Voltage (MV) Switchgear Market Size & Forecast, by Components, Revenue (US$ Mn), 2017‒2031
Figure 92: Middle East & Africa Low Voltage (LV) and Medium Voltage (MV) Switchgear Market Attractiveness, by Components, Value (US$ Mn), 2022‒2031
Figure 93: Middle East & Africa Low Voltage (LV) and Medium Voltage (MV) Switchgear Market Share Analysis, by Components, 2022 and 2031
Figure 94: Middle East & Africa Low Voltage (LV) and Medium Voltage (MV) Switchgear Market Size & Forecast, by Insulation, Revenue (US$ Mn), 2017‒2031
Figure 95: Middle East & Africa Low Voltage (LV) and Medium Voltage (MV) Switchgear Market Attractiveness, by Insulation, Value (US$ Mn), 2022‒2031
Figure 96: Middle East & Africa Low Voltage (LV) and Medium Voltage (MV) Switchgear Market Share Analysis, by Insulation, 2022 and 2031
Figure 97: Middle East & Africa Low Voltage (LV) and Medium Voltage (MV) Switchgear Market Size & Forecast, by Installation, Revenue (US$ Mn), 2017‒2031
Figure 98: Middle East & Africa Low Voltage (LV) and Medium Voltage (MV) Switchgear Market Attractiveness, by Installation, Value (US$ Mn), 2022‒2031
Figure 99: Middle East & Africa Low Voltage (LV) and Medium Voltage (MV) Switchgear Market Share Analysis, by Installation, 2022 and 2031
Figure 100: Middle East & Africa Low Voltage (LV) and Medium Voltage (MV) Switchgear Market Size & Forecast, by End-use Industry, Revenue (US$ Mn), 2017‒2031
Figure 101: Middle East & Africa Low Voltage (LV) and Medium Voltage (MV) Switchgear Market Attractiveness, by End-use Industry, Value (US$ Mn), 2022‒2031
Figure 102: Middle East & Africa Low Voltage (LV) and Medium Voltage (MV) Switchgear Market Share Analysis, by End-use Industry, 2022 and 2031
Figure 103: Middle East & Africa Low Voltage (LV) and Medium Voltage (MV) Switchgear Market Size & Forecast, by Country and Sub-region, Revenue (US$ Mn), 2017‒2031
Figure 104: Middle East & Africa Low Voltage (LV) and Medium Voltage (MV) Switchgear Market Attractiveness, by Country and Sub-region, Value (US$ Mn), 2022‒2031
Figure 105: Middle East & Africa Low Voltage (LV) and Medium Voltage (MV) Switchgear Market Share Analysis, by Country and Sub-region, 2022 and 2031
Figure 106: South America Low Voltage (LV) and Medium Voltage (MV) Switchgear Market Size & Forecast, Value (US$ Mn ), 2017‒2031
Figure 107: South America Low Voltage (LV) and Medium Voltage (MV) Switchgear Market Size & Forecast, Volume (Thousand Units), 2017‒2031
Figure 108: South America Low Voltage (LV) and Medium Voltage (MV) Switchgear Market, Value (US$ Mn), 2017‒2031
Figure 109: South America Low Voltage (LV) and Medium Voltage (MV) Switchgear Market Size & Forecast, by Voltage Range, Revenue (US$ Mn), 2017‒2031
Figure 110: South America Low Voltage (LV) and Medium Voltage (MV) Switchgear Market Attractiveness, by Voltage Range, Value (US$ Mn), 2022‒2031
Figure 111: South America Low Voltage (LV) and Medium Voltage (MV) Switchgear Market Share Analysis, by Voltage Range, 2022 and 2031
Figure 112: South America Low Voltage (LV) and Medium Voltage (MV) Switchgear Market Size & Forecast, by Components, Revenue (US$ Mn), 2017‒2031
Figure 113: South America Low Voltage (LV) and Medium Voltage (MV) Switchgear Market Attractiveness, by Components, Value (US$ Mn), 2022‒2031
Figure 114: South America Low Voltage (LV) and Medium Voltage (MV) Switchgear Market Share Analysis, by Components, 2022 and 2031
Figure 115: South America Low Voltage (LV) and Medium Voltage (MV) Switchgear Market Size & Forecast, by Insulation, Revenue (US$ Mn), 2017‒2031
Figure 116: South America Low Voltage (LV) and Medium Voltage (MV) Switchgear Market Attractiveness, by Insulation, Value (US$ Mn), 2022‒2031
Figure 117: South America Low Voltage (LV) and Medium Voltage (MV) Switchgear Market Share Analysis, by Insulation, 2022 and 2031
Figure 118: South America Low Voltage (LV) and Medium Voltage (MV) Switchgear Market Size & Forecast, by Installation, Revenue (US$ Mn), 2017‒2031
Figure 119: South America Low Voltage (LV) and Medium Voltage (MV) Switchgear Market Attractiveness, by Installation, Value (US$ Mn), 2022‒2031
Figure 120: South America Low Voltage (LV) and Medium Voltage (MV) Switchgear Market Share Analysis, by Installation, 2022 and 2031
Figure 121: South America Low Voltage (LV) and Medium Voltage (MV) Switchgear Market Size & Forecast, by End-use Industry, Revenue (US$ Mn), 2017‒2031
Figure 122: South America Low Voltage (LV) and Medium Voltage (MV) Switchgear Market Attractiveness, by End-use Industry, Value (US$ Mn), 2022‒2031
Figure 123: South America Low Voltage (LV) and Medium Voltage (MV) Switchgear Market Share Analysis, by End-use Industry, 2022 and 2031
Figure 124: South America Low Voltage (LV) and Medium Voltage (MV) Switchgear Market Size & Forecast, by Country and Sub-region, Revenue (US$ Mn), 2017‒2031
Figure 125: South America Low Voltage (LV) and Medium Voltage (MV) Switchgear Market Attractiveness, by Country and Sub-region, Value (US$ Mn), 2022‒2031
Figure 126: South America Low Voltage (LV) and Medium Voltage (MV) Switchgear Market Share Analysis, by Country and Sub-region, 2022 and 2031
Copyright © Transparency Market Research, Inc. All Rights reserved
Trust Online

Low Voltage (LV) and Medium Voltage (MV) Switchgear Market