
Reports
Reports
Analysts’ Viewpoint on Global Ink Market Scenario
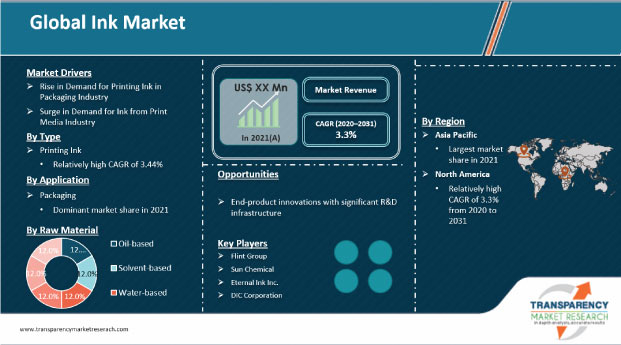
Rapid increase in packaging and commercial printing in emerging economies is estimated to considerably boost the ink market. Manufacturers operating in the ink market are focusing on advanced technologies, such as lithographic ink, and high growth applications, such as packaging printing ink and ceramic tiles, to make their businesses stable after the COVID-19 pandemic. Ink is utilized to produce an image, design, or a text to effectively communicate and address the target audience. The growth of the print media industry is expected to fuel the demand for books, magazines, and other reading materials, which in turn is projected to propel the demand for printing presses. Furthermore, country-level manufacturers should focus on collaborations with global players operating in the ink market. Thus, the demand for ink in the printing industry is expected to rise in the near future.
Ink is a liquid or paste containing dyes and pigments, and its primary application areas are packaging, tags & labels, textiles, and publication commercials. Packaging ink possesses better optical and structural properties, as compared to other inks, for the application segments mentioned above. The global ink market is projected to grow, owing to its favorable properties specifically for applications in packaging and ceramic tiles.
In terms of type, the printing ink segment of the global ink market is expected to exceed the value of US$ 4.3 Bn by end of 2022, attributed to huge demand from various industries such as textiles, clothing, and packaging. Flexible packaging ink is extensively utilized in the packaging industry. Flexography is used throughout the packaging industry for printing text, graphics, and images on non-porous materials that are employed in various applications such as food packaging, cloth packaging, etc. Increasing demand for printing inks in the packaging industry is primarily due to the details mentioned on packages, which address both customers’ basic needs and product quality. This offers customers with information that can be of crucial information to their health. There are numerous benefits of using printing inks on packaging, as it provides information such as the degree of freshness, color, shelf-life, nutritional value, and ingredients. Ink works as an information medium that helps and makes lives safer and better, which in turn is driving various applications in the industry.
In majority of cases, manufacturers prefer lithographic ink. Lithography creates clear, sharp, smooth images and text on diverse materials. Lithographic ink offers several advantages such as versatility, low capital cost, and it improves the speed of printing. Lithographic presses print simultaneously on both sides of the paper, which saves printing time. Thus, manufacturers tend to adopt lithographic ink in packaging and other industries.
Moreover, rapid increase in packaging and commercial printing applications in urban as well as semi-urban areas is expected to significantly boost the ink market. The growing preference for food & beverage packaging, flexible packaging, labels, tags, and corrugated board packaging is also projected to drive the ink market during the forecast period.
Rise in demand for ink from the print media industry is expected to drive the ink market during the forecast period. The demand for ink for paper media is significantly high in emerging economies, especially in developing countries such as India and Vietnam. Newspapers, magazine, books, and others publishing mediums are expected to grow at a rapid pace during the forecast period. Inks are used in books to create attractive images and different textures to attract the attention of readers, thereby propelling the ink market.
The increase in urbanization and education levels across the globe is also likely to propel the ink market. Consistent rise in population, improvement in purchasing power of people, and technological advancements are fueling the ink market.
In terms of type, printing ink consists of lithographic, gravure, flexographic, screen, digital, letterpress, inkjet, and others. Lithographic inks are utilized all over the world for printing catalogues, posters, and books due the high-quality effects imparted by lithographic inks. Flexographic printing is majorly used in flexible package printing, high volume of labels, and packaging due to its lower viscous property. Gravure printing is the process by which an image is engraved over a carrier by employing a rotary printing press. Screen printing uses ink such as UV-cured ink, water-based ink, solvent-based ink, and discharge ink.
The printing ink segment held a major share of the global ink market in 2021. This growth is expected to continue during the forecast period. Inks are primarily employed in packaging in order to print valuable information regarding the product, as most developed economies are key users and producers of packaging.
In terms of formulating technology, the global ink market has been classified into oil-based, solvent-based, water-based, UV-cured, and others. The oil-based segment dominated the global ink market in 2021. The segment is also expected to grow rapidly at a CAGR of 3.8% during the forecast period. Vegetable oils are used in oil-based ink. The lithographic printer tries to utilize this ink, as it is readily available in art supply stores in small-sized tubes.
Asia Pacific dominated the global ink market in 2021, due to the presence of a large number of manufacturers of food & beverage and personal care products in the region. The commercial printing industry in Asia Pacific is also growing at a rapid pace.
In terms of value, Europe followed Asia Pacific, in 2021. Europe also has a significant rigid packaging industry. Food & beverage and personal care industries in the region have reached a saturation point. Several countries in the region are witnessing high per capita consumption of packaged goods.
The packaging industry in North America is a leading customer of printing ink. The region has a large number of prominent players in the printing ink industry. This factor is driving the ink market in North America.
In Middle East & Africa, manufacturers are focused on the development of advanced technological printing equipment such as lithography printing ink. This factor is boosting the print industry in the region.
The global ink market is associated with a small number of large-scale vendors controlling majority of the market share. Key firms are spending significant sums of money on comprehensive research and development, primarily to develop environment-friendly products.
Diversification of product portfolios and mergers & acquisitions are key strategies adopted by major players. Sun Chemical, Flint Group, Wikoff Color Corporation, Siegwerk Druckfarben AG & Co. KGaA , Toyo Ink SC Holdings Co., Ltd., INX International Ink Co. (Subsidiary of Sakata INX), Huber Group, ALTANA AG, T&K Toka Co., Ltd., Zeller+Gmelin GmbH & Co. KG, Sakata INX Corporation, Dainichiseika Color & Chemicals Mfg. Co., Ltd., Tokyo Printing Ink Mfg. Co., Ltd, Marabu GmbH & Co. KG, FUJIFILM Holdings America Corporation, Nutec Digital Ink, DIC Corporation, Royal Dutch Printing Ink Factories Van Son, Intenze Tattoo Ink, SICPA Holding SA, Eternal Ink, Inc., Millennium Colors, Inc., Gleitsmann Security Ink GmbH, Kao Collins Corporation , Zhuhai Letong Chemical Co., Ltd, and ZSCHIMMER & SCHWARZ Ltd are the prominent entities operating in the global ink market.
Each of these players has been profiled in the ink market report based on parameters such as company overview, financial overview, business strategies, product portfolio, business segments, and recent developments.
|
Attribute |
Detail |
|
Market Size Value in 2021 |
US$ 17.3 Bn |
|
Market Forecast Value in 2031 |
US$ 24.1 Bn |
|
Growth Rate (CAGR) |
3.3% |
|
Forecast Period |
2022–2031 |
|
Historical Data Available for |
2020 |
|
Quantitative Units |
US$ Bn for Value and Tons for Volume |
|
Market Analysis |
It includes cross segment analysis at global as well as regional level. Furthermore, qualitative analysis includes drivers, restraints, opportunities, key trends, Porter’s Five Forces analysis, value chain analysis, and key trend analysis. |
|
Competition Landscape |
|
|
Format |
Electronic (PDF) + Excel |
|
Market Segmentation |
|
|
Regions Covered |
|
|
Countries Covered |
|
|
Companies Profiled |
|
|
Customization Scope |
Available upon request |
|
Pricing |
Available upon request |
The market size of ink stood over US$ 17.3 Bn in 2021
The ink market is expected to grow at a CAGR of 3.3% from 2022 to 2031
High demand from packaging industry and for digital printing ink is one of the key factors driving the Ink market
The packaging segment accounted for a key share of 42% of the ink market in 2021
Asia Pacific is a more attractive region for vendors in the ink market
Key players operating in the ink market include Zeller Gmelin GmbH & Co. KG, Sakata INX Corporation, Dainichiseika Color & Chemicals Mfg. Co., Ltd., Tokyo Printing Ink Mfg. Co., Ltd, Marabu GmbH & Co. KG, and FUJIFILM Holdings America Corporation
1. Executive Summary
1.1. Ink Market Snapshot
1.2. Current Market and Future Potential
2. Market Overview
2.1. Market Segmentation
2.2. Market Trends
2.3. Market Dynamics
2.3.1. Drivers
2.3.2. Restraints
2.3.3. Opportunities
2.4. Porter’s Five Forces Analysis
2.5. Regulatory Analysis
2.6. Value Chain Analysis
2.6.1. List of Raw Material Providers
2.6.2. List of Key Manufacturers
2.6.3. List of Suppliers/ Distributors
2.6.4. List of Potential Customers
3. COVID-19 Impact Analysis
4. Production Output Analysis, 2021
5. Price Trend Analysis
6. Global Ink Market Analysis and Forecast, by Type, 2020–2031
6.1. Introduction and Definitions
6.2. Global Ink Market Volume (Kilo Tons) and Value (US$ Mn) Forecast, by Type, 2020–2031
6.2.1. Printing Ink
6.2.2. Non-printing Ink
6.3. Global Ink Market Attractiveness, by Type
7. Global Ink Market Analysis and Forecast, by formulating Technology, 2020–2031
7.1. Introduction and Definitions
7.2. Global Ink Market Volume (Kilo Tons) and Value (US$ Mn) Forecast, by Formulating Technology, 2020–2031
7.2.1. Oil-based
7.2.2. Solvent-based
7.2.3. Water-based
7.2.4. UV-cured
7.2.5. Others
7.3. Global Ink Market Attractiveness, by Formulating Technology
8. Global Ink Market Analysis and Forecast, by Application, 2020–2031
8.1. Introduction and Definitions
8.2. Global Ink Market Volume (Kilo Tons) and Value (US$ Mn) Forecast, by Application, 2020–2031
8.2.1. Packaging
8.2.2. Publication & Commercial
8.2.3. Security
8.2.4. Ceramic Tiles
8.2.5. Tags & Labels
8.2.6. Textiles
8.2.7. Consumer
8.3. Global Ink Market Attractiveness, by Application
9. Global Ink Market Analysis and Forecast, by Region, 2020–2031
9.1. Key Findings
9.2. Global Ink Market Volume (Kilo Tons) and Value (US$ Mn) Forecast, by Region, 2020–2031
9.2.1. North America
9.2.2. Europe
9.2.3. Asia Pacific
9.2.4. Middle East & Africa
9.2.5. Latin America
9.3. Global Ink Market Attractiveness, by Region
10. North America Ink Market Analysis and Forecast, 2020–2031
10.1. Key Findings
10.2. North America Ink Market Volume (Kilo Tons) and Value (US$ Mn) Forecast, by Type, 2020–2031
10.3. North America Ink Market Volume (Kilo Tons) and Value (US$ Mn) Forecast, by Formulating Technology, 2020–2031
10.4. North America Ink Market Volume (Kilo Tons) and Value (US$ Mn) Forecast, by Application, 2020–2031
10.5. North America Ink Market Volume (Kilo Tons) and Value (US$ Mn) Forecast, by Country, 2020–2031
10.5.1. U.S. Ink Market Volume (Kilo Tons) and Value (US$ Mn) Forecast, by Type, 2020–2031
10.5.2. U.S. Ink Market Volume (Kilo Tons) and Value (US$ Mn) Forecast, by Formulating Technology, 2020–2031
10.5.3. U.S. Ink Market Volume (Kilo Tons) and Value (US$ Mn) Forecast, by Application, 2020–2031
10.5.4. Canada Ink Market Volume (Kilo Tons) and Value (US$ Mn) Forecast, by Type, 2020–2031
10.5.5. Canada Ink Market Volume (Kilo Tons) and Value (US$ Mn) Forecast, by Formulating Technology, 2020–2031
10.5.6. Canada Ink Market Volume (Kilo Tons) and Value (US$ Mn) Forecast, by Application, 2020–2031
10.6. North America Ink Market Attractiveness Analysis
11. Europe Ink Market Analysis and Forecast, 2020–2031
11.1. Key Findings
11.2. Europe Ink Market Volume (Kilo Tons) and Value (US$ Mn) Forecast, by Type, 2020–2031
11.3. Europe Ink Market Volume (Kilo Tons) and Value (US$ Mn) Forecast, by Formulating Technology, 2020–2031
11.4. Europe Ink Market Volume (Kilo Tons) and Value (US$ Mn) Forecast, by Application, 2020–2031
11.5. Europe Ink Market Volume (Kilo Tons) and Value (US$ Mn) Forecast, by Country and Sub-region, 2022-2031
11.5.1. Germany Ink Market Volume (Kilo Tons) and Value (US$ Mn) Forecast, by Form, 2020–2031
11.5.2. Germany Ink Market Volume (Kilo Tons) and Value (US$ Mn) Forecast, by Formulating Technology, 2020–2031
11.5.3. Germany Ink Market Volume (Kilo Tons) and Value (US$ Mn) Forecast, by Application, 2020–2031
11.5.4. France Ink Market Volume (Kilo Tons) and Value (US$ Mn) Forecast, by Type, 2020–2031
11.5.5. France Ink Market Volume (Kilo Tons) and Value (US$ Mn) Forecast, by Formulating Technology, 2020–2031
11.5.6. France Ink Market Volume (Kilo Tons) and Value (US$ Mn) Forecast, by Application, 2020–2031
11.5.7. U.K. Ink Market Volume (Kilo Tons) and Value (US$ Mn) Forecast, by Type, 2020–2031
11.5.8. U.K. Ink Market Volume (Kilo Tons) and Value (US$ Mn) Forecast, by Formulating Technology, 2020–2031
11.5.9. U.K. Ink Market Volume (Kilo Tons) and Value (US$ Mn) Forecast, by Application, 2020–2031
11.5.10. Italy Ink Market Volume (Kilo Tons) and Value (US$ Mn) Forecast, by Type, 2020–2031
11.5.11. Italy. Ink Market Volume (Kilo Tons) and Value (US$ Mn) Forecast, by Formulating Technology, 2020–2031
11.5.12. Italy Ink Market Volume (Kilo Tons) and Value (US$ Mn) Forecast, by Application, 2020–2031
11.5.13. Russia & CIS Ink Market Volume (Kilo Tons) and Value (US$ Mn) Forecast, by Type, 2020–2031
11.5.14. Russia & CIS Ink Market Volume (Kilo Tons) and Value (US$ Mn) Forecast, by Formulating Technology, 2020–2031
11.5.15. Russia & CIS Ink Market Volume (Kilo Tons) and Value (US$ Mn) Forecast, by Application, 2020–2031
11.5.16. Rest of Europe Ink Market Volume (Kilo Tons) and Value (US$ Mn) Forecast, by Type, 2020–2031
11.5.17. Rest of Europe Ink Market Volume (Kilo Tons) and Value (US$ Mn) Forecast, by Formulating Technology, 2020–2031
11.5.18. Rest of Europe Ink Market Volume (Kilo Tons) and Value (US$ Mn) Forecast, by Application, 2020–2031
11.6. Europe Ink Market Attractiveness Analysis
12. Asia Pacific Ink Market Analysis and Forecast, 2020–2031
12.1. Key Findings
12.2. Asia Pacific Ink Market Volume (Kilo Tons) and Value (US$ Mn) Forecast, by Type
12.3. Asia Pacific Ink Market Volume (Kilo Tons) and Value (US$ Mn) Forecast, by Formulating Technology, 2020–2031
12.4. Asia Pacific Ink Market Volume (Kilo Tons) and Value (US$ Mn) Forecast, by Application, 2020–2031
12.5. Asia Pacific Ink Market Volume (Kilo Tons) and Value (US$ Mn) Forecast, by Country and Sub-region, 2020-2031
12.5.1. China Ink Market Volume (Kilo Tons) and Value (US$ Mn) Forecast, by Type, 2020–2031
12.5.2. China Ink Market Volume (Kilo Tons) and Value (US$ Mn) Forecast, by Formulating Technology, 2020–2031
12.5.3. China Ink Market Volume (Kilo Tons) and Value (US$ Mn) Forecast, by Application, 2020–2031
12.5.4. Japan Ink Market Volume (Kilo Tons) and Value (US$ Mn) Forecast, by Type, 2020–2031
12.5.5. Japan Ink Market Volume (Kilo Tons) and Value (US$ Mn) Forecast, by Formulating Technology, 2020–2031
12.5.6. Japan Ink Market Volume (Kilo Tons) and Value (US$ Mn) Forecast, by Application, 2020–2031
12.5.7. India Ink Market Volume (Kilo Tons) and Value (US$ Mn) Forecast, by Type, 2020–2031
12.5.8. India Ink Market Volume (Kilo Tons) and Value (US$ Mn) Forecast, by Formulating Technology, 2020–2031
12.5.9. India Ink Market Volume (Kilo Tons) and Value (US$ Mn) Forecast, by Application, 2020–2031
12.5.10. ASEAN Ink Market Volume (Kilo Tons) and Value (US$ Mn) Forecast, by Type, 2020–2031
12.5.11. ASEAN Ink Market Volume (Kilo Tons) and Value (US$ Mn) Forecast, by Formulating Technology, 2020–2031
12.5.12. ASEAN Ink Market Volume (Kilo Tons) and Value (US$ Mn) Forecast, by Application, 2020–2031
12.5.13. Rest of Asia Pacific Ink Market Volume (Kilo Tons) and Value (US$ Mn) Forecast, by Type, 2020–2031
12.5.14. Rest of Asia Pacific Ink Market Volume (Kilo Tons) and Value (US$ Mn) Forecast, by Formulating Technology, 2020–2031
12.5.15. Rest of Asia Pacific Ink Market Volume (Kilo Tons) and Value (US$ Mn) Forecast, by Application, 2020–2031
12.6. Asia Pacific Ink Market Attractiveness Analysis
13. Latin America Ink Market Analysis and Forecast, 2020–2031
13.1. Key Findings
13.2. Latin America Ink Market Volume (Kilo Tons) and Value (US$ Mn) Forecast, by Type, 2020–2031
13.3. Latin America Ink Market Volume (Kilo Tons) and Value (US$ Mn) Forecast, by Formulating Technology, 2020–2031
13.4. Latin America Ink Market Volume (Kilo Tons) and Value (US$ Mn) Forecast, by Application, 2020–2031
13.5. Latin America Ink Market Volume (Kilo Tons) and Value (US$ Mn) Forecast, by Country and Sub-region, 2020-2031
13.5.1. Brazil Ink Market Volume (Kilo Tons) and Value (US$ Mn) Forecast, by Type, 2020–2031
13.5.2. Brazil Ink Market Volume (Kilo Tons) and Value (US$ Mn) Forecast, by Formulating Technology, 2020–2031
13.5.3. Brazil Ink Market Volume (Kilo Tons) and Value (US$ Mn) Forecast, by Application, 2020–2031
13.5.4. Mexico Ink Market Volume (Kilo Tons) and Value (US$ Mn) Forecast, by Type, 2020–2031
13.5.5. Mexico Ink Market Volume (Kilo Tons) and Value (US$ Mn) Forecast, by Formulating Technology, 2020–2031
13.5.6. Mexico Ink Market Volume (Kilo Tons) and Value (US$ Mn) Forecast, by Application, 2020–2031
13.5.7. Rest of Latin America Ink Market Volume (Kilo Tons) and Value (US$ Mn) Forecast, by Type, 2020–2031
13.5.8. Rest of Latin America Ink Market Volume (Kilo Tons) and Value (US$ Mn) Forecast, by Formulating Technology, 2020–2031
13.5.9. Rest of Latin America Ink Market Volume (Kilo Tons) and Value (US$ Mn) Forecast, by Application, 2020–2031
13.6. Latin America Ink Market Attractiveness Analysis
14. Middle East & Africa Ink Market Analysis and Forecast, 2020–2031
14.1. Key Findings
14.2. Middle East & Africa Ink Market Volume (Kilo Tons) and Value (US$ Mn) Forecast, by Type, 2020–2031
14.3. Middle East & Africa Ink Market Volume (Kilo Tons) and Value (US$ Mn) Forecast, by Formulating Technology, 2020–2031
14.4. Middle East & Africa Ink Market Volume (Kilo Tons) and Value (US$ Mn) Forecast, by Application, 2020–2031
14.5. Middle East & Africa Ink Market Volume (Kilo Tons) and Value (US$ Mn) Forecast, by Country and Sub-region, 2020-2031
14.5.1. GCC Ink Market Volume (Kilo Tons) and Value (US$ Mn) Forecast, by Type, 2020–2031
14.5.2. GCC Ink Market Volume (Kilo Tons) and Value (US$ Mn) Forecast, by Formulating Technology, 2020–2031
14.5.3. GCC Ink Market Volume (Kilo Tons) and Value (US$ Mn) Forecast, by Application, 2020–2031
14.5.4. South Africa Ink Market Volume (Kilo Tons) and Value (US$ Mn) Forecast, by Type, 2020–2031
14.5.5. South Africa Ink Market Volume (Kilo Tons) and Value (US$ Mn) Forecast, by Formulating Technology, 2020–2031
14.5.6. South Africa Ink Market Volume (Kilo Tons) and Value (US$ Mn) Forecast, by Application, 2020–2031
14.5.7. Rest of Middle East & Africa Ink Market Volume (Kilo Tons) and Value (US$ Mn) Forecast, by Type, 2020–2031
14.5.8. Rest of Middle East & Africa Ink Market Volume (Kilo Tons) and Value (US$ Mn) Forecast, by Formulating Technology, 2020–2031
14.5.9. Rest of Middle East & Africa Ink Market Volume (Kilo Tons) and Value (US$ Mn) Forecast, by Application, 2020–2031
14.6. Middle East & Africa Ink Market Attractiveness Analysis
15. Competition Landscape
15.1. Global Ink Company Market Share Analysis, 2021
15.2. Company Profiles (Details – Overview, Financials, Recent Developments, and Strategy)
15.2.1. INX International Ink Co. (Subsidiary of Sakata INX)
15.2.1.1. Company Description
15.2.1.2. Business Overview
15.2.1.3. Financial Overview
15.2.1.4. Strategic Overview
15.2.2. DIC Corporation.
15.2.2.1. Company Description
15.2.2.2. Business Overview
15.2.2.3. Financial Overview
15.2.2.4. Strategic Overview
15.2.3. Royal Dutch Printing Ink Factories Van Son
15.2.3.1. Company Description
15.2.3.2. Business Overview
15.2.3.3. Financial Overview
15.2.3.4. Strategic Overview
15.2.4. Nutec Digital Ink AG
15.2.4.1. Company Description
15.2.4.2. Business Overview
15.2.4.3. Financial Overview
15.2.4.4. Strategic Overview
15.2.5. Eternal Ink
15.2.5.1. Company Description
15.2.5.2. Business Overview
15.2.5.3. Financial Overview
15.2.5.4. Strategic Overview
15.2.6. Kao Collins Corporation.
15.2.6.1. Company Description
15.2.6.2. Business Overview
15.2.6.3. Financial Overview
15.2.6.4. Strategic Overview
15.2.7. Zhuhai Letong Chemical Co
15.2.7.1. Company Description
15.2.7.2. Business Overview
15.2.7.3. Financial Overview
15.2.7.4. Strategic Overview
15.2.8. (Huber Group)
15.2.8.1. Company Description
15.2.8.2. Business Overview
15.2.8.3. Financial Overview
15.2.8.4. Strategic Overview
15.2.9. Dainichiseika Color & Chemicals Mfg. Co., Ltd
15.2.9.1. Company Description
15.2.9.2. Business Overview
15.2.9.3. Financial Overview
15.2.9.4. Strategic Overview
15.2.10. T&K Toka Co., Ltd
15.2.10.1. Company Description
15.2.10.2. Business Overview
15.2.10.3. Financial Overview
15.2.10.4. Strategic Overview
15.2.11. Sakata INX Corporation
15.2.11.1. Company Description
15.2.11.2. Business Overview
15.2.11.3. Financial Overview
15.2.11.4. Strategic Overview
15.2.12. Intenze Tattoo Ink
15.2.12.1. Company Description
15.2.12.2. Business Overview
15.2.12.3. Financial Overview
15.2.12.4. Strategic Overview
15.2.13. Kao Collins Corporation
15.2.13.1. Company Description
15.2.13.2. Business Overview
15.2.13.3. Financial Overview
15.2.13.4. Strategic Overview
16. Primary Research: Key Insights
17. Appendix
List of Tables
Table 1: Global Ink Market Volume (Kilo Tons) Forecast, by Type, 2020–2031
Table 2: Global Ink Market Value (US$ Mn) Forecast, by Type, 2020–2031
Table 3: Global Ink Market Volume (Kilo Tons) Forecast, by Formulating Technology, 2020–2031
Table 4: Global Ink Market Value (US$ Mn) Forecast, by Formulating Technology, 2020–2031
Table 5: Global Ink Market Volume (Kilo Tons) Forecast, by Application, 2020–2031
Table 6: Global Ink Market Value (US$ Mn) Forecast, by Application, 2020–2031
Table 7: Global Ink Market Volume (Kilo Tons) Forecast, by Region, 2020–2031
Table 8: Global Ink Market Value (US$ Mn) Forecast, by Region, 2020–2031
Table 9: North America Ink Market Volume (Kilo Tons) Forecast, by Type, 2020–2031
Table 10: North America Ink Market Value (US$ Mn) Forecast, by Type, 2020–2031
Table 11: North America Ink Market Volume (Kilo Tons) Forecast, by Formulating Technology, 2020–2031
Table 12: North America Ink Market Value (US$ Mn) Forecast, by Formulating Technology, 2020–2031
Table 13: North America Ink Market Volume (Kilo Tons) Forecast, by Application, 2020–2031
Table 14: North America Ink Market Value (US$ Mn) Forecast, by Application, 2020–2031
Table 15: North America Ink Market Volume (Kilo Tons) Forecast, by Country, 2020–2031
Table 16: North America Ink Market Value (US$ Mn) Forecast, by Country, 2020–2031
Table 17: U.S. Ink Market Volume (Kilo Tons) Forecast, by Type, 2020–2031
Table 18: U.S. Ink Market Value (US$ Mn) Forecast, by Type, 2020–2031
Table 19: U.S. Ink Market Volume (Kilo Tons) Forecast, by Formulating Technology, 2020–2031
Table 20: U.S. Ink Market Value (US$ Mn) Forecast, by Formulating Technology, 2020–2031
Table 21: U.S. Ink Market Volume (Kilo Tons) Forecast, by Application, 2020–2031
Table 22: U.S. Ink Market Value (US$ Mn) Forecast, by Application, 2020–2031
Table 23: Canada Ink Market Volume (Kilo Tons) Forecast, by Type, 2020–2031
Table 24: Canada Ink Market Value (US$ Mn) Forecast, by Type, 2020–2031
Table 25: Canada Ink Market Volume (Kilo Tons) Forecast, by Formulating Technology, 2020–2031
Table 26: Canada Ink Market Value (US$ Mn) Forecast, by Formulating Technology, 2020–2031
Table 27: Canada Ink Market Volume (Kilo Tons) Forecast, by Application, 2020–2031
Table 28: Canada Ink Market Value (US$ Mn) Forecast, by Application, 2020–2031
Table 29: Europe Ink Market Volume (Kilo Tons) Forecast, by Type, 2020–2031
Table 30: Europe Ink Market Value (US$ Mn) Forecast, by Type, 2020–2031
Table 31: Europe Ink Market Volume (Kilo Tons) Forecast, by Formulating Technology, 2020–2031
Table 32: Europe Ink Market Value (US$ Mn) Forecast, by Formulating Technology, 2020–2031
Table 33: Europe Ink Market Volume (Kilo Tons) Forecast, by Application, 2020–2031
Table 34: Europe Ink Market Value (US$ Mn) Forecast, by Application, 2020–2031
Table 35: Europe Ink Market Volume (Kilo Tons) Forecast, by Country and Sub-region, 2020–2031
Table 36: Europe Ink Market Value (US$ Mn) Forecast, by Country and Sub-region, 2020–2031
Table 37: Germany Ink Market Volume (Kilo Tons) Forecast, by Type, 2020–2031
Table 38: Germany Ink Market Value (US$ Mn) Forecast, by Type, 2020–2031
Table 39: Germany Ink Market Volume (Kilo Tons) Forecast, by Formulating Technology, 2020–2031
Table 40: Germany Ink Market Value (US$ Mn) Forecast, by Formulating Technology, 2020–2031
Table 41: Germany Ink Market Volume (Kilo Tons) Forecast, by Application, 2020–2031
Table 42: Germany Ink Market Value (US$ Mn) Forecast, by Application, 2020–2031
Table 43: France Ink Market Volume (Kilo Tons) Forecast, by Type, 2020–2031
Table 44: France Ink Market Value (US$ Mn) Forecast, by Type, 2020–2031
Table 45: France Ink Market Volume (Kilo Tons) Forecast, by Formulating Technology, 2020–2031
Table 46: France Ink Market Value (US$ Mn) Forecast, by Formulating Technology, 2020–2031
Table 47: France Ink Market Volume (Kilo Tons) Forecast, by Application, 2020–2031
Table 48: France Ink Market Value (US$ Mn) Forecast, by Application, 2020–2031
Table 49: U.K. Ink Market Volume (Kilo Tons) Forecast, by Type, 2020–2031
Table 50: U.K. Ink Market Value (US$ Mn) Forecast, by Type, 2020–2031
Table 51: U.K. Ink Market Volume (Kilo Tons) Forecast, by Formulating Technology, 2020–2031
Table 52: U.K. Ink Market Value (US$ Mn) Forecast, by Formulating Technology, 2020–2031
Table 53: U.K. Ink Market Volume (Kilo Tons) Forecast, by Application, 2020–2031
Table 54: U.K. Ink Market Value (US$ Mn) Forecast, by Application, 2020–2031
Table 55: Italy Ink Market Volume (Kilo Tons) Forecast, by Type, 2020–2031
Table 56: Italy Ink Market Value (US$ Mn) Forecast, by Type, 2020–2031
Table 57: Italy Ink Market Volume (Kilo Tons) Forecast, by Formulating Technology, 2020–2031
Table 58: Italy Ink Market Value (US$ Mn) Forecast, by Formulating Technology, 2020–2031
Table 59: Italy Ink Market Volume (Kilo Tons) Forecast, by Application, 2020–2031
Table 60: Italy Ink Market Value (US$ Mn) Forecast, by Application, 2020–2031
Table 61: Spain Ink Market Volume (Kilo Tons) Forecast, by Type, 2020–2031
Table 62: Spain Ink Market Value (US$ Mn) Forecast, by Type, 2020–2031
Table 63: Spain Ink Market Volume (Kilo Tons) Forecast, by Formulating Technology, 2020–2031
Table 64: Spain Ink Market Value (US$ Mn) Forecast, by Formulating Technology, 2020–2031
Table 65: Spain Ink Market Volume (Kilo Tons) Forecast, by Application, 2020–2031
Table 66: Spain Ink Market Value (US$ Mn) Forecast, by Application, 2020–2031
Table 67: Russia & CIS Ink Market Volume (Kilo Tons) Forecast, by Type, 2020–2031
Table 68: Russia & CIS Ink Market Value (US$ Mn) Forecast, by Type, 2020–2031
Table 69: Russia & CIS Ink Market Volume (Kilo Tons) Forecast, by Formulating Technology, 2020–2031
Table 70: Russia & CIS Ink Market Value (US$ Mn) Forecast, by Formulating Technology, 2020–2031
Table 71: Russia & CIS Ink Market Volume (Kilo Tons) Forecast, by Application, 2020–2031
Table 72: Russia & CIS Ink Market Value (US$ Mn) Forecast, by Application, 2020–2031
Table 73: Rest of Europe Ink Market Volume (Kilo Tons) Forecast, by Type, 2020–2031
Table 74: Rest of Europe Ink Market Value (US$ Mn) Forecast, by Type, 2020–2031
Table 75: Rest of Europe Ink Market Volume (Kilo Tons) Forecast, by Formulating Technology, 2020–2031
Table 76: Rest of Europe Ink Market Value (US$ Mn) Forecast, by Formulating Technology, 2020–2031
Table 77: Rest of Europe Ink Market Volume (Kilo Tons) Forecast, by Application, 2020–2031
Table 78: Rest of Europe Ink Market Value (US$ Mn) Forecast, by Application, 2020–2031
Table 79: Asia Pacific Ink Market Volume (Kilo Tons) Forecast, by Type, 2020–2031
Table 80: Asia Pacific Ink Market Value (US$ Mn) Forecast, by Type, 2020–2031
Table 81: Asia Pacific Ink Market Volume (Kilo Tons) Forecast, by Formulating Technology, 2020–2031
Table 82: Asia Pacific Ink Market Value (US$ Mn) Forecast, by Formulating Technology, 2020–2031
Table 83: Asia Pacific Ink Market Volume (Kilo Tons) Forecast, by Application, 2020–2031
Table 84: Asia Pacific Ink Market Value (US$ Mn) Forecast, by Application, 2020–2031
Table 85: Asia Pacific Ink Market Volume (Kilo Tons) Forecast, by Country and Sub-region, 2020–2031
Table 86: Asia Pacific Ink Market Value (US$ Mn) Forecast, by Country and Sub-region, 2020–2031
Table 87: China Ink Market Volume (Kilo Tons) Forecast, by Type, 2020–2031
Table 88: China Ink Market Value (US$ Mn) Forecast, by Type 2020–2031
Table 89: China Ink Market Volume (Kilo Tons) Forecast, by Formulating Technology, 2020–2031
Table 90: China Ink Market Value (US$ Mn) Forecast, by Formulating Technology, 2020–2031
Table 91: China Ink Market Volume (Kilo Tons) Forecast, by Application, 2020–2031
Table 92: China Ink Market Value (US$ Mn) Forecast, by Application, 2020–2031
Table 93: Japan Ink Market Volume (Kilo Tons) Forecast, by Type, 2020–2031
Table 94: Japan Ink Market Value (US$ Mn) Forecast, by Type, 2020–2031
Table 95: Japan Ink Market Volume (Kilo Tons) Forecast, by Formulating Technology, 2020–2031
Table 96: Japan Ink Market Value (US$ Mn) Forecast, by Formulating Technology, 2020–2031
Table 97: Japan Ink Market Volume (Kilo Tons) Forecast, by Application, 2020–2031
Table 98: Japan Ink Market Value (US$ Mn) Forecast, by Application, 2020–2031
Table 99: India Ink Market Volume (Kilo Tons) Forecast, by Type, 2020–2031
Table 100: India Ink Market Value (US$ Mn) Forecast, by Type, 2020–2031
Table 101: India Ink Market Volume (Kilo Tons) Forecast, by Formulating Technology, 2020–2031
Table 102: India Ink Market Value (US$ Mn) Forecast, by Formulating Technology, 2020–2031
Table 103: India Ink Market Volume (Kilo Tons) Forecast, by Application, 2020–2031
Table 104: India Ink Market Value (US$ Mn) Forecast, by Application, 2020–2031
Table 105: India Ink Market Volume (Kilo Tons) Forecast, by Application, 2020–2031
Table 106: India Ink Market Value (US$ Mn) Forecast, by Application 2020–2031
Table 107: ASEAN Ink Market Volume (Kilo Tons) Forecast, by Type, 2020–2031
Table 108: ASEAN Ink Market Value (US$ Mn) Forecast, by Type, 2020–2031
Table 109: ASEAN Ink Market Volume (Kilo Tons) Forecast, by Formulating Technology, 2020–2031
Table 110: ASEAN Ink Market Value (US$ Mn) Forecast, by Formulating Technology, 2020–2031
Table 111: ASEAN Ink Market Volume (Kilo Tons) Forecast, by Application, 2020–2031
Table 112: ASEAN Ink Market Value (US$ Mn) Forecast, by Application, 2020–2031
Table 113: Rest of Asia Pacific Ink Market Volume (Kilo Tons) Forecast, by Type, 2020–2031
Table 114: Rest of Asia Pacific Ink Market Value (US$ Mn) Forecast, by Type, 2020–2031
Table 115: Rest of Asia Pacific Ink Market Volume (Kilo Tons) Forecast, by Formulating Technology, 2020–2031
Table 116: Rest of Asia Pacific Ink Market Value (US$ Mn) Forecast, by Formulating Technology, 2020–2031
Table 117: Rest of Asia Pacific Ink Market Volume (Kilo Tons) Forecast, by Application, 2020–2031
Table 118: Rest of Asia Pacific Ink Market Value (US$ Mn) Forecast, by Application, 2020–2031
Table 119: Latin America Ink Market Volume (Kilo Tons) Forecast, by Type, 2020–2031
Table 120: Latin America Ink Market Value (US$ Mn) Forecast, by Type, 2020–2031
Table 121: Latin America Ink Market Volume (Kilo Tons) Forecast, by Formulating Technology, 2020–2031
Table 122: Latin America Ink Market Value (US$ Mn) Forecast, by Formulating Technology, 2020–2031
Table 123: Latin America Ink Market Volume (Kilo Tons) Forecast, by Application, 2020–2031
Table 124: Latin America Ink Market Value (US$ Mn) Forecast, by Application, 2020–2031
Table 125: Latin America Ink Market Volume (Kilo Tons) Forecast, by Country and Sub-region, 2020–2031
Table 126: Latin America Ink Market Value (US$ Mn) Forecast, by Country and Sub-region, 2020–2031
Table 127: Brazil Ink Market Volume (Kilo Tons) Forecast, by Type, 2020–2031
Table 128: Brazil Ink Market Value (US$ Mn) Forecast, by Type, 2020–2031
Table 129: Brazil Ink Market Volume (Kilo Tons) Forecast, by Formulating Technology, 2020–2031
Table 130: Brazil Ink Market Value (US$ Mn) Forecast, by Formulating Technology, 2020–2031
Table 131: Brazil Ink Market Volume (Kilo Tons) Forecast, by Application, 2020–2031
Table 132: Brazil Ink Market Value (US$ Mn) Forecast, by Application, 2020–2031
Table 133: Mexico Ink Market Volume (Kilo Tons) Forecast, by Type, 2020–2031
Table 134: Mexico Ink Market Value (US$ Mn) Forecast, by Type, 2020–2031
Table 135: Mexico Ink Market Volume (Kilo Tons) Forecast, by Formulating Technology, 2020–2031
Table 136: Mexico Ink Market Value (US$ Mn) Forecast, by Formulating Technology, 2020–2031
Table 137: Mexico Ink Market Volume (Kilo Tons) Forecast, by Application, 2020–2031
Table 138: Mexico Ink Market Value (US$ Mn) Forecast, by Application, 2020–2031
Table 139: Rest of Latin America Ink Market Volume (Kilo Tons) Forecast, by Type, 2020–2031
Table 140: Rest of Latin America Ink Market Value (US$ Mn) Forecast, by Type, 2020–2031
Table 141: Rest of Latin America Ink Market Volume (Kilo Tons) Forecast, by Formulating Technology, 2020–2031
Table 142: Rest of Latin America Ink Market Value (US$ Mn) Forecast, by Formulating Technology, 2020–2031
Table 143: Rest of Latin America Ink Market Volume (Kilo Tons) Forecast, by Application, 2020–2031
Table 144: Rest of Latin America Ink Market Value (US$ Mn) Forecast, by Application, 2020–2031
Table 145: Middle East & Africa Ink Market Volume (Kilo Tons) Forecast, by Type, 2020–2031
Table 146: Middle East & Africa Ink Market Value (US$ Mn) Forecast, by Type, 2020–2031
Table 147: Middle East & Africa Ink Market Volume (Kilo Tons) Forecast, by Formulating Technology, 2020–2031
Table 148: Middle East & Africa Ink Market Value (US$ Mn) Forecast, by Formulating Technology, 2020–2031
Table 149: Middle East & Africa Ink Market Volume (Kilo Tons) Forecast, by Application, 2020–2031
Table 150: Middle East & Africa Ink Market Value (US$ Mn) Forecast, by Application, 2020–2031
Table 151: Middle East & Africa Ink Market Volume (Kilo Tons) Forecast, by Country and Sub-region, 2020–2031
Table 152: Middle East & Africa Ink Market Value (US$ Mn) Forecast, by Country and Sub-region, 2020–2031
Table 153: GCC Ink Market Volume (Kilo Tons) Forecast, by Type, 2020–2031
Table 154: GCC Ink Market Value (US$ Mn) Forecast, by Type, 2020–2031
Table 155: GCC Ink Market Volume (Kilo Tons) Forecast, by Formulating Technology, 2020–2031
Table 156: GCC Ink Market Value (US$ Mn) Forecast, by Formulating Technology, 2020–2031
Table 157: GCC Ink Market Volume (Kilo Tons) Forecast, by Application, 2020–2031
Table 158: GCC Ink Market Value (US$ Mn) Forecast, by Application, 2020–2031
Table 159: South Africa Ink Market Volume (Kilo Tons) Forecast, by Type, 2020–2031
Table 160: South Africa Ink Market Value (US$ Mn) Forecast, by Type, 2020–2031
Table 161: South Africa Ink Market Volume (Kilo Tons) Forecast, by Formulating Technology, 2020–2031
Table 162: South Africa Ink Market Value (US$ Mn) Forecast, by Formulating Technology, 2020–2031
Table 163: South Africa Ink Market Volume (Kilo Tons) Forecast, by Application, 2020–2031
Table 164: South Africa Ink Market Value (US$ Mn) Forecast, by Application, 2020–2031
Table 165: Rest of Middle East & Africa Ink Market Volume (Kilo Tons) Forecast, by Type, 2020–2031
Table 166: Rest of Middle East & Africa Ink Market Value (US$ Mn) Forecast, by Type, 2020–2031
Table 167: Rest of Middle East & Africa Ink Market Volume (Kilo Tons) Forecast, by Formulating Technology, 2020–2031
Table 168: Rest of Middle East & Africa Ink Market Value (US$ Mn) Forecast, by Formulating Technology, 2020–2031
Table 169: Rest of Middle East & Africa Ink Market Volume (Kilo Tons) Forecast, by Application, 2020–2031
Table 170: Rest of Middle East & Africa Ink Market Value (US$ Mn) Forecast, by Application, 2020–2031
List of Figures
Figure 1: Global Ink Market Volume Share Analysis, by Type, 2021, 2025, and 2031
Figure 2: Global Ink Market Attractiveness, by Type
Figure 3: Global Ink Market Volume Share Analysis, by Formulating Technology, 2021, 2025, and 2031
Figure 4: Global Ink Market Attractiveness, by Formulating Technology
Figure 5: Global Ink Market Volume Share Analysis, by Application, 2021, 2025, and 2031
Figure 6: Global Ink Market Attractiveness, by Application
Figure 7: Global Ink Market Volume Share Analysis, by Region, 2021, 2025, and 2031
Figure 8: Global Ink Market Attractiveness, by Region
Figure 9: North America Ink Market Volume Share Analysis, by Type, 2021, 2025, and 2031
Figure 10: North America Ink Market Attractiveness, by Type
Figure 11: North America Ink Market Attractiveness, by Type
Figure 12: North America Ink Market Volume Share Analysis, by Formulating Technology, 2021, 2025, and 2031
Figure 13: North America Ink Market Attractiveness, by Formulating Technology
Figure 14: North America Ink Market Volume Share Analysis, by Application, 2021, 2025, and 2031
Figure 15: North America Ink Market Attractiveness, by Application
Figure 16: North America Ink Market Attractiveness, by Country
Figure 17: Europe Ink Market Volume Share Analysis, by Type, 2021, 2025, and 2031
Figure 18: Europe Ink Market Attractiveness, by Type
Figure 19: Europe Ink Market Volume Share Analysis, by Formulating Technology, 2021, 2025, and 2031
Figure 20: Europe Ink Market Attractiveness, by Formulating Technology
Figure 21: Europe Ink Market Volume Share Analysis, by Application, 2021, 2025, and 2031
Figure 22: Europe Ink Market Attractiveness, by Application
Figure 23: Europe Ink Market Volume Share Analysis, by Country and Sub-region, 2021, 2025, and 2031
Figure 24: Europe Ink Market Attractiveness, by Country and Sub-region
Figure 25: Asia Pacific Ink Market Volume Share Analysis, by Type, 2021, 2025, and 2031
Figure 26: Asia Pacific Ink Market Attractiveness, by Type
Figure 27: Asia Pacific Ink Market Volume Share Analysis, by Formulating Technology, 2021, 2025, and 2031
Figure 28: Asia Pacific Ink Market Attractiveness, by Formulating Technology
Figure 29: Asia Pacific Ink Market Volume Share Analysis, by Application, 2021, 2025, and 2031
Figure 30: Asia Pacific Ink Market Attractiveness, by Application
Figure 31: Asia Pacific Ink Market Volume Share Analysis, by Country and Sub-region, 2021, 2025, and 2031
Figure 32: Asia Pacific Ink Market Attractiveness, by Country and Sub-region
Figure 33: Latin America Ink Market Volume Share Analysis, by Type, 2021, 2025, and 2031
Figure 34: Latin America Ink Market Attractiveness, by Type
Figure 35: Latin America Ink Market Volume Share Analysis, by Formulating Technology, 2021, 2025, and 2031
Figure 36: Latin America Ink Market Attractiveness, by Formulating Technology
Figure 37: Latin America Ink Market Volume Share Analysis, by Application, 2021, 2025, and 2031
Figure 38: Latin America Ink Market Attractiveness, by Application
Figure 39: Latin America Ink Market Volume Share Analysis, by Country and Sub-region, 2021, 2025, and 2031
Figure 40: Latin America Ink Market Attractiveness, by Country and Sub-region
Figure 41: Middle East & Africa Ink Market Volume Share Analysis, by Type, 2021, 2025, and 2031
Figure 42: Middle East & Africa Ink Market Attractiveness, by Type
Figure 43: Middle East & Africa Ink Market Volume Share Analysis, by Formulating Technology, 2021, 2025, and 2031
Figure 44: Middle East & Africa Ink Market Attractiveness, by Formulating Technology
Figure 45: Middle East & Africa Ink Market Volume Share Analysis, by Application, 2021, 2025, and 2031
Figure 46: Middle East & Africa Ink Market Attractiveness, by Application
Figure 47: Middle East & Africa Ink Market Volume Share Analysis, by Country and Sub-region, 2021, 2025, and 2031
Figure 48: Middle East & Africa Ink Market Attractiveness, by Country and Sub-region
Copyright © Transparency Market Research, Inc. All Rights reserved
Trust Online

Ink Market