
Reports
Reports
Analysts’ Viewpoint on Inductor Market Scenario
Inductor is a passive component that is used in most power electronic circuits to store energy in the form of magnetic energy when electricity is applied to it. One of the key properties of an inductor is that it impedes or opposes any change in the amount of current flowing through it. Increase in demand for smartphones, tablets, laptops, and other consumer electronic devices in Asia Pacific and North America is a major factor driving the market. Several major manufacturers in Asia Pacific are increasing their R&D investments for miniaturized design of inductors, which in turn is fueling the market in the region. The region is emerging as the manufacturing hub for several applications in consumer electronics and automotive industries, thus the region is expected to dominate the global inductor market during forecast period. Strong demand for inductors from consumer electronics devices and electric vehicles in developing countries, such as India, propels the market. Presently, the global inductor market is fragmented between several large and local vendors who have presence across different regions. Most players are engaged in the development of small-sized inductors to penetrate the growing market. Market consolidation (mergers & acquisition) and a rise in investment in the market are expected to increase during the forecast period, with limited large players having strong hold on the market by 2031.
|
Attribute |
Detail |
|
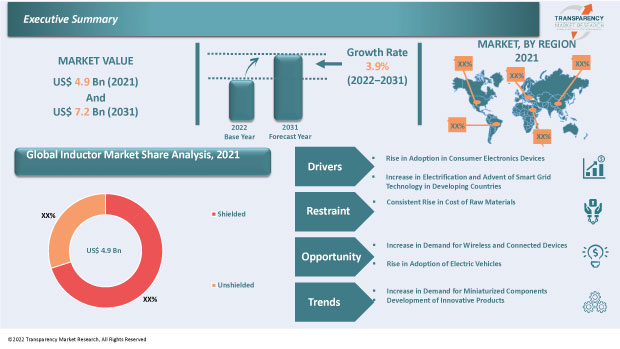
Market Size Value in 2021 |
US$ 4.9 Bn |
|
Market Forecast Value in 2031 |
US$ 7.2 Bn |
|
Growth Rate (CAGR) |
3.9% |
|
Forecast Period |
2022–2031 |
|
Historical Data Available for |
2017–2020 |
|
Quantitative Units |
US$ Bn for Value & Million Units for Volume |
|
Market Analysis |
It includes cross segment analysis at global as well as regional level. Furthermore, qualitative analysis includes drivers, restraints, opportunities, key trends, Porter’s Five Forces analysis, value chain analysis, and key trend analysis. |
|
Competition Landscape |
|
|
Format |
Electronic (PDF) + Excel |
|
Market Segmentation |
|
|
Regions Covered |
|
|
Countries Covered |
|
|
Companies Profiled |
|
|
Customization Scope |
Available upon request |
|
Pricing |
Available upon request |
The inductor market stood at US$ 4.9 Bn in 2021
The inductor market is expected to grow at a CAGR of 3.9% by 2031
The inductor market is estimated to reach US$ 7.2 Bn in 2031
ABC Taiwan Electronics Corporation, API Delevan, Inc., Bourns, Inc., Chilisin Electronics Corp., Coilcraft, Inc., Delta Electronics, Inc., ICE Components, Inc., KYOCERA AVX Components Corporation, Murata Manufacturing Co., Ltd., Pulse Electronics Corporation, Shenzhen Sunlord Electronics Co., Ltd., Sumida Corporation, Taiyo Yuden Co., Ltd., TDK Corporation, Vishay Intertechnology Inc., Inpaq Technology Co., Ltd., Mag.Layers International Co.,Ltd., Prosperity Dielectrics Co. Ltd., Tai-Tech Advanc
The U.S. accounted for 22.54% share of the global inductor market in 2021
The surface mount inductor segment is expected to hold 65.21% of share of the global inductor market
Rise in demand for miniaturized components and development of innovative products
Asia Pacific is more lucrative region of the global inductor market
1. Preface
1.1. Market Introduction
1.2. Market and Segments Definition
1.3. Market Taxonomy
1.4. Research Methodology
1.5. Assumption and Acronyms
2. Executive Summary
2.1. Global Inductor Market Overview
2.2. Regional Outline
2.3. Industry Outline
2.4. Market Dynamics Snapshot
2.5. Competition Blueprint
3. Market Dynamics
3.1. Macro-economic Factors
3.2. Drivers
3.3. Restraints
3.4. Opportunities
3.5. Key Trends
3.6. Regulatory Framework
4. Associated Industry and Key Indicator Assessment
4.1. Parent Industry Overview – Global Passive Electronics Component Industry Overview
4.2. Supply Chain Analysis
4.3. Pricing Analysis
4.4. Technology Roadmap Analysis
4.5. Industry SWOT Analysis
4.6. Porter Five Forces Analysis
4.7. Covid-19 Impact and Recovery Analysis
5. Global Inductor Market Analysis, by Inductance
5.1. Inductor Market Size (US$ Bn) and Volume (Million Units) Analysis & Forecast, by Inductance, 2017–2031
5.1.1. Fixed Inductors
5.1.2. Variable Inductors
5.2. Market Attractiveness Analysis, by Inductance
6. Global Inductor Market Analysis, by Type
6.1. Inductor Market Size (US$ Bn) and Volume (Million Units) Analysis & Forecast, by Type, 2017–2031
6.1.1. Film Type
6.1.2. Multilayered
6.1.3. Wire Wound
6.1.4. Bobbin
6.1.5. Toroidal
6.1.6. Molded
6.1.7. Other
6.2. Market Attractiveness Analysis, by Type
7. Global Inductor Market Analysis, by Core Type
7.1. Inductor Market Size (US$ Bn) and Volume (Million Units) Analysis & Forecast, by Core Type, 2017–2031
7.1.1. Air Core
7.1.2. Ceramic Core
7.1.3. Ferrite Core
7.1.4. Iron Core
7.1.5. Other
7.2. Market Attractiveness Analysis, by Core Type
8. Global Inductor Market Analysis, by Shield Type
8.1. Inductor Market Size (US$ Bn) Analysis & Forecast, by Shield Type, 2017–2031
8.1.1. Shielded
8.1.2. Unshielded
8.2. Market Attractiveness Analysis, by Shield Type
9. Global Inductor Market Analysis, by Mounting
9.1. Inductor Market Size (US$ Bn) Analysis & Forecast, by Mounting, 2017–2031
9.1.1. Surface Mount
9.1.2. Through Hole
9.2. Market Attractiveness Analysis, by Mounting
10. Global Inductor Market Analysis, by Application
10.1. Inductor Market Size (US$ Bn) Analysis & Forecast, by Application, 2017–2031
10.1.1. Tuning Circuit
10.1.2. Energy Storage Devices
10.1.3. Induction Motors
10.1.4. Transformers
10.1.5. Power Supply
10.1.6. Others
10.2. Market Attractiveness Analysis, by Application
11. Global Inductor Market Analysis, by End-use Industry
11.1. Inductor Market Size (US$ Bn) Analysis & Forecast, by End-use Industry, 2017–2031
11.1.1. Automotive and Transportation
11.1.2. Industrial
11.1.3. Aerospace and Defense
11.1.4. Electronics and Semiconductor
11.1.5. Energy and Utility
11.1.6. Healthcare
11.1.7. Others
11.2. Market Attractiveness Analysis, by End-use Industry
12. Global Inductor Market Analysis and Forecast, by Region
12.1. Inductor Market Size (US$ Bn) and Volume (Million Units) Analysis & Forecast, by Region, 2017–2031
12.1.1. North America
12.1.2. Europe
12.1.3. Asia Pacific
12.1.4. Middle East & Africa
12.1.5. South America
12.2. Market Attractiveness Analysis, by Region
13. North America Inductor Market Analysis and Forecast
13.1. Market Snapshot
13.2. Drivers and Restraints: Impact Analysis
13.3. Inductor Market Size (US$ Bn) and Volume (Million Units) Analysis & Forecast, by Inductance, 2017–2031
13.3.1. Fixed Inductors
13.3.2. Variable Inductors
13.4. Inductor Market Size (US$ Bn) and Volume (Million Units) Analysis & Forecast, by Type, 2017–2031
13.4.1. Film Type
13.4.2. Multilayered
13.4.3. Wire Wound
13.4.4. Bobbin
13.4.5. Toroidal
13.4.6. Molded
13.4.7. Other
13.5. Inductor Market Size (US$ Bn) and Volume (Million Units) Analysis & Forecast, by Core Type, 2017–2031
13.5.1. Air Core
13.5.2. Ceramic Core
13.5.3. Ferrite Core
13.5.4. Iron Core
13.5.5. Other
13.6. Inductor Market Size (US$ Bn) Analysis & Forecast, by Shield Type, 2017–2031
13.6.1. Shielded
13.6.2. Unshielded
13.7. Inductor Market Size (US$ Bn) Analysis & Forecast, by Mounting, 2017–2031
13.7.1. Surface Mount
13.7.2. Through Hole
13.8. Inductor Market Size (US$ Bn) Analysis & Forecast, by Application, 2017–2031
13.8.1. Tuning Circuit
13.8.2. Energy Storage Devices
13.8.3. Induction Motors
13.8.4. Transformers
13.8.5. Power Supply
13.8.6. Others
13.9. Inductor Market Size (US$ Bn) Analysis & Forecast, by End-use Industry, 2017–2031
13.9.1. Automotive and Transportation
13.9.2. Industrial
13.9.3. Aerospace and Defense
13.9.4. Electronics and Semiconductor
13.9.5. Energy and Utility
13.9.6. Healthcare
13.9.7. Others
13.10. Inductor Market Size (US$ Bn) and Volume (Million Units) Analysis & Forecast, by Country and Sub-region, 2017–2031
13.10.1. U.S.
13.10.2. Canada
13.10.3. Rest of North America
13.11. Market Attractiveness Analysis
13.11.1. By Inductance
13.11.2. By Type
13.11.3. By Core Type
13.11.4. By Shield Type
13.11.5. By Mounting
13.11.6. By Application
13.11.7. By End-use Industry
13.11.8. By Country and Sub-region
14. Europe Inductor Market Analysis and Forecast
14.1. Market Snapshot
14.2. Drivers and Restraints: Impact Analysis
14.3. Inductor Market Size (US$ Bn) and Volume (Million Units) Analysis & Forecast, by Inductance, 2017–2031
14.3.1. Fixed Inductors
14.3.2. Variable Inductors
14.4. Inductor Market Size (US$ Bn) and Volume (Million Units) Analysis & Forecast, by Type, 2017–2031
14.4.1. Film Type
14.4.2. Multilayered
14.4.3. Wire Wound
14.4.4. Bobbin
14.4.5. Toroidal
14.4.6. Molded
14.4.7. Other
14.5. Inductor Market Size (US$ Bn) and Volume (Million Units) Analysis & Forecast, by Core Type, 2017–2031
14.5.1. Air Core
14.5.2. Ceramic Core
14.5.3. Ferrite Core
14.5.4. Iron Core
14.5.5. Other
14.6. Inductor Market Size (US$ Bn) Analysis & Forecast, by Shield Type, 2017–2031
14.6.1. Shielded
14.6.2. Unshielded
14.7. Inductor Market Size (US$ Bn) Analysis & Forecast, by Mounting, 2017–2031
14.7.1. Surface Mount
14.7.2. Through Hole
14.8. Inductor Market Size (US$ Bn) Analysis & Forecast, by Application, 2017–2031
14.8.1. Tuning Circuit
14.8.2. Energy Storage Devices
14.8.3. Induction Motors
14.8.4. Transformers
14.8.5. Power Supply
14.8.6. Others
14.9. Inductor Market Size (US$ Bn) Analysis & Forecast, by End-use Industry, 2017–2031
14.9.1. Automotive and Transportation
14.9.2. Industrial
14.9.3. Aerospace and Defense
14.9.4. Electronics and Semiconductor
14.9.5. Energy and Utility
14.9.6. Healthcare
14.9.7. Others
14.10. Inductor Market Size (US$ Bn) and Volume (Million Units) Analysis & Forecast, by Country and Sub-region, 2017–2031
14.10.1. U.K.
14.10.2. Germany
14.10.3. France
14.10.4. Rest of Europe
14.11. Market Attractiveness Analysis
14.11.1. By Inductance
14.11.2. By Type
14.11.3. By Core Type
14.11.4. By Shield Type
14.11.5. By Mounting
14.11.6. By Application
14.11.7. By End-use Industry
14.11.8. By Country and Sub-region
15. Asia Pacific Inductor Market Analysis and Forecast
15.1. Market Snapshot
15.2. Drivers and Restraints: Impact Analysis
15.3. Inductor Market Size (US$ Bn) and Volume (Million Units) Analysis & Forecast, by Inductance, 2017–2031
15.3.1. Fixed Inductors
15.3.2. Variable Inductors
15.4. Inductor Market Size (US$ Bn) and Volume (Million Units) Analysis & Forecast, by Type, 2017–2031
15.4.1. Film Type
15.4.2. Multilayered
15.4.3. Wire Wound
15.4.4. Bobbin
15.4.5. Toroidal
15.4.6. Molded
15.4.7. Other
15.5. Inductor Market Size (US$ Bn) and Volume (Million Units) Analysis & Forecast, by Core Type, 2017–2031
15.5.1. Air Core
15.5.2. Ceramic Core
15.5.3. Ferrite Core
15.5.4. Iron Core
15.5.5. Other
15.6. Inductor Market Size (US$ Bn) Analysis & Forecast, by Shield Type, 2017–2031
15.6.1. Shielded
15.6.2. Unshielded
15.7. Inductor Market Size (US$ Bn) Analysis & Forecast, by Mounting, 2017–2031
15.7.1. Surface Mount
15.7.2. Through Hole
15.8. Inductor Market Size (US$ Bn) Analysis & Forecast, by Application, 2017–2031
15.8.1. Tuning Circuit
15.8.2. Energy Storage Devices
15.8.3. Induction Motors
15.8.4. Transformers
15.8.5. Power Supply
15.8.6. Others
15.9. Inductor Market Size (US$ Bn) Analysis & Forecast, by End-use Industry, 2017–2031
15.9.1. Automotive and Transportation
15.9.2. Industrial
15.9.3. Aerospace and Defense
15.9.4. Electronics and Semiconductor
15.9.5. Energy and Utility
15.9.6. Healthcare
15.9.7. Others
15.10. Inductor Market Size (US$ Bn) and Volume (Million Units) Analysis & Forecast, by Country and Sub-region, 2017–2031
15.10.1. China
15.10.2. Japan
15.10.3. India
15.10.4. South Korea
15.10.5. ASEAN
15.10.6. Rest of Asia Pacific
15.11. Market Attractiveness Analysis
15.11.1. By Inductance
15.11.2. By Type
15.11.3. By Core Type
15.11.4. By Shield Type
15.11.5. By Mounting
15.11.6. By Application
15.11.7. By End-use Industry
15.11.8. By Country and Sub-region
16. Middle East & Africa Inductor Market Analysis and Forecast
16.1. Market Snapshot
16.2. Drivers and Restraints: Impact Analysis
16.3. Inductor Market Size (US$ Bn) and Volume (Million Units) Analysis & Forecast, by Inductance, 2017–2031
16.3.1. Fixed Inductors
16.3.2. Variable Inductors
16.4. Inductor Market Size (US$ Bn) and Volume (Million Units) Analysis & Forecast, by Type, 2017–2031
16.4.1. Film Type
16.4.2. Multilayered
16.4.3. Wire Wound
16.4.4. Bobbin
16.4.5. Toroidal
16.4.6. Molded
16.4.7. Other
16.5. Inductor Market Size (US$ Bn) and Volume (Million Units) Analysis & Forecast, by Core Type, 2017–2031
16.5.1. Air Core
16.5.2. Ceramic Core
16.5.3. Ferrite Core
16.5.4. Iron Core
16.5.5. Other
16.6. Inductor Market Size (US$ Bn) Analysis & Forecast, by Shield Type, 2017–2031
16.6.1. Shielded
16.6.2. Unshielded
16.7. Inductor Market Size (US$ Bn) Analysis & Forecast, by Mounting, 2017–2031
16.7.1. Surface Mount
16.7.2. Through Hole
16.8. Inductor Market Size (US$ Bn) Analysis & Forecast, by Application, 2017–2031
16.8.1. Tuning Circuit
16.8.2. Energy Storage Devices
16.8.3. Induction Motors
16.8.4. Transformers
16.8.5. Power Supply
16.8.6. Others
16.9. Inductor Market Size (US$ Bn) Analysis & Forecast, by End-use Industry, 2017–2031
16.9.1. Automotive and Transportation
16.9.2. Industrial
16.9.3. Aerospace and Defense
16.9.4. Electronics and Semiconductor
16.9.5. Energy and Utility
16.9.6. Healthcare
16.9.7. Others
16.10. Inductor Market Size (US$ Bn) and Volume (Million Units) Analysis & Forecast, by Country and Sub-region, 2017–2031
16.10.1. GCC
16.10.2. South Africa
16.10.3. Rest of Middle East & Africa
16.11. Market Attractiveness Analysis
16.11.1. By Inductance
16.11.2. By Type
16.11.3. By Core Type
16.11.4. By Shield Type
16.11.5. By Mounting
16.11.6. By Application
16.11.7. By End-use Industry
16.11.8. By Country and Sub-region
17. South America Inductor Market Analysis and Forecast
17.1. Market Snapshot
17.2. Drivers and Restraints: Impact Analysis
17.3. Inductor Market Size (US$ Bn) and Volume (Million Units) Analysis & Forecast, by Inductance, 2017–2031
17.3.1. Fixed Inductors
17.3.2. Variable Inductors
17.4. Inductor Market Size (US$ Bn) and Volume (Million Units) Analysis & Forecast, by Type, 2017–2031
17.4.1. Film Type
17.4.2. Multilayered
17.4.3. Wire Wound
17.4.4. Bobbin
17.4.5. Toroidal
17.4.6. Molded
17.4.7. Other
17.5. Inductor Market Size (US$ Bn) and Volume (Million Units) Analysis & Forecast, by Core Type, 2017–2031
17.5.1. Air Core
17.5.2. Ceramic Core
17.5.3. Ferrite Core
17.5.4. Iron Core
17.5.5. Other
17.6. Inductor Market Size (US$ Bn) Analysis & Forecast, by Shield Type, 2017–2031
17.6.1. Shielded
17.6.2. Unshielded
17.7. Inductor Market Size (US$ Bn) Analysis & Forecast, by Mounting, 2017–2031
17.7.1. Surface Mount
17.7.2. Through Hole
17.8. Inductor Market Size (US$ Bn) Analysis & Forecast, by Application, 2017–2031
17.8.1. Tuning Circuit
17.8.2. Energy Storage Devices
17.8.3. Induction Motors
17.8.4. Transformers
17.8.5. Power Supply
17.8.6. Others
17.9. Inductor Market Size (US$ Bn) Analysis & Forecast, by End-use Industry, 2017–2031
17.9.1. Automotive and Transportation
17.9.2. Industrial
17.9.3. Aerospace and Defense
17.9.4. Electronics and Semiconductor
17.9.5. Energy and Utility
17.9.6. Healthcare
17.9.7. Others
17.10. Inductor Market Size (US$ Bn) and Volume (Million Units) Analysis & Forecast, by Country and Sub-region, 2017–2031
17.10.1. Brazil
17.10.2. Rest of South America
17.11. Market Attractiveness Analysis
17.11.1. By Inductance
17.11.2. By Type
17.11.3. By Core Type
17.11.4. By Shield Type
17.11.5. By Mounting
17.11.6. By Application
17.11.7. By End-use Industry
17.11.8. By Country and Sub-region
18. Competition Assessment
18.1. Global Inductor Market Competition Matrix - a Dashboard View
18.1.1. Global Inductor Market Company Share Analysis, by Value (2021)
18.1.2. Technological Differentiator
19. Company Profiles (Global Manufacturers/Suppliers)
19.1. ABC Taiwan Electronics Corporation
19.1.1. Overview
19.1.2. Product Portfolio
19.1.3. Sales Footprint
19.1.4. Key Subsidiaries or Distributors
19.1.5. Strategy and Recent Developments
19.1.6. Key Financials
19.2. API Delevan, Inc.
19.2.1. Overview
19.2.2. Product Portfolio
19.2.3. Sales Footprint
19.2.4. Key Subsidiaries or Distributors
19.2.5. Strategy and Recent Developments
19.2.6. Key Financials
19.3. Bourns, Inc.
19.3.1. Overview
19.3.2. Product Portfolio
19.3.3. Sales Footprint
19.3.4. Key Subsidiaries or Distributors
19.3.5. Strategy and Recent Developments
19.3.6. Key Financials
19.4. Chilisin Electronics Corp
19.4.1. Overview
19.4.2. Product Portfolio
19.4.3. Sales Footprint
19.4.4. Key Subsidiaries or Distributors
19.4.5. Strategy and Recent Developments
19.4.6. Key Financials
19.5. Coilcraft, Inc.
19.5.1. Overview
19.5.2. Product Portfolio
19.5.3. Sales Footprint
19.5.4. Key Subsidiaries or Distributors
19.5.5. Strategy and Recent Developments
19.5.6. Key Financials
19.6. Delta Electronics, Inc.
19.6.1. Overview
19.6.2. Product Portfolio
19.6.3. Sales Footprint
19.6.4. Key Subsidiaries or Distributors
19.6.5. Strategy and Recent Developments
19.6.6. Key Financials
19.7. ICE Components, Inc.
19.7.1. Overview
19.7.2. Product Portfolio
19.7.3. Sales Footprint
19.7.4. Key Subsidiaries or Distributors
19.7.5. Strategy and Recent Developments
19.7.6. Key Financials
19.8. KYOCERA AVX Components Corporation.
19.8.1. Overview
19.8.2. Product Portfolio
19.8.3. Sales Footprint
19.8.4. Key Subsidiaries or Distributors
19.8.5. Strategy and Recent Developments
19.8.6. Key Financials
19.9. Murata Manufacturing Co., Ltd
19.9.1. Overview
19.9.2. Product Portfolio
19.9.3. Sales Footprint
19.9.4. Key Subsidiaries or Distributors
19.9.5. Strategy and Recent Developments
19.9.6. Key Financials
19.10. Pulse Electronics Corporation
19.10.1. Overview
19.10.2. Product Portfolio
19.10.3. Sales Footprint
19.10.4. Key Subsidiaries or Distributors
19.10.5. Strategy and Recent Developments
19.10.6. Key Financials
19.11. Shenzhen Sunlord Electronics Co., Ltd.
19.11.1. Overview
19.11.2. Product Portfolio
19.11.3. Sales Footprint
19.11.4. Key Subsidiaries or Distributors
19.11.5. Strategy and Recent Developments
19.11.6. Key Financials
19.12. Sumida Corporation
19.12.1. Overview
19.12.2. Product Portfolio
19.12.3. Sales Footprint
19.12.4. Key Subsidiaries or Distributors
19.12.5. Strategy and Recent Developments
19.12.6. Key Financials
19.13. Taiyo Yuden Co., Ltd
19.13.1. Overview
19.13.2. Product Portfolio
19.13.3. Sales Footprint
19.13.4. Key Subsidiaries or Distributors
19.13.5. Strategy and Recent Developments
19.13.6. Key Financials
19.14. TDK Corporation
19.14.1. Overview
19.14.2. Product Portfolio
19.14.3. Sales Footprint
19.14.4. Key Subsidiaries or Distributors
19.14.5. Strategy and Recent Developments
19.14.6. Key Financials
19.15. Vishay Intertechnology Inc.
19.15.1. Overview
19.15.2. Product Portfolio
19.15.3. Sales Footprint
19.15.4. Key Subsidiaries or Distributors
19.15.5. Strategy and Recent Developments
19.15.6. Key Financials
19.16. Inpaq Technology Co., Ltd.
19.16.1. Overview
19.16.2. Product Portfolio
19.16.3. Sales Footprint
19.16.4. Key Subsidiaries or Distributors
19.16.5. Strategy and Recent Developments
19.16.6. Key Financials
19.17. Mag.Layers International Co.,Ltd.
19.17.1. Overview
19.17.2. Product Portfolio
19.17.3. Sales Footprint
19.17.4. Key Subsidiaries or Distributors
19.17.5. Strategy and Recent Developments
19.17.6. Key Financials
19.18. Prosperity Dielectrics Co. Ltd.
19.18.1. Overview
19.18.2. Product Portfolio
19.18.3. Sales Footprint
19.18.4. Key Subsidiaries or Distributors
19.18.5. Strategy and Recent Developments
19.18.6. Key Financials
19.19. Tai-Tech Advanced Electronics Co
19.19.1. Overview
19.19.2. Product Portfolio
19.19.3. Sales Footprint
19.19.4. Key Subsidiaries or Distributors
19.19.5. Strategy and Recent Developments
19.19.6. Key Financials
19.20. Walsin Technology Corp.
19.20.1. Overview
19.20.2. Product Portfolio
19.20.3. Sales Footprint
19.20.4. Key Subsidiaries or Distributors
19.20.5. Strategy and Recent Developments
19.20.6. Key Financials
19.21. Microgate
19.21.1. Overview
19.21.2. Product Portfolio
19.21.3. Sales Footprint
19.21.4. Key Subsidiaries or Distributors
19.21.5. Strategy and Recent Developments
19.21.6. Key Financials
19.22. Fenghua Hitech
19.22.1. Overview
19.22.2. Product Portfolio
19.22.3. Sales Footprint
19.22.4. Key Subsidiaries or Distributors
19.22.5. Strategy and Recent Developments
19.22.6. Key Financials
19.23. Texas Instruments Incorporated
19.23.1. Overview
19.23.2. Product Portfolio
19.23.3. Sales Footprint
19.23.4. Key Subsidiaries or Distributors
19.23.5. Strategy and Recent Developments
19.23.6. Key Financials
20. Recommendation
20.1. Opportunity Assessment
20.1.1. By Inductance
20.1.2. By Type
20.1.3. By Core Type
20.1.4. By Shield Type
20.1.5. By Mounting
20.1.6. By Application
20.1.7. By End-use Industry
20.1.8. By Region
List of Tables
Table 1: Global Inductor Market Value (US$ Mn) & Forecast, by Inductance, 2017‒2031
Table 2: Global Inductor Market Volume (Million Units) & Forecast, by Inductance, 2017‒2031
Table 3: Global Inductor Market Value (US$ Mn) & Forecast, by Type, 2017‒2031
Table 4: Global Inductor Market Volume (Million Units) & Forecast, by Type, 2017‒2031
Table 5: Global Inductor Market Value (US$ Mn) & Forecast, by Core Type, 2017‒2031
Table 6: Global Inductor Market Volume (Million Units) & Forecast, by Core Type, 2017‒2031
Table 7: Global Inductor Market Value (US$ Mn) & Forecast, by Shield Type, 2017‒2031
Table 8: Global Inductor Market Value (US$ Mn) & Forecast, by Mounting, 2017‒2031
Table 9: Global Inductor Market Value (US$ Mn) & Forecast, by Application, 2017‒2031
Table 10: Global Inductor Market Value (US$ Mn) & Forecast, by End-use Industry, 2017‒2031
Table 11: Global Inductor Market Value (US$ Mn) & Forecast, by Region, 2017‒2031
Table 12: Global Inductor Market Volume (Million Units) & Forecast, by Region, 2017‒2031
Table 13: North America Inductor Market Value (US$ Mn) & Forecast, by Inductance, 2017‒2031
Table 14: North America Inductor Market Volume (Million Units) & Forecast, by Inductance, 2017‒2031
Table 15: North America Inductor Market Value (US$ Mn) & Forecast, by Type, 2017‒2031
Table 16: North America Inductor Market Volume (Million Units) & Forecast, by Type, 2017‒2031
Table 17: North America Inductor Market Value (US$ Mn) & Forecast, by Core Type, 2017‒2031
Table 18: North America Inductor Market Volume (Million Units) & Forecast, by Core Type, 2017‒2031
Table 19: North America Inductor Market Value (US$ Mn) & Forecast, by Shield Type, 2017‒2031
Table 20: North America Inductor Market Value (US$ Mn) & Forecast, by Mounting, 2017‒2031
Table 21: North America Inductor Market Value (US$ Mn) & Forecast, by Application, 2017‒2031
Table 22: North America Inductor Market Value (US$ Mn) & Forecast, by End-use Industry, 2017‒2031
Table 23: North America Inductor Market Value (US$ Mn) & Forecast, by Country and Sub-region, 2017‒2031
Table 24: North America Inductor Market Volume (Million Units) & Forecast, by Country and Sub-region, 2017‒2031
Table 25: Europe Inductor Market Value (US$ Mn) & Forecast, by Inductance, 2017‒2031
Table 26: Europe Inductor Market Volume (Million Units) & Forecast, by Inductance, 2017‒2031
Table 27: Europe Inductor Market Value (US$ Mn) & Forecast, by Type, 2017‒2031
Table 28: Europe Inductor Market Volume (Million Units) & Forecast, by Type, 2017‒2031
Table 29: Europe Inductor Market Value (US$ Mn) & Forecast, by Core Type, 2017‒2031
Table 30: Europe Inductor Market Volume (Million Units) & Forecast, by Core Type, 2017‒2031
Table 31: Europe Inductor Market Value (US$ Mn) & Forecast, by Shield Type, 2017‒2031
Table 32: Europe Inductor Market Value (US$ Mn) & Forecast, by Mounting, 2017‒2031
Table 33: Europe Inductor Market Value (US$ Mn) & Forecast, by Application, 2017‒2031
Table 34: Europe Inductor Market Value (US$ Mn) & Forecast, by End-use Industry, 2017‒2031
Table 35: Europe Inductor Market Value (US$ Mn) & Forecast, by Country and Sub-region, 2017‒2031
Table 36: Europe Inductor Market Volume (Million Units) & Forecast, by Country and Sub-region, 2017‒2031
Table 37: Asia Pacific Inductor Market Value (US$ Mn) & Forecast, by Inductance, 2017‒2031
Table 38: Asia Pacific Inductor Market Volume (Million Units) & Forecast, by Inductance, 2017‒2031
Table 39: Asia Pacific Inductor Market Value (US$ Mn) & Forecast, by Type, 2017‒2031
Table 40: Asia Pacific Inductor Market Volume (Million Units) & Forecast, by Type, 2017‒2031
Table 41: Asia Pacific Inductor Market Value (US$ Mn) & Forecast, by Core Type, 2017‒2031
Table 42: Asia Pacific Inductor Market Volume (Million Units) & Forecast, by Core Type, 2017‒2031
Table 43: Asia Pacific Inductor Market Value (US$ Mn) & Forecast, by Shield Type, 2017‒2031
Table 44: Asia Pacific Inductor Market Value (US$ Mn) & Forecast, by Mounting, 2017‒2031
Table 45: Asia Pacific Inductor Market Value (US$ Mn) & Forecast, by Application, 2017‒2031
Table 46: Asia Pacific Inductor Market Value (US$ Mn) & Forecast, by End-use Industry, 2017‒2031
Table 47: Asia Pacific Inductor Market Value (US$ Mn) & Forecast, by Country and Sub-region, 2017‒2031
Table 48: Asia Pacific Inductor Market Volume (Million Units) & Forecast, by Country and Sub-region, 2017‒2031
Table 49: Middle East & Africa Inductor Market Value (US$ Mn) & Forecast, by Inductance, 2017‒2031
Table 50: Middle East & Africa Inductor Market Volume (Million Units) & Forecast, by Inductance, 2017‒2031
Table 51: Middle East & Africa Inductor Market Value (US$ Mn) & Forecast, by Type, 2017‒2031
Table 52: Middle East & Africa Inductor Market Volume (Million Units) & Forecast, by Type, 2017‒2031
Table 53: Middle East & Africa Inductor Market Value (US$ Mn) & Forecast, by Core Type, 2017‒2031
Table 54: Middle East & Africa Inductor Market Volume (Million Units) & Forecast, by Core Type, 2017‒2031
Table 55: Middle East & Africa Inductor Market Value (US$ Mn) & Forecast, by Shield Type, 2017‒2031
Table 56: Middle East & Africa Inductor Market Value (US$ Mn) & Forecast, by Mounting, 2017‒2031
Table 57: Middle East & Africa Inductor Market Value (US$ Mn) & Forecast, by Application, 2017‒2031
Table 58: Middle East & Africa Inductor Market Value (US$ Mn) & Forecast, by End-use Industry, 2017‒2031
Table 59: Middle East & Africa Inductor Market Value (US$ Mn) & Forecast, by Country and Sub-region, 2017‒2031
Table 60: Middle East & Africa Inductor Market Volume (Million Units) & Forecast, by Country and Sub-region, 2017‒2031
Table 61: South America Inductor Market Value (US$ Mn) & Forecast, by Inductance, 2017‒2031
Table 62: South America Inductor Market Volume (Million Units) & Forecast, by Inductance, 2017‒2031
Table 63: South America Inductor Market Value (US$ Mn) & Forecast, by Type, 2017‒2031
Table 64: South America Inductor Market Volume (Million Units) & Forecast, by Type, 2017‒2031
Table 65: South America Inductor Market Value (US$ Mn) & Forecast, by Core Type, 2017‒2031
Table 66: South America Inductor Market Volume (Million Units) & Forecast, by Core Type, 2017‒2031
Table 67: South America Inductor Market Value (US$ Mn) & Forecast, by Shield Type, 2017‒2031
Table 68: South America Inductor Market Value (US$ Mn) & Forecast, by Mounting, 2017‒2031
Table 69: South America Inductor Market Value (US$ Mn) & Forecast, by Application, 2017‒2031
Table 70: South America Inductor Market Value (US$ Mn) & Forecast, by End-use Industry, 2017‒2031
Table 71: South America Inductor Market Value (US$ Mn) & Forecast, by Country and Sub-region, 2017‒2031
Table 72: South America Inductor Market Volume (Million Units) & Forecast, by Country and Sub-region, 2017‒2031
List of Figures
Figure 01: Global Inductor Price Trend Analysis (Average Price, US$)
Figure 02: Global Inductor Market Size & Forecast, Value (US$ Mn), 2017‒2031
Figure 03: Global Inductor Market Size & Forecast, Volume (Million Units), 2017‒2031
Figure 04: Global Inductor Market Size & Forecast, Y-O-Y, and Value (US$ Mn), 2017‒2031
Figure 05: Global Inductor Market Projections by Inductance, Value (US$ Mn), 2017‒2031
Figure 06: Global Inductor Market Share Analysis, by Inductance, 2022 and 2031
Figure 07: Global Inductor Market, Incremental Opportunity, by Inductance, 2021‒2031
Figure 08: Global Inductor Market Projections by Type, Value (US$ Mn), 2017‒2031
Figure 09: Global Inductor Market Share Analysis, by Type, 2022 and 2031
Figure 10: Global Inductor Market, Incremental Opportunity, by Type, 2021‒2031
Figure 11: Global Inductor Market Projections by Core Type, Value (US$ Mn), 2017‒2031
Figure 12: Global Inductor Market Share Analysis, by Core Type, 2022 and 2031
Figure 13: Global Inductor Market, Incremental Opportunity, by Core Type, 2021‒2031
Figure 14: Global Inductor Market Projections by Shield Type, Value (US$ Mn), 2017‒2031
Figure 15: Global Inductor Market Share Analysis, by Shield Type, 2022 and 2031
Figure 16: Global Inductor Market, Incremental Opportunity, by Shield Type, 2021‒2031
Figure 17: Global Inductor Market Projections by Mounting, Value (US$ Mn), 2017‒2031
Figure 18: Global Inductor Market Share Analysis, by Mounting, 2022 and 2031
Figure 19: Global Inductor Market, Incremental Opportunity, by Mounting, 2021‒2031
Figure 20: Global Inductor Market Projections by End-use Industry, Value (US$ Mn), 2017‒2031
Figure 21: Global Inductor Market Share Analysis, by End-use Industry, 2022 and 2031
Figure 22: Global Inductor Market, Incremental Opportunity, by End-use Industry, 2021‒2031
Figure 23: Global Inductor Market Projections by Region, Value (US$ Mn), 2017‒2031
Figure 24: Global Inductor Market Share Analysis, by Region, 2022 and 2031
Figure 25: Global Inductor Market, Incremental Opportunity, by Region, 2021‒2031
Figure 26: North America Inductor Market Projections by Inductance, Value (US$ Mn), 2017‒2031
Figure 27: North America Inductor Market Share Analysis, by Inductance, 2022 and 2031
Figure 28: North America Inductor Market, Incremental Opportunity, by Inductance, 2021‒2031
Figure 29: North America Inductor Market Projections by Type, Value (US$ Mn), 2017‒2031
Figure 30: North America Inductor Market Share Analysis, by Type, 2022 and 2031
Figure 31: North America Inductor Market, Incremental Opportunity, by Type, 2021‒2031
Figure 32: North America Inductor Market Projections by Core Type, Value (US$ Mn), 2017‒2031
Figure 33: North America Inductor Market Share Analysis, by Core Type, 2022 and 2031
Figure 34: North America Inductor Market, Incremental Opportunity, by Core Type, 2021‒2031
Figure 35: North America Inductor Market Projections by Shield Type, Value (US$ Mn), 2017‒2031
Figure 36: North America Inductor Market Share Analysis, by Shield Type, 2022 and 2031
Figure 37: North America Inductor Market, Incremental Opportunity, by Shield Type, 2021‒2031
Figure 38: North America Inductor Market Projections by Mounting, Value (US$ Mn), 2017‒2031
Figure 39: North America Inductor Market Share Analysis, by Mounting, 2022 and 2031
Figure 40: North America Inductor Market, Incremental Opportunity, by Mounting, 2021‒2031
Figure 41: North America Inductor Market Projections by End-use Industry, Value (US$ Mn), 2017‒2031
Figure 42: North America Inductor Market Share Analysis, by End-use Industry, 2022 and 2031
Figure 43: North America Inductor Market, Incremental Opportunity, by End-use Industry, 2021‒2031
Figure 44: North America Inductor Market Projections by Country and Sub-region, Value (US$ Mn), 2017‒2031
Figure 45: North America Inductor Market Share Analysis, by Country and Sub-region, 2022 and 2031
Figure 46: North America Inductor Market, Incremental Opportunity, by Country and Sub-region, 2021‒2031
Figure 47: Europe Inductor Market Projections by Inductance, Value (US$ Mn), 2017‒2031
Figure 48: Europe Inductor Market Share Analysis, by Inductance, 2022 and 2031
Figure 49: Europe Inductor Market, Incremental Opportunity, by Inductance, 2021‒2031
Figure 50: Europe Inductor Market Projections by Type, Value (US$ Mn), 2017‒2031
Figure 51: Europe Inductor Market Share Analysis, by Type, 2022 and 2031
Figure 52: Europe Inductor Market, Incremental Opportunity, by Type, 2021‒2031
Figure 53: Europe Inductor Market Projections by Core Type, Value (US$ Mn), 2017‒2031
Figure 54: Europe Inductor Market Share Analysis, by Core Type, 2022 and 2031
Figure 55: Europe Inductor Market, Incremental Opportunity, by Core Type, 2021‒2031
Figure 56: Europe Inductor Market Projections by Shield Type, Value (US$ Mn), 2017‒2031
Figure 57: Europe Inductor Market Share Analysis, by Shield Type, 2022 and 2031
Figure 58: Europe Inductor Market, Incremental Opportunity, by Shield Type, 2021‒2031
Figure 59: Europe Inductor Market Projections by Mounting, Value (US$ Mn), 2017‒2031
Figure 60: Europe Inductor Market Share Analysis, by Mounting, 2022 and 2031
Figure 61: Europe Inductor Market, Incremental Opportunity, by Mounting, 2021‒2031
Figure 62: Europe Inductor Market Projections by End-use Industry, Value (US$ Mn), 2017‒2031
Figure 63: Europe Inductor Market Share Analysis, by End-use Industry, 2022 and 2031
Figure 64: Europe Inductor Market, Incremental Opportunity, by End-use Industry, 2021‒2031
Figure 65: Europe Inductor Market Projections by Country and Sub-region, Value (US$ Mn), 2017‒2031
Figure 66: Europe Inductor Market Share Analysis, by Country and Sub-region, 2022 and 2031
Figure 67: Europe Inductor Market, Incremental Opportunity, by Country and Sub-region, 2021‒2031
Figure 68: Asia Pacific Inductor Market Projections by Inductance, Value (US$ Mn), 2017‒2031
Figure 69: Asia Pacific Inductor Market Share Analysis, by Inductance, 2022 and 2031
Figure 70: Asia Pacific Inductor Market, Incremental Opportunity, by Inductance, 2021‒2031
Figure 71: Asia Pacific Inductor Market Projections by Type, Value (US$ Mn), 2017‒2031
Figure 72: Asia Pacific Inductor Market Share Analysis, by Type, 2022 and 2031
Figure 73: Asia Pacific Inductor Market, Incremental Opportunity, by Type, 2021‒2031
Figure 74: Asia Pacific Inductor Market Projections by Core Type, Value (US$ Mn), 2017‒2031
Figure 75: Asia Pacific Inductor Market Share Analysis, by Core Type, 2022 and 2031
Figure 76: Asia Pacific Inductor Market, Incremental Opportunity, by Core Type, 2021‒2031
Figure 77: Asia Pacific Inductor Market Projections by Shield Type, Value (US$ Mn), 2017‒2031
Figure 78: Asia Pacific Inductor Market Share Analysis, by Shield Type, 2022 and 2031
Figure 79: Asia Pacific Inductor Market, Incremental Opportunity, by Shield Type, 2021‒2031
Figure 80: Asia Pacific Inductor Market Projections by Mounting, Value (US$ Mn), 2017‒2031
Figure 81: Asia Pacific Inductor Market Share Analysis, by Mounting, 2022 and 2031
Figure 82: Asia Pacific Inductor Market, Incremental Opportunity, by Mounting, 2021‒2031
Figure 83: Asia Pacific Inductor Market Projections by End-use Industry, Value (US$ Mn), 2017‒2031
Figure 84: Asia Pacific Inductor Market Share Analysis, by End-use Industry, 2022 and 2031
Figure 85: Asia Pacific Inductor Market, Incremental Opportunity, by End-use Industry, 2021‒2031
Figure 86: Asia Pacific Inductor Market Projections by Country and Sub-region, Value (US$ Mn), 2017‒2031
Figure 87: Asia Pacific Inductor Market Share Analysis, by Country and Sub-region, 2022 and 2031
Figure 88: Asia Pacific Inductor Market, Incremental Opportunity, by Country and Sub-region, 2021‒2031
Figure 89: Middle East & Africa Inductor Market Projections by Inductance, Value (US$ Mn), 2017‒2031
Figure 90: Middle East & Africa Inductor Market Share Analysis, by Inductance, 2022 and 2031
Figure 91: Middle East & Africa Inductor Market, Incremental Opportunity, by Inductance, 2021‒2031
Figure 92: Middle East & Africa Inductor Market Projections by Type, Value (US$ Mn), 2017‒2031
Figure 93: Middle East & Africa Inductor Market Share Analysis, by Type, 2022 and 2031
Figure 94: Middle East & Africa Inductor Market, Incremental Opportunity, by Type, 2021‒2031
Figure 95: Middle East & Africa Inductor Market Projections by Core Type, Value (US$ Mn), 2017‒2031
Figure 96: Middle East & Africa Inductor Market Share Analysis, by Core Type, 2022 and 2031
Figure 97: Middle East & Africa Inductor Market, Incremental Opportunity, by Core Type, 2021‒2031
Figure 98: Middle East & Africa Inductor Market Projections by Shield Type, Value (US$ Mn), 2017‒2031
Figure 99: Middle East & Africa Inductor Market Share Analysis, by Shield Type, 2022 and 2031
Figure 100: Middle East & Africa Inductor Market, Incremental Opportunity, by Shield Type, 2021‒2031
Figure 101: Middle East & Africa Inductor Market Projections by Mounting, Value (US$ Mn), 2017‒2031
Figure 102: Middle East & Africa Inductor Market Share Analysis, by Mounting, 2022 and 2031
Figure 103: Middle East & Africa Inductor Market, Incremental Opportunity, by Mounting, 2021‒2031
Figure 104: Middle East & Africa Inductor Market Projections by End-use Industry, Value (US$ Mn), 2017‒2031
Figure 105: Middle East & Africa Inductor Market Share Analysis, by End-use Industry, 2022 and 2031
Figure 106: Middle East & Africa Inductor Market, Incremental Opportunity, by End-use Industry, 2021‒2031
Figure 107: Middle East & Africa Inductor Market Projections by Country and Sub-region, Value (US$ Mn), 2017‒2031
Figure 108: Middle East & Africa Inductor Market Share Analysis, by Country and Sub-region, 2022 and 2031
Figure 109: Middle East & Africa Inductor Market, Incremental Opportunity, by Country and Sub-region, 2021‒2031
Figure 110: South America Inductor Market Projections by Inductance, Value (US$ Mn), 2017‒2031
Figure 111: South America Inductor Market Share Analysis, by Inductance, 2022 and 2031
Figure 112: South America Inductor Market, Incremental Opportunity, by Inductance, 2021‒2031
Figure 113: South America Inductor Market Projections by Type, Value (US$ Mn), 2017‒2031
Figure 114: South America Inductor Market Share Analysis, by Type, 2022 and 2031
Figure 115: South America Inductor Market, Incremental Opportunity, by Type, 2021‒2031
Figure 116: South America Inductor Market Projections by Core Type, Value (US$ Mn), 2017‒2031
Figure 117: South America Inductor Market Share Analysis, by Core Type, 2022 and 2031
Figure 118: South America Inductor Market, Incremental Opportunity, by Core Type, 2021‒2031
Figure 119: South America Inductor Market Projections by Shield Type, Value (US$ Mn), 2017‒2031
Figure 120: South America Inductor Market Share Analysis, by Shield Type, 2022 and 2031
Figure 121: South America Inductor Market, Incremental Opportunity, by Shield Type, 2021‒2031
Figure 122: South America Inductor Market Projections by Mounting, Value (US$ Mn), 2017‒2031
Figure 123: South America Inductor Market Share Analysis, by Mounting, 2022 and 2031
Figure 124: South America Inductor Market, Incremental Opportunity, by Mounting, 2021‒2031
Figure 125: South America Inductor Market Projections by End-use Industry, Value (US$ Mn), 2017‒2031
Figure 126: South America Inductor Market Share Analysis, by End-use Industry, 2022 and 2031
Figure 127: South America Inductor Market, Incremental Opportunity, by End-use Industry, 2021‒2031
Figure 128: South America Inductor Market Projections by Country and Sub-region, Value (US$ Mn), 2017‒2031
Figure 129: South America Inductor Market Share Analysis, by Country and Sub-region, 2022 and 2031
Figure 130: South America Inductor Market, Incremental Opportunity, by Country and Sub-region, 2021‒2031
Figure 131: Company Share Analysis (2021)
Copyright © Transparency Market Research, Inc. All Rights reserved
Trust Online

Inductor Market