
Reports
Reports
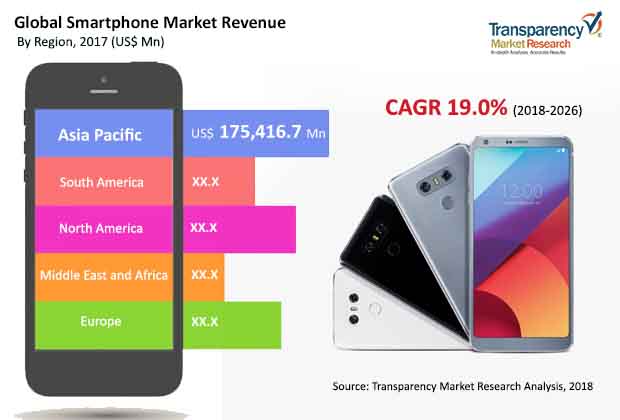
Global Smartphone Market - Snapshot
Smartphones have become a necessity rather than luxury. More than half of the global population own smartphones. It is a comprehensive, portable device which helps in communication, data storage, and gives accessibility to huge data available from around the world. Smartphones have substituted technologies such as large desktop computers, expensive cameras, and landline phones. Presently, smartphones are available at much lower price than they were five years ago; therefore, people of all income groups can afford them. This has increased sales of smartphones across the globe.
Smartphones are available in various sizes, price range, and supports different operating systems. People use smartphone not only for calls but also for browsing, storing data, and clicking photographs. Smartphone penetration has increased in the last two years. The smartphone market has reached market maturity in some countries.
Growing dependency on smartphones for organizing work and personal data and affordability of the device is driving the market. Additionally, opportunity for further smartphone penetration in developing regions such as Asia, Africa, and the Middle East is anticipated to propel the smartphone market.
The global smartphone market is segmented based on operating system, distribution channel, RAM size, price range, size, and region. In terms of operating system, the market is segmented into Android, iOS, and Windows. Based on distribution channel, the market is segregated into online channel and offline channel. The offline channel segment is further bifurcated into single store and multi-store. In terms of price range, the market is divided into below US$ 100, US$ 100-200, US$ 200–500, US$ 500 and above. Based on RAM size, the market is categorized into below 2GB, 2GB–4GB, and up to 8GB.
Android is the most popular operating system among end-users, followed by iOS. Demand for Windows operating system has declined over the last few years.
Smartphone manufacturers use a combination of both online and offline platforms for the sale of their devices. However, as of 2017, the offline platform (single and multi-brand store) was a highly preferred distribution channel. Among single and multi-brand stores, people prefer buying smartphones from multi-brand stores as these stores offer various discounts on devices.
Based on region, the global smartphone market is segmented into North America, Europe, Asia Pacific, Middle East & Africa, and South America. Asia Pacific dominates the smartphone market, followed by North America and Europe. Smartphone replacement is a key trend driving the smartphone market in these regions. Furthermore, the market in Asia Pacific is projected to expand significantly due to the presence of leading players such Xiaomi Corporation, One Plus Corporation, and Huawei Technologies Co Ltd.
The smartphone market is witnessing decline in revenue and shipment due to market maturity in some countries. People in several countries are not frequently replacing their older phones. They prefer repairing and refurbishing their devices, which is adversely impacting the smartphone market.
Key players operating in this market adopt strategies such as product innovation, strategic alliances, partnerships, and acquisitions.The smartphone market is quite competitive; however, it is dominated by a few key players. Some of the major players in the global smartphone market include Apple, Inc., OPPO Co Ltd., Panasonic Corporation, Samsung Electronics Co., Ltd., LG Electronics Inc., Nokia Corporation, Sony Corporation, HTC Corporation, Xiaomi Corporation, One Plus Corporation, Huawei Technologies Co Ltd., Motorola Solutions, Inc., Google, Inc., Microsoft Corporation and Lenovo Group Limited.
Overwhelming Popularity among the Masses to Propel Growth Opportunities across the Smartphone Market
The smartphone sector has been developing and growing steadily since its advent. The popularity of smartphones has touched its peak. Even people from the remotest areas have a smartphone nowadays as it has not only become a trend but a necessity. All these aspects will bring tremendous growth opportunities for the global smartphone market during the forecast period of 2018-2026.
1. Preface
1.1. Market Scope
1.2. Market Segmentation
1.3. Key Research Objectives
2. Assumptions and Research Methodology
2.1. Market Taxonomy - Segment Definitions
2.2. Research Methodology
2.2.1. List of Primary and Secondary Sources
2.3. Key Assumptions for Data Modeling
3. Executive Summary : Global Smartphone Market
4. Market Overview
4.1. Introduction
4.2. Global Market–Macro Economic Factors Overview
4.2.1. Key Regional Socio-political-technological Developments and their Impact Considerations
4.2.2. PESTEL Analysis - Global Smartphone Market
4.3. Market Dynamics
4.3.1. Drivers
4.3.1.1. Supply Side
4.3.1.2. Demand Side
4.3.2. Restraints
4.3.3. Opportunities
4.3.4. Impact Analysis of Drivers & Restraints
4.4. Regulations and Policies–by Region
4.5. Porter’s Five Forces Analysis - Global Smartphone Market
4.6. Key Market Indicators
4.6.1. Global Inflation Growth Rate
4.6.2. Per Capita Disposable Income
4.6.3. High Speed Internet Penetration Rate
4.6.4. Mobile Insurance Acceptance Rate
4.7. Cost Analysis
4.7.1. Margin Analysis
4.8. Ecosystem Analysis - Global Smartphone Market
4.9. Global Smartphone Market Analysis and Forecast, 2016–2026
4.9.1. Market Revenue Analysis (US$ Mn & Million Units)
4.9.1.1. Historic growth trends, 2012-2017
4.9.1.2. Forecast trends, 2017-2026
4.10. Market Outlook
4.11. Competitive Scenario and Trends
4.11.1. Smartphone Market Concentration Rate
4.11.1.1. List of New Entrants
4.11.2. Mergers & Acquisitions, Expansions
5. Global Smartphone Market Analysis and Forecast, by Operating System
5.1. Overview & Definition
5.2. Smartphone Market Size (US$ Mn & Million Units) Forecast, by Operating System, 2016–2026
5.2.1. Android
5.2.2. iOS
5.2.3. Windows
5.3. Market Attractiveness by Operating System
6. Global Smartphone Market Analysis and Forecast, by Distribution Channel
6.1. Overview & Definition
6.2. Smartphone Market Size (US$ Mn & Million Units) Forecast, by Distribution Channel, 2016–2026
6.2.1. Online
6.2.2. Offline
6.2.2.1. Single Brand Store
6.2.2.2. Multi-brand Store
6.3. Market Attractiveness by Distribution Channel
7. Global Smartphone Market Analysis and Forecast, by Price Range
7.1. Overview & Definition
7.2. Smartphone Market Size (US$ Mn & Million Units) Forecast, by Price Range, 2016–2026
7.2.1. Below US$ 100
7.2.2. US$ 100–US$ 200
7.2.3. US$ 200–US$ 500
7.2.4. US$ 500 & Above
7.3. Market Attractiveness by Price Range
8. Global Smartphone Market Analysis and Forecast, by RAM Size
8.1. Overview & Definition
8.2. Smartphone Market Size (US$ Mn & Million Units) Forecast, by RAM Size, 2016–2026
8.2.1. Below 2GB
8.2.2. 2GB–4GB
8.2.3. Up to 8GB
8.3. Market Attractiveness by RAM Size
9. Global Smartphone Market Analysis and Forecast, by Size
9.1. Overview & Definition
9.2. Smartphone Market Size (US$ Mn & Million Units) Forecast, by Size, 2016–2026
9.2.1. Below 4.0"
9.2.2. 4.0"–5.0"
9.2.3. Up to 6.0"
9.3. Market Attractiveness by Size
10. Global Smartphone Market Analysis and Forecast, by Region
10.1. Key Findings
10.2. Smartphone Market Size (US$ Mn & Million Units) Forecast, by Region, 2016–2026
10.2.1. North America
10.2.2. Europe
10.2.3. Asia Pacific
10.2.4. Middle East & Africa
10.2.5. South America
10.3. Market Attractiveness by Region
11. North America Smartphone Market Analysis and Forecast
11.1. Key Findings
11.2. Brand Analysis
11.3. Replacement (Replacement/Refurbished/Upgrades) Rate (%)
11.4. Market Dynamics
11.4.1. Drivers
11.4.1.1. Supply Side
11.4.1.2. Demand Side
11.4.2. Restraints
11.4.3. Opportunities
11.4.4. Impact Analysis of Drivers & Restraints
11.5. Smartphone Market Size (US$ Mn & Million Units) Forecast, by Operating System, 2016–2026
11.5.1. Android
11.5.2. iOS
11.5.3. Windows
11.6. Smartphone Market Size (US$ Mn & Million Units) Forecast, by Distribution Channel, 2016–2026
11.6.1. Online
11.6.2. Offline
11.6.2.1. Single Brand Store
11.6.2.2. Multi-brand Store
11.7. Smartphone Market Size (US$ Mn & Million Units) Forecast, by Price Range, 2016–2026
11.7.1. Below US$ 100
11.7.2. US$ 100–US$ 200
11.7.3. US$ 200–US$ 500
11.7.4. US$ 500 & Above
11.8. Smartphone Market Size (US$ Mn &Million Units) Forecast, by RAM Size, 2016–2026
11.8.1. Below 2GB
11.8.2. 2GB–4GB
11.8.3. Up to 8GB
11.9. Smartphone Market Size (US$ Mn &Million Units) Forecast, by Size, 2016–2026
11.9.1. Below 4.0"
11.9.2. 4.0"–5.0"
11.9.3. Up to 6.0"
11.10. Smartphone Market Size (US$ Mn &Million Units) Forecast, by Country, 2016–2026
11.10.1. The U.S.
11.10.2. Canada
11.10.3. Rest of North America
11.11. Market Attractiveness Analysis
11.11.1. By Operating System
11.11.2. By Distribution Channel
11.11.3. By Price Range
11.11.4. By RAM Size
11.11.5. By Size
11.11.6. By Country
12. U.S. Smartphone Market Analysis and Forecast
12.1. Smartphone Market Size (US$ Mn &Million Units) Forecast, by Operating System, 2016–2026
12.1.1. Android
12.1.2. iOS
12.1.3. Windows
12.2. Smartphone Market Size (US$ Mn &Million Units) Forecast, by Distribution Channel, 2016–2026
12.2.1. Online
12.2.2. Offline
12.2.2.1. Single Brand Store
12.2.2.2. Multi-brand Store
12.3. Smartphone Market Size (US$ Mn &Million Units) Forecast, by Price Range, 2016–2026
12.3.1. Below US$ 100
12.3.2. US$ 100–US$ 200
12.3.3. US$ 200–US$ 500
12.3.4. US$ 500 & Above
12.4. Smartphone Market Size (US$ Mn &Million Units) Forecast, by RAM Size, 2016–2026
12.4.1. Below 2GB
12.4.2. 2GB–4GB
12.4.3. Up to 8GB
12.5. Smartphone Market Size (US$ Mn &Million Units) Forecast, by Size, 2016–2026
12.5.1. Below 4.0"
12.5.2. 4.0"–5.0"
12.5.3. Up to 6.0"
13. Canada Smartphone Market Analysis and Forecast
13.1. Smartphone Market Size (US$ Mn &Million Units) Forecast, by Operating System, 2016–2026
13.1.1. Android
13.1.2. iOS
13.1.3. Windows
13.2. Smartphone Market Size (US$ Mn &Million Units) Forecast, by Distribution Channel, 2016–2026
13.2.1. Online
13.2.2. Offline
13.2.2.1. Single Brand Store
13.2.2.2. Multi-brand Store
13.3. Smartphone Market Size (US$ Mn &Million Units) Forecast, by Price Range, 2016–2026
13.3.1. Below US$ 100
13.3.2. US$ 100–US$ 200
13.3.3. US$ 200–US$ 500
13.3.4. US$ 500 & Above
13.4. Smartphone Market Size (US$ Mn &Million Units) Forecast, by RAM Size, 2016–2026
13.4.1. Below 2GB
13.4.2. 2GB–4GB
13.4.3. Up to 8GB
13.5. Smartphone Market Size (US$ Mn &Million Units) Forecast, by Size, 2016–2026
13.5.1. Below 4.0"
13.5.2. 4.0"–5.0"
13.5.3. Up to 6.0"
14. Europe Smartphone Market Analysis and Forecast
14.1. Key Findings
14.2. Brand Analysis
14.3. Replacement (Replacement/Refurbished/Upgrades) Rate (%)
14.4. Market Dynamics
14.4.1. Drivers
14.4.1.1. Supply Side
14.4.1.2. Demand Side
14.4.2. Restraints
14.4.3. Opportunities
14.4.4. Impact Analysis of Drivers & Restraints
14.5. Smartphone Market Size (US$ Mn &Million Units) Forecast, by Operating System, 2016–2026
14.5.1. Android
14.5.2. iOS
14.5.3. Windows
14.6. Smartphone Market Size (US$ Mn &Million Units) Forecast, by Distribution Channel, 2016–2026
14.6.1. Online
14.6.2. Offline
14.6.2.1. Single Brand Store
14.6.2.2. Multi-brand Store
14.7. Smartphone Market Size (US$ Mn &Million Units) Forecast, by Price Range, 2016–2026
14.7.1. Below US$ 100
14.7.2. US$ 100–US$ 200
14.7.3. US$ 200–US$ 500
14.7.4. US$ 500 & Above
14.8. Smartphone Market Size (US$ Mn &Million Units) Forecast, by RAM Size, 2016–2026
14.8.1. Below 2GB
14.8.2. 2GB–4GB
14.8.3. Up to 8GB
14.9. Smartphone Market Size (US$ Mn &Million Units) Forecast, by Size, 2016–2026
14.9.1. Below 4.0"
14.9.2. 4.0"–5.0"
14.9.3. Up to 6.0"
14.10. Smartphone Market Size (US$ Mn &Million Units) Forecast, by Country, 2016–2026
14.10.1. Germany
14.10.2. France
14.10.3. U.K.
14.10.4. Italy
14.10.5. Spain
14.10.6. Rest of Europe
14.11. Market Attractiveness Analysis
14.11.1. By Operating System
14.11.2. By Distribution Channel
14.11.3. By RAM Size
14.11.4. By Size
14.11.5. By Price Range
14.11.6. By Country
15. Germany Smartphone Market Analysis and Forecast
15.1. Smartphone Market Size (US$ Mn &Million Units) Forecast, by Operating System, 2016–2026
15.1.1. Android
15.1.2. iOS
15.1.3. Windows
15.2. Smartphone Market Size (US$ Mn &Million Units) Forecast, by Distribution Channel, 2016–2026
15.2.1. Online
15.2.2. Offline
15.2.2.1. Single Brand Store
15.2.2.2. Multi-brand Store
15.3. Smartphone Market Size (US$ Mn &Million Units) Forecast, by Price Range, 2016–2026
15.3.1. Below US$ 100
15.3.2. US$ 100–US$ 200
15.3.3. US$ 200–US$ 500
15.3.4. US$ 500 & Above
15.4. Smartphone Market Size (US$ Mn &Million Units) Forecast, by RAM Size, 2016–2026
15.4.1. Below 2GB
15.4.2. 2GB–4GB
15.4.3. Up to 8GB
15.5. Smartphone Market Size (US$ Mn &Million Units) Forecast, by Size, 2016–2026
15.5.1. Below 4.0"
15.5.2. 4.0"–5.0"
15.5.3. Up to 6.0"
16. France Smartphone Market Analysis and Forecast
16.1. Smartphone Market Size (US$ Mn &Million Units) Forecast, by Operating System, 2016–2026
16.1.1. Android
16.1.2. iOS
16.1.3. Windows
16.2. Smartphone Market Size (US$ Mn &Million Units) Forecast, by Distribution Channel, 2016–2026
16.2.1. Online
16.2.2. Offline
16.2.2.1. Single Brand Store
16.2.2.2. Multi-brand Store
16.3. Smartphone Market Size (US$ Mn &Million Units) Forecast, by Price Range, 2016–2026
16.3.1. Below US$ 100
16.3.2. US$ 100–US$ 200
16.3.3. US$ 200–US$ 500
16.3.4. US$ 500 & Above
16.4. Smartphone Market Size (US$ Mn &Million Units) Forecast, by RAM Size, 2016–2026
16.4.1. Below 2GB
16.4.2. 2GB–4GB
16.4.3. Up to 8GB
16.5. Smartphone Market Size (US$ Mn &Million Units) Forecast, by Size, 2016–2026
16.5.1. Below 4.0"
16.5.2. 4.0"–5.0"
16.5.3. Up to 6.0"
17. U.K. Smartphone Market Analysis and Forecast
17.1. Smartphone Market Size (US$ Mn &Million Units) Forecast, by Operating System, 2016–2026
17.1.1. Android
17.1.2. iOS
17.1.3. Windows
17.2. Smartphone Market Size (US$ Mn &Million Units) Forecast, by Distribution Channel, 2016–2026
17.2.1. Online
17.2.2. Offline
17.2.2.1. Single Brand Store
17.2.2.2. Multi-brand Store
17.3. Smartphone Market Size (US$ Mn &Million Units) Forecast, by Price Range, 2016–2026
17.3.1. Below US$ 100
17.3.2. US$ 100–US$ 200
17.3.3. US$ 200–US$ 500
17.3.4. US$ 500 & Above
17.4. Smartphone Market Size (US$ Mn &Million Units) Forecast, by RAM Size, 2016–2026
17.4.1. Below 2GB
17.4.2. 2GB–4GB
17.4.3. Up to 8GB
17.5. Smartphone Market Size (US$ Mn &Million Units) Forecast, by Size, 2016–2026
17.5.1. Below 4.0"
17.5.2. 4.0"–5.0"
17.5.3. Up to 6.0"
18. Italy Smartphone Market Analysis and Forecast
18.1. Smartphone Market Size (US$ Mn &Million Units) Forecast, by Operating System, 2016–2026
18.1.1. Android
18.1.2. iOS
18.1.3. Windows
18.2. Smartphone Market Size (US$ Mn &Million Units) Forecast, by Distribution Channel, 2016–2026
18.2.1. Online
18.2.2. Offline
18.2.2.1. Single Brand Store
18.2.2.2. Multi-brand Store
18.3. Smartphone Market Size (US$ Mn &Million Units) Forecast, by Price Range, 2016–2026
18.3.1. Below US$ 100
18.3.2. US$ 100–US$ 200
18.3.3. US$ 200–US$ 500
18.3.4. US$ 500 & Above
18.4. Smartphone Market Size (US$ Mn &Million Units) Forecast, by RAM Size, 2016–2026
18.4.1. Below 2GB
18.4.2. 2GB–4GB
18.4.3. Up to 8GB
18.5. Smartphone Market Size (US$ Mn &Million Units) Forecast, by Size, 2016–2026
18.5.1. Below 4.0"
18.5.2. 4.0"–5.0"
18.5.3. Up to 6.0"
19. Spain Smartphone Market Analysis and Forecast
19.1. Smartphone Market Size (US$ Mn &Million Units) Forecast, by Operating System, 2016–2026
19.1.1. Android
19.1.2. iOS
19.1.3. Windows
19.2. Smartphone Market Size (US$ Mn &Million Units) Forecast, by Distribution Channel, 2016–2026
19.2.1. Online
19.2.2. Offline
19.2.2.1. Single Brand Store
19.2.2.2. Multi-brand Store
19.3. Smartphone Market Size (US$ Mn &Million Units) Forecast, by Price Range, 2016–2026
19.3.1. Below US$ 100
19.3.2. US$ 100–US$ 200
19.3.3. US$ 200–US$ 500
19.3.4. US$ 500 & Above
19.4. Smartphone Market Size (US$ Mn &Million Units) Forecast, by RAM Size, 2016–2026
19.4.1. Below 2GB
19.4.2. 2GB–4GB
19.4.3. Up to 8GB
19.5. Smartphone Market Size (US$ Mn &Million Units) Forecast, by Size, 2016–2026
19.5.1. Below 4.0"
19.5.2. 4.0"–5.0"
19.5.3. Up to 6.0"
20. Asia Pacific Smartphone Market Analysis and Forecast
20.1. Key Findings
20.2. Brand Analysis
20.3. Replacement (Replacement/Refurbished/Upgrades) Rate (%)
20.4. Market Dynamics
20.4.1. Drivers
20.4.1.1. Supply Side
20.4.1.2. Demand Side
20.4.2. Restraints
20.4.3. Opportunities
20.4.4. Impact Analysis of Drivers & Restraints
20.5. Smartphone Market Size (US$ Mn &Million Units) Forecast, by Operating System, 2016–2026
20.5.1. Android
20.5.2. iOS
20.5.3. Windows
20.6. Smartphone Market Size (US$ Mn &Million Units) Forecast, by Distribution Channel, 2016–2026
20.6.1. Online
20.6.2. Offline
20.6.2.1. Single Brand Store
20.6.2.2. Multi-brand Store
20.7. Smartphone Market Size (US$ Mn &Million Units) Forecast, by Price Range, 2016–2026
20.7.1. Below US$ 100
20.7.2. US$ 100–US$ 200
20.7.3. US$ 200–US$ 500
20.7.4. US$ 500 & Above
20.8. Smartphone Market Size (US$ Mn &Million Units) Forecast, by RAM Size, 2016–2026
20.8.1. Below 2GB
20.8.2. 2GB–4GB
20.8.3. Up to 8GB
20.9. Smartphone Market Size (US$ Mn &Million Units) Forecast, by Size, 2016–2026
20.9.1. Below 4.0"
20.9.2. 4.0"–5.0"
20.9.3. Up to 6.0"
20.10. Smartphone Market Size (US$ Mn &Million Units) Forecast, by Country, 2016–2026
20.10.1. China
20.10.2. Japan
20.10.3. India
20.10.4. Australia
20.10.5. South Korea
20.10.6. Rest of Asia Pacific
20.11. Market Attractiveness Analysis
20.11.1. By Operating System
20.11.2. By Distribution Channel
20.11.3. By Price Range
20.11.4. By RAM Size
20.11.5. By Size
20.11.6. By Country
21. China Smartphone Market Analysis and Forecast
21.1. Smartphone Market Size (US$ Mn &Million Units) Forecast, by Operating System, 2016–2026
21.1.1. Android
21.1.2. iOS
21.1.3. Windows
21.2. Smartphone Market Size (US$ Mn &Million Units) Forecast, by Distribution Channel, 2016–2026
21.2.1. Online
21.2.2. Offline
21.2.2.1. Single Brand Store
21.2.2.2. Multi-brand Store
21.3. Smartphone Market Size (US$ Mn &Million Units) Forecast, by Price Range, 2016–2026
21.3.1. Below US$ 100
21.3.2. US$ 100–US$ 200
21.3.3. US$ 200–US$ 500
21.3.4. US$ 500 & Above
21.4. Smartphone Market Size (US$ Mn &Million Units) Forecast, by RAM Size, 2016–2026
21.4.1. Below 2GB
21.4.2. 2GB–4GB
21.4.3. Up to 8GB
21.5. Smartphone Market Size (US$ Mn &Million Units) Forecast, by Size, 2016–2026
21.5.1. Below 4.0"
21.5.2. 4.0"–5.0"
21.5.3. Up to 6.0"
22. India Smartphone Market Analysis and Forecast
22.1. Smartphone Market Size (US$ Mn &Million Units) Forecast, by Operating System, 2016–2026
22.1.1. Android
22.1.2. iOS
22.1.3. Windows
22.2. Smartphone Market Size (US$ Mn &Million Units) Forecast, by Distribution Channel, 2016–2026
22.2.1. Online
22.2.2. Offline
22.2.2.1. Single Brand Store
22.2.2.2. Multi-brand Store
22.3. Smartphone Market Size (US$ Mn &Million Units) Forecast, by Price Range, 2016–2026
22.3.1. Below US$ 100
22.3.2. US$ 100–US$ 200
22.3.3. US$ 200–US$ 500
22.3.4. US$ 500 & Above
22.4. Smartphone Market Size (US$ Mn &Million Units) Forecast, by RAM Size, 2016–2026
22.4.1. Below 2GB
22.4.2. 2GB–4GB
22.4.3. Up to 8GB
22.5. Smartphone Market Size (US$ Mn &Million Units) Forecast, by Size, 2016–2026
22.5.1. Below 4.0"
22.5.2. 4.0"–5.0"
22.5.3. Up to 6.0"
23. Japan Smartphone Market Analysis and Forecast
23.1. Smartphone Market Size (US$ Mn &Million Units) Forecast, by Operating System, 2016–2026
23.1.1. Android
23.1.2. iOS
23.1.3. Windows
23.2. Smartphone Market Size (US$ Mn &Million Units) Forecast, by Distribution Channel, 2016–2026
23.2.1. Online
23.2.2. Offline
23.2.2.1. Single Brand Store
23.2.2.2. Multi-brand Store
23.3. Smartphone Market Size (US$ Mn &Million Units) Forecast, by Price Range, 2016–2026
23.3.1. Below US$ 100
23.3.2. US$ 100–US$ 200
23.3.3. US$ 200–US$ 500
23.3.4. US$ 500 & Above
23.4. Smartphone Market Size (US$ Mn &Million Units) Forecast, by RAM Size, 2016–2026
23.4.1. Below 2GB
23.4.2. 2GB–4GB
23.4.3. Up to 8GB
23.5. Smartphone Market Size (US$ Mn &Million Units) Forecast, by Size, 2016–2026
23.5.1. Below 4.0"
23.5.2. 4.0"–5.0"
23.5.3. Up to 6.0"
24. Australia Smartphone Market Analysis and Forecast
24.1. Smartphone Market Size (US$ Mn &Million Units) Forecast, by Operating System, 2016–2026
24.1.1. Android
24.1.2. iOS
24.1.3. Windows
24.2. Smartphone Market Size (US$ Mn &Million Units) Forecast, by Distribution Channel, 2016–2026
24.2.1. Online
24.2.2. Offline
24.2.2.1. Single Brand Store
24.2.2.2. Multi-brand Store
24.3. Smartphone Market Size (US$ Mn &Million Units) Forecast, by Price Range, 2016–2026
24.3.1. Below US$ 100
24.3.2. US$ 100–US$ 200
24.3.3. US$ 200–US$ 500
24.3.4. US$ 500 & Above
24.4. Smartphone Market Size (US$ Mn &Million Units) Forecast, by RAM Size, 2016–2026
24.4.1. Below 2GB
24.4.2. 2GB–4GB
24.4.3. Up to 8GB
24.5. Smartphone Market Size (US$ Mn &Million Units) Forecast, by Size, 2016–2026
24.5.1. Below 4.0"
24.5.2. 4.0"–5.0"
24.5.3. Up to 6.0"
25. South Korea Smartphone Market Analysis and Forecast
25.1. Smartphone Market Size (US$ Mn &Million Units) Forecast, by Operating System, 2016–2026
25.1.1. Android
25.1.2. iOS
25.1.3. Windows
25.2. Smartphone Market Size (US$ Mn &Million Units) Forecast, by Distribution Channel, 2016–2026
25.2.1. Online
25.2.2. Offline
25.2.2.1. Single Brand Store
25.2.2.2. Multi-brand Store
25.3. Smartphone Market Size (US$ Mn &Million Units) Forecast, by Price Range, 2016–2026
25.3.1. Below US$ 100
25.3.2. US$ 100–US$ 200
25.3.3. US$ 200–US$ 500
25.3.4. US$ 500 & Above
25.4. Smartphone Market Size (US$ Mn &Million Units) Forecast, by RAM Size, 2016–2026
25.4.1. Below 2GB
25.4.2. 2GB–4GB
25.4.3. Up to 8GB
25.5. Smartphone Market Size (US$ Mn &Million Units) Forecast, by Size, 2016–2026
25.5.1. Below 4.0"
25.5.2. 4.0"–5.0"
25.5.3. Up to 6.0"
26. Middle East and Africa (MEA) Smartphone Market Analysis and Forecast
26.1. Key Findings
26.2. Brand Analysis
26.3. Replacement (Replacement/Refurbished/Upgrades) Rate (%)
26.4. Market Dynamics
26.4.1. Drivers
26.4.1.1. Supply Side
26.4.1.2. Demand Side
26.4.2. Restraints
26.4.3. Opportunities
26.4.4. Impact Analysis of Drivers & Restraints
26.5. Smartphone Market Size (US$ Mn &Million Units) Forecast, by Operating System, 2016–2026
26.5.1. Android
26.5.2. iOS
26.5.3. Windows
26.6. Smartphone Market Size (US$ Mn &Million Units) Forecast, by Distribution Channel, 2016–2026
26.6.1. Online
26.6.2. Offline
26.6.2.1. Single Brand Store
26.6.2.2. Multi-brand Store
26.7. Smartphone Market Size (US$ Mn &Million Units) Forecast, by Price Range, 2016–2026
26.7.1. Below US$ 100
26.7.2. US$ 100–US$ 200
26.7.3. US$ 200–US$ 500
26.7.4. US$ 500 & Above
26.8. Smartphone Market Size (US$ Mn &Million Units) Forecast, by RAM Size, 2016–2026
26.8.1. Below 2GB
26.8.2. 2GB–4GB
26.8.3. Up to 8GB
26.9. Smartphone Market Size (US$ Mn &Million Units) Forecast, by Size, 2016–2026
26.9.1. Below 4.0"
26.9.2. 4.0"–5.0"
26.9.3. Up to 6.0"
26.10. Smartphone Market Size (US$ Mn &Million Units) Forecast, by Country, 2016–2026
26.10.1. GCC
26.10.2. South Africa
26.10.3. Rest of MEA
26.11. Market Attractiveness Analysis
26.11.1. By Operating System
26.11.2. By Distribution Channel
26.11.3. By Price Range
26.11.4. By RAM Size
26.11.5. By Size
26.11.6. By Country
27. GCC Smartphone Market Analysis and Forecast
27.1. Smartphone Market Size (US$ Mn &Million Units) Forecast, by Operating System, 2016–2026
27.1.1. Android
27.1.2. iOS
27.1.3. Windows
27.2. Smartphone Market Size (US$ Mn &Million Units) Forecast, by Distribution Channel, 2016–2026
27.2.1. Online
27.2.2. Offline
27.2.2.1. Single Brand Store
27.2.2.2. Multi-brand Store
27.3. Smartphone Market Size (US$ Mn &Million Units) Forecast, by Price Range, 2016–2026
27.3.1. Below US$ 100
27.3.2. US$ 100–US$ 200
27.3.3. US$ 200–US$ 500
27.3.4. US$ 500 & Above
27.4. Smartphone Market Size (US$ Mn &Million Units) Forecast, by RAM Size, 2016–2026
27.4.1. Below 2GB
27.4.2. 2GB–4GB
27.4.3. Up to 8GB
27.5. Smartphone Market Size (US$ Mn &Million Units) Forecast, by Size, 2016–2026
27.5.1. Below 4.0"
27.5.2. 4.0"–5.0"
27.5.3. Up to 6.0"
28. South Africa Smartphone Market Analysis and Forecast
28.1. Smartphone Market Size (US$ Mn &Million Units) Forecast, by Operating System, 2016–2026
28.1.1. Android
28.1.2. iOS
28.1.3. Windows
28.2. Smartphone Market Size (US$ Mn &Million Units) Forecast, by Distribution Channel, 2016–2026
28.2.1. Online
28.2.2. Offline
28.2.2.1. Single Brand Store
28.2.2.2. Multi-brand Store
28.3. Smartphone Market Size (US$ Mn &Million Units) Forecast, by Price Range, 2016–2026
28.3.1. Below US$ 100
28.3.2. US$ 100–US$ 200
28.3.3. US$ 200–US$ 500
28.3.4. US$ 500 & Above
28.4. Smartphone Market Size (US$ Mn &Million Units) Forecast, by RAM Size, 2016–2026
28.4.1. Below 2GB
28.4.2. 2GB–4GB
28.4.3. Up to 8GB
28.5. Smartphone Market Size (US$ Mn &Million Units) Forecast, by Size, 2016–2026
28.5.1. Below 4.0"
28.5.2. 4.0"–5.0"
28.5.3. Up to 6.0"
29. South America Global Smartphone Market Analysis and Forecast
29.1. Key Findings
29.2. Brand Analysis
29.3. Replacement (Replacement/Refurbished/Upgrades) Rate (%)
29.4. Market Dynamics
29.4.1. Drivers
29.4.1.1. Supply Side
29.4.1.2. Demand Side
29.4.2. Restraints
29.4.3. Opportunities
29.4.4. Impact Analysis of Drivers & Restraints
29.5. Smartphone Market Size (US$ Mn &Million Units) Forecast, by Operating System, 2016–2026
29.5.1. Android
29.5.2. iOS
29.5.3. Windows
29.6. Smartphone Market Size (US$ Mn &Million Units) Forecast, by Distribution Channel, 2016–2026
29.6.1. Online
29.6.2. Offline
29.6.2.1. Single Brand Store
29.6.2.2. Multi-brand Store
29.7. Smartphone Market Size (US$ Mn &Million Units) Forecast, by Price Range, 2016–2026
29.7.1. Below US$ 100
29.7.2. US$ 100–US$ 200
29.7.3. US$ 200–US$ 500
29.7.4. US$ 500 & Above
29.8. Smartphone Market Size (US$ Mn &Million Units) Forecast, by RAM Size, 2016–2026
29.8.1. Below 2GB
29.8.2. 2GB–4GB
29.8.3. Up to 8GB
29.9. Smartphone Market Size (US$ Mn &Million Units) Forecast, by Size, 2016–2026
29.9.1. Below 4.0"
29.9.2. 4.0"–5.0"
29.9.3. Up to 6.0"
29.10. Smartphone Market Size (US$ Mn &Million Units) Forecast, by Country, 2016–2026
29.10.1. Brazil
29.10.2. Argentina
29.10.3. Rest of South America
29.11. Market Attractiveness Analysis
29.11.1. By Operating System
29.11.2. By Distribution Channel
29.11.3. By Price Range
29.11.4. By RAM Size
29.11.5. By Size
29.11.6. By Country
30. Brazil Smartphone Market Analysis and Forecast
30.1. Smartphone Market Size (US$ Mn &Million Units) Forecast, by Operating System, 2016–2026
30.1.1. Android
30.1.2. iOS
30.1.3. Windows
30.2. Smartphone Market Size (US$ Mn &Million Units) Forecast, by Distribution Channel, 2016–2026
30.2.1. Online
30.2.2. Offline
30.2.2.1. Single Brand Store
30.2.2.2. Multi-brand Store
30.3. Smartphone Market Size (US$ Mn &Million Units) Forecast, by Price Range, 2016–2026
30.3.1. Below US$ 100
30.3.2. US$ 100–US$ 200
30.3.3. US$ 200–US$ 500
30.3.4. US$ 500 & Above
30.4. Smartphone Market Size (US$ Mn &Million Units) Forecast, by RAM Size, 2016–2026
30.4.1. Below 2GB
30.4.2. 2GB–4GB
30.4.3. Up to 8GB
30.5. Smartphone Market Size (US$ Mn &Million Units) Forecast, by Size, 2016–2026
30.5.1. Below 4.0"
30.5.2. 4.0"–5.0"
30.5.3. Up to 6.0"
31. Argentina Smartphone Market Analysis and Forecast
31.1. Smartphone Market Size (US$ Mn &Million Units) Forecast, by Operating System, 2016–2026
31.1.1. Android
31.1.2. iOS
31.1.3. Windows
31.2. Smartphone Market Size (US$ Mn &Million Units) Forecast, by Distribution Channel, 2016–2026
31.2.1. Online
31.2.2. Offline
31.2.2.1. Single Brand Store
31.2.2.2. Multi-brand Store
31.3. Smartphone Market Size (US$ Mn &Million Units) Forecast, by Price Range, 2016–2026
31.3.1. Below US$ 100
31.3.2. US$ 100–US$ 200
31.3.3. US$ 200–US$ 500
31.3.4. US$ 500 & Above
31.4. Smartphone Market Size (US$ Mn &Million Units) Forecast, by RAM Size, 2016–2026
31.4.1. Below 2GB
31.4.2. 2GB–4GB
31.4.3. Up to 8GB
31.5. Smartphone Market Size (US$ Mn &Million Units) Forecast, by Size, 2016–2026
31.5.1. Below 4.0"
31.5.2. 4.0"–5.0"
31.5.3. Up to 6.0"
32. Competition Landscape
32.1. Market Player–Competition Matrix
32.2. Market Revenue Share Analysis (%), by Company (2017)
32.3. Regional Presence (Intensity Map)
33. Company Profiles
33.1. Apple, Inc.
33.1.1. Basic Overview
33.1.2. Sales Area/Geographical Presence
33.1.3. Revenue
33.1.4. SWOT Analysis
33.1.5. Strategy
33.2. OPPO Co Ltd.
33.2.1. Basic Overview
33.2.2. Sales Area/Geographical Presence
33.2.3. Revenue
33.2.4. SWOT Analysis
33.2.5. Strategy
33.3. Panasonic Corporation
33.3.1. Basic Overview
33.3.2. Sales Area/Geographical Presence
33.3.3. Revenue
33.3.4. SWOT Analysis
33.3.5. Strategy
33.4. Samsung Electronics Co., Ltd.
33.4.1. Basic Overview
33.4.2. Sales Area/Geographical Presence
33.4.3. Revenue
33.4.4. SWOT Analysis
33.4.5. Strategy
33.5. LG Electronics Inc.
33.5.1. Basic Overview
33.5.2. Sales Area/Geographical Presence
33.5.3. Revenue
33.5.4. SWOT Analysis
33.5.5. Strategy
33.6. Nokia Corporation
33.6.1. Basic Overview
33.6.2. Sales Area/Geographical Presence
33.6.3. Revenue
33.6.4. SWOT Analysis
33.6.5. Strategy
33.7. Sony Corporation
33.7.1. Basic Overview
33.7.2. Sales Area/Geographical Presence
33.7.3. Revenue
33.7.4. SWOT Analysis
33.7.5. Strategy
33.8. HTC Corporation
33.8.1. Basic Overview
33.8.2. Sales Area/Geographical Presence
33.8.3. Revenue
33.8.4. SWOT Analysis
33.8.5. Strategy
33.9. Xiaomi Corporation
33.9.1. Basic Overview
33.9.2. Sales Area/Geographical Presence
33.9.3. Revenue
33.9.4. SWOT Analysis
33.9.5. Strategy
33.10. One Plus Corporation
33.10.1. Basic Overview
33.10.2. Sales Area/Geographical Presence
33.10.3. Revenue
33.10.4. SWOT Analysis
33.10.5. Strategy
33.11. Huawei Technologies Co Ltd.
33.11.1. Basic Overview
33.11.2. Sales Area/Geographical Presence
33.11.3. Revenue
33.11.4. SWOT Analysis
33.11.5. Strategy
33.12. Motorola Solutions, Inc.
33.12.1. Basic Overview
33.12.2. Sales Area/Geographical Presence
33.12.3. Revenue
33.12.4. SWOT Analysis
33.12.5. Strategy
33.13. Google, Inc.
33.13.1. Basic Overview
33.13.2. Sales Area/Geographical Presence
33.13.3. Revenue
33.13.4. SWOT Analysis
33.13.5. Strategy
33.14. Microsoft Corporation
33.14.1. Basic Overview
33.14.2. Sales Area/Geographical Presence
33.14.3. Revenue
33.14.4. SWOT Analysis
33.14.5. Strategy
33.15. Lenovo Group Limited
33.15.1. Basic Overview
33.15.2. Sales Area/Geographical Presence
33.15.3. Revenue
33.15.4. SWOT Analysis
33.15.5. Strategy
34. Key Takeaways
List of Tables
Table 1: Regulatory Framework
Table 2: Average Disposable Income by Key Countries
Table 3: Region-wise Internet Penetration out of the Total Population
Table 4: Smartphone Margin Analysis
Table 5: Smartphone Vendors R&D Investment, 2016
Table 6: Replacement/ Refurbished/ Upgrades Rate, 2017
Table 7: Global Smartphone Market Revenue (US$ Mn) Forecast, By Operating System, 2016 - 2026
Table 8: Global Smartphone Market Volume (Mn Units) Forecast, By Operating System, 2016 - 2026
Table 9: Global Smartphone Market Revenue (US$ Mn) Forecast, Distribution Channel, 2016 - 2026
Table 10: Global Smartphone Market Volume (Mn Units) Forecast, By Distribution Channel, 2016 - 2026
Table 11: Global Smartphone Market Revenue (US$ Mn) Forecast, Price Range, 2016 - 2026
Table 12: Global Smartphone Market Volume (Mn Units) Forecast, By Price Range, 2016 - 2026
Table 13: Global Smartphone Market Revenue (US$ Mn) Forecast, Size, 2016 - 2026
Table 14: Global Smartphone Market Volume (Mn Units) Forecast, By Size, 2016 - 2026
Table 15: Global Smartphone Market Revenue (US$ Mn) Forecast, RAM Size, 2016 - 2026
Table 16: Global Smartphone Market Volume (Mn Units) Forecast, By RAM Size, 2016 - 2026
Table 17: Global Smartphone Market Revenue (US$ Mn) Forecast, By Region, 2016 - 2026
Table 18: Global Smartphone Market Volume (Mn Units) Forecast, By Region, 2016 - 2026
Table 19: North America Smartphone Market Revenue (US$ Mn) Forecast, By Operating System, 2016 - 2026
Table 20: North America Smartphone Market Volume (Mn Units) Forecast, By Operating System, 2016 - 2026
Table 21: North America Smartphone Market Revenue (US$ Mn) Forecast, Distribution Channel, 2016 - 2026
Table 22: North America Smartphone Market Volume (Mn Units) Forecast, By Distribution Channel, 2016 - 2026
Table 23: North America Smartphone Market Revenue (US$ Mn) Forecast, Price Range, 2016 - 2026
Table 24: North America Smartphone Market Volume (Mn Units) Forecast, By Price Range, 2016 - 2026
Table 25: North America Smartphone Market Revenue (US$ Mn) Forecast, Size, 2016 - 2026
Table 26: North America Smartphone Market Volume (Mn Units) Forecast, By Size, 2016 - 2026
Table 27: North America Smartphone Market Revenue (US$ Mn) Forecast, RAM Size, 2016 - 2026
Table 28: North America Smartphone Market Volume (Mn Units) Forecast, By RAM Size, 2016 - 2026
Table 29: North America Smartphone Market Revenue (US$ Mn) Forecast, Country, 2016 - 2026
Table 30: North America Smartphone Market Volume (Mn Units) Forecast, By Country, 2016 - 2026
Table 31: U.S. Smartphone Market Revenue (US$ Mn) Forecast, By Operating System, 2016 - 2026
Table 32: U.S. Smartphone Market Volume (Mn Units) Forecast, By Operating System, 2016 - 2026
Table 33: U.S. Smartphone Market Revenue (US$ Mn) Forecast, Price Range, 2016 - 2026
Table 34: U.S. Smartphone Market Volume (Mn Units) Forecast, By Price Range, 2016 - 2026
Table 35: U.S. Smartphone Market Revenue (US$ Mn) Forecast, Size, 2016 - 2026
Table 36: U.S. Smartphone Market Volume (Mn Units) Forecast, By Size, 2016 - 2026
Table 37: U.S. Smartphone Market Revenue (US$ Mn) Forecast, RAM Size, 2016 - 2026
Table 38: U.S. Smartphone Market Volume (Mn Units) Forecast, By RAM Size, 2016 - 2026
Table 39: Canada Smartphone Market Revenue (US$ Mn) Forecast, By Operating System, 2016 - 2026
Table 40: Canada Smartphone Market Volume (Mn Units) Forecast, By Operating System, 2016 - 2026
Table 41: Canada Smartphone Market Revenue (US$ Mn) Forecast, Distribution Channel, 2016 - 2026
Table 42: Canada Smartphone Market Volume (Mn Units) Forecast, By Distribution Channel, 2016 - 2026
Table 43: Canada Smartphone Market Revenue (US$ Mn) Forecast, Price Range, 2016 - 2026
Table 44: Canada Smartphone Market Volume (Mn Units) Forecast, By Price Range, 2016 - 2026
Table 45: Canada Smartphone Market Revenue (US$ Mn) Forecast, Size, 2016 - 2026
Table 46: Canada Smartphone Market Volume (Mn Units) Forecast, By Size, 2016 - 2026
Table 47: Canada Smartphone Market Revenue (US$ Mn) Forecast, RAM Size, 2016 - 2026
Table 48: Canada Smartphone Market Volume (Mn Units) Forecast, By RAM Size, 2016 - 2026
Table 49: Europe Smartphone Market Revenue (US$ Mn) Forecast, By Operating System, 2016 - 2026
Table 50: Europe Smartphone Market Volume (Mn Units) Forecast, By Operating System, 2016 - 2026
Table 51: Europe Smartphone Market Revenue (US$ Mn) Forecast, Distribution Channel, 2016 - 2026
Table 52: Europe Smartphone Market Volume (Mn Units) Forecast, By Distribution Channel, 2016 - 2026
Table 53: Europe Smartphone Market Revenue (US$ Mn) Forecast, Price Range, 2016 - 2026
Table 54: Europe Smartphone Market Volume (Mn Units) Forecast, By Price Range, 2016 - 2026
Table 55: Europe Smartphone Market Revenue (US$ Mn) Forecast, Size, 2016 - 2026
Table 56: Europe Smartphone Market Volume (Mn Units) Forecast, By Size, 2016 - 2026
Table 57: Europe Smartphone Market Revenue (US$ Mn) Forecast, RAM Size, 2016 - 2026
Table 58: Europe Smartphone Market Volume (Mn Units) Forecast, By RAM Size, 2016 - 2026
Table 59: Europe Smartphone Market Revenue (US$ Mn) Forecast, Country, 2016 - 2026
Table 60: Europe Smartphone Market Volume (Mn Units) Forecast, By Country, 2016 - 2026
Table 61: Germany Smartphone Market Revenue (US$ Mn) Forecast, By Operating System, 2016 - 2026
Table 62: Germany Smartphone Market Volume (Mn Units) Forecast, By Operating System, 2016 - 2026
Table 63: Germany Smartphone Market Revenue (US$ Mn) Forecast, Distribution Channel, 2016 - 2026
Table 64: Germany Smartphone Market Volume (Mn Units) Forecast, By Distribution Channel, 2016 - 2026
Table 65: Germany Smartphone Market Revenue (US$ Mn) Forecast, Price Range, 2016 - 2026
Table 66: Germany Smartphone Market Volume (Mn Units) Forecast, By Price Range, 2016 - 2026
Table 67: Germany Smartphone Market Revenue (US$ Mn) Forecast, Size, 2016 - 2026
Table 68: Germany Smartphone Market Volume (Mn Units) Forecast, By Size, 2016 - 2026
Table 69: Germany Smartphone Market Revenue (US$ Mn) Forecast, RAM Size, 2016 - 2026
Table 70: Germany Smartphone Market Volume (Mn Units) Forecast, By RAM Size, 2016 - 2026
Table 71: U.K. Smartphone Market Revenue (US$ Mn) Forecast, By Operating System, 2016 - 2026
Table 72: U.K. Smartphone Market Volume (Mn Units) Forecast, By Operating System, 2016 - 2026
Table 73: U.K. Smartphone Market Revenue (US$ Mn) Forecast, Distribution Channel, 2016 - 2026
Table 74: U.K. Smartphone Market Volume (Mn Units) Forecast, By Distribution Channel, 2016 - 2026
Table 75: U.K. Smartphone Market Revenue (US$ Mn) Forecast, Price Range, 2016 - 2026
Table 76: U.K. Smartphone Market Volume (Mn Units) Forecast, By Price Range, 2016 - 2026
Table 77: U.K. Smartphone Market Revenue (US$ Mn) Forecast, Size, 2016 - 2026
Table 78: U.K. Smartphone Market Volume (Mn Units) Forecast, By Size, 2016 - 2026
Table 79: U.K. Smartphone Market Revenue (US$ Mn) Forecast, RAM Size, 2016 - 2026
Table 80: U.K. Smartphone Market Volume (Mn Units) Forecast, By RAM Size, 2016 - 2026
Table 81: France Smartphone Market Revenue (US$ Mn) Forecast, By Operating System, 2016 - 2026
Table 82: France Smartphone Market Volume (Mn Units) Forecast, By Operating System, 2016 - 2026
Table 83: France Smartphone Market Revenue (US$ Mn) Forecast, Distribution Channel, 2016 - 2026
Table 84: France Smartphone Market Volume (Mn Units) Forecast, By Distribution Channel, 2016 - 2026
Table 85: France Smartphone Market Revenue (US$ Mn) Forecast, Price Range, 2016 - 2026
Table 86: France Smartphone Market Volume (Mn Units) Forecast, By Price Range, 2016 - 2026
Table 87: France Smartphone Market Revenue (US$ Mn) Forecast, Size, 2016 - 2026
Table 88: France Smartphone Market Volume (Mn Units) Forecast, By Size, 2016 - 2026
Table 89: France Smartphone Market Revenue (US$ Mn) Forecast, RAM Size, 2016 - 2026
Table 90: France Smartphone Market Volume (Mn Units) Forecast, By RAM Size, 2016 - 2026
Table 91: Italy Smartphone Market Revenue (US$ Mn) Forecast, By Operating System, 2016 - 2026
Table 92: Italy Smartphone Market Volume (Mn Units) Forecast, By Operating System, 2016 - 2026
Table 93: Italy Smartphone Market Revenue (US$ Mn) Forecast, Distribution Channel, 2016 - 2026
Table 94: Italy Smartphone Market Volume (Mn Units) Forecast, By Distribution Channel, 2016 - 2026
Table 95: Italy Smartphone Market Revenue (US$ Mn) Forecast, Price Range, 2016 - 2026
Table 96: Italy Smartphone Market Volume (Mn Units) Forecast, By Price Range, 2016 - 2026
Table 97: Italy Smartphone Market Revenue (US$ Mn) Forecast, Size, 2016 - 2026
Table 98: Italy Smartphone Market Volume (Mn Units) Forecast, By Size, 2016 - 2026
Table 99: Italy Smartphone Market Revenue (US$ Mn) Forecast, RAM Size, 2016 - 2026
Table 100: Italy Smartphone Market Volume (Mn Units) Forecast, By RAM Size, 2016 - 2026
Table 101: Spain Smartphone Market Revenue (US$ Mn) Forecast, By Operating System, 2016 - 2026
Table 102: Spain Smartphone Market Volume (Mn Units) Forecast, By Operating System, 2016 - 2026
Table 103: Spain Smartphone Market Revenue (US$ Mn) Forecast, Distribution Channel, 2016 - 2026
Table 104: Spain Smartphone Market Volume (Mn Units) Forecast, By Distribution Channel, 2016 - 2026
Table 105: Spain Smartphone Market Revenue (US$ Mn) Forecast, Price Range, 2016 - 2026
Table 106: Spain Smartphone Market Volume (Mn Units) Forecast, By Price Range, 2016 - 2026
Table 107: Spain Smartphone Market Revenue (US$ Mn) Forecast, Size, 2016 - 2026
Table 108: Spain Smartphone Market Volume (Mn Units) Forecast, By Size, 2016 - 2026
Table 109: Spain Smartphone Market Revenue (US$ Mn) Forecast, RAM Size, 2016 - 2026
Table 110: Spain Smartphone Market Volume (Mn Units) Forecast, By RAM Size, 2016 - 2026
Table 111: Asia Pacific Smartphone Market Revenue (US$ Mn) Forecast, By Operating System, 2016 - 2026
Table 112: Asia Pacific Smartphone Market Volume (Mn Units) Forecast, By Operating System, 2016 - 2026
Table 113: Asia Pacific Smartphone Market Revenue (US$ Mn) Forecast, Distribution Channel, 2016 - 2026
Table 114: Asia Pacific Smartphone Market Volume (Mn Units) Forecast, By Distribution Channel, 2016 - 2026
Table 115: Asia Pacific Smartphone Market Revenue (US$ Mn) Forecast, Price Range, 2016 - 2026
Table 116: Asia Pacific Smartphone Market Volume (Mn Units) Forecast, By Price Range, 2016 - 2026
Table 117: Asia Pacific Smartphone Market Revenue (US$ Mn) Forecast, Size, 2016 - 2026
Table 118: Asia Pacific Smartphone Market Volume (Mn Units) Forecast, By Size, 2016 - 2026
Table 119: Asia Pacific Smartphone Market Revenue (US$ Mn) Forecast, RAM Size, 2016 - 2026
Table 119: Asia Pacific Smartphone Market Volume (Mn Units) Forecast, By RAM Size, 2016 - 2026
Table 120: Asia Pacific Smartphone Market Revenue (US$ Mn) Forecast, Country, 2016 - 2026
Table 121: Asia Pacific Smartphone Market Volume (Mn Units) Forecast, By Country, 2016 - 2026
Table 122: China Smartphone Market Revenue (US$ Mn) Forecast, By Operating System, 2016 - 2026
Table 123: China Smartphone Market Volume (Mn Units) Forecast, By Operating System, 2016 - 2026
Table 124: China Smartphone Market Revenue (US$ Mn) Forecast, Distribution Channel, 2016 - 2026
Table 125: China Smartphone Market Volume (Mn Units) Forecast, By Distribution Channel, 2016 - 2026
Table 126: China Smartphone Market Revenue (US$ Mn) Forecast, Price Range, 2016 - 2026
Table 127: China Smartphone Market Volume (Mn Units) Forecast, By Price Range, 2016 - 2026
Table 128: China Smartphone Market Revenue (US$ Mn) Forecast, Size, 2016 - 2026
Table 129: China Smartphone Market Volume (Mn Units) Forecast, By Size, 2016 - 2026
Table 130: China Smartphone Market Revenue (US$ Mn) Forecast, RAM Size, 2016 - 2026
Table 131: China Smartphone Market Volume (Mn Units) Forecast, By RAM Size, 2016 - 2026
Table 131: India Smartphone Market Revenue (US$ Mn) Forecast, By Operating System, 2016 - 2026
Table 133: India Smartphone Market Volume (Mn Units) Forecast, By Operating System, 2016 - 2026
Table 134: India Smartphone Market Revenue (US$ Mn) Forecast, Distribution Channel, 2016 - 2026
Table 135: India Smartphone Market Volume (Mn Units) Forecast, By Distribution Channel, 2016 - 2026
Table 136: India Smartphone Market Revenue (US$ Mn) Forecast, Price Range, 2016 - 2026
Table 137: India Smartphone Market Volume (Mn Units) Forecast, By Price Range, 2016 - 2026
Table 138: India Smartphone Market Revenue (US$ Mn) Forecast, Size, 2016 - 2026
Table 139: India Smartphone Market Volume (Mn Units) Forecast, By Size, 2016 - 2026
Table 140: India Smartphone Market Revenue (US$ Mn) Forecast, RAM Size, 2016 - 2026
Table 141: India Smartphone Market Volume (Mn Units) Forecast, By RAM Size, 2016 - 2026
Table 142: Japan Smartphone Market Revenue (US$ Mn) Forecast, By Operating System, 2016 - 2026
Table 143: Japan Smartphone Market Volume (Mn Units) Forecast, By Operating System, 2016 - 2026
Table 144: Japan Smartphone Market Revenue (US$ Mn) Forecast, Distribution Channel, 2016 - 2026
Table 145: Japan Smartphone Market Volume (Mn Units) Forecast, By Distribution Channel, 2016 - 2026
Table 146: Japan Smartphone Market Revenue (US$ Mn) Forecast, Price Range, 2016 - 2026
Table 147: Japan Smartphone Market Volume (Mn Units) Forecast, By Price Range, 2016 - 2026
Table 148: Japan Smartphone Market Revenue (US$ Mn) Forecast, Size, 2016 - 2026
Table 149: Japan Smartphone Market Volume (Mn Units) Forecast, By Size, 2016 - 2026
Table 150: Japan Smartphone Market Revenue (US$ Mn) Forecast, RAM Size, 2016 - 2026
Table 151: Japan Smartphone Market Volume (Mn Units) Forecast, By RAM Size, 2016 - 2026
Table 152: South Korea Smartphone Market Revenue (US$ Mn) Forecast, By Operating System, 2016 - 2026
Table 153: South Korea Smartphone Market Volume (Mn Units) Forecast, By Operating System, 2016 - 2026
Table 154: South Korea Smartphone Market Revenue (US$ Mn) Forecast, Distribution Channel, 2016 - 2026
Table 155: South Korea Smartphone Market Volume (Mn Units) Forecast, By Distribution Channel, 2016 - 2026
Table 156: South Korea Smartphone Market Revenue (US$ Mn) Forecast, Price Range, 2016 - 2026
Table 157: South Korea Smartphone Market Volume (Mn Units) Forecast, By Price Range, 2016 - 2026
Table 158: South Korea Smartphone Market Revenue (US$ Mn) Forecast, Size, 2016 - 2026
Table 159: South Korea Smartphone Market Volume (Mn Units) Forecast, By Size, 2016 - 2026
Table 160: South Korea Smartphone Market Revenue (US$ Mn) Forecast, RAM Size, 2016 - 2026
Table 161: South Korea Smartphone Market Volume (Mn Units) Forecast, By RAM Size, 2016 - 2026
Table 162: Australia Smartphone Market Revenue (US$ Mn) Forecast, By Operating System, 2016 - 2026
Table 163: Australia Smartphone Market Volume (Mn Units) Forecast, By Operating System, 2016 - 2026
Table 164: Australia Smartphone Market Revenue (US$ Mn) Forecast, Distribution Channel, 2016 - 2026
Table 165: Australia Smartphone Market Volume (Mn Units) Forecast, By Distribution Channel, 2016 - 2026
Table 166: Australia Smartphone Market Revenue (US$ Mn) Forecast, Price Range, 2016 - 2026
Table 167: Australia Smartphone Market Volume (Mn Units) Forecast, By Price Range, 2016 - 2026
Table 168: Australia Smartphone Market Revenue (US$ Mn) Forecast, Size, 2016 - 2026
Table 169: Australia Smartphone Market Volume (Mn Units) Forecast, By Size, 2016 - 2026
Table 170: Australia Smartphone Market Revenue (US$ Mn) Forecast, RAM Size, 2016 - 2026
Table 171: Australia Smartphone Market Volume (Mn Units) Forecast, By RAM Size, 2016 - 2026
Table 172: Middle East and Africa Smartphone Market Revenue (US$ Mn) Forecast, By Operating System, 2016 - 2026
Table 173: Middle East and Africa Smartphone Market Volume (Mn Units) Forecast, By Operating System, 2016 - 2026
Table 174: Middle East and Africa Smartphone Market Revenue (US$ Mn) Forecast, Distribution Channel, 2016 - 2026
Table 175: Middle East and Africa Smartphone Market Volume (Mn Units) Forecast, By Distribution Channel, 2016 - 2026
Table 176: Middle East and Africa Smartphone Market Revenue (US$ Mn) Forecast, Price Range, 2016 - 2026
Table 177: Middle East and Africa Smartphone Market Volume (Mn Units) Forecast, By Price Range, 2016 - 2026
Table 178: Middle East and Africa Smartphone Market Revenue (US$ Mn) Forecast, Size, 2016 - 2026
Table 179: Middle East and Africa Smartphone Market Volume (Mn Units) Forecast, By Size, 2016 - 2026
Table 180: Middle East and Africa Smartphone Market Revenue (US$ Mn) Forecast, RAM Size, 2016 - 2026
Table 181: Middle East and Africa Smartphone Market Revenue (US$ Mn) Forecast, Country, 2016 - 2026
Table 182: Middle East and Africa Smartphone Market Volume (Mn Units) Forecast, By Country, 2016 - 2026
Table 183: GCC Countries Smartphone Market Revenue (US$ Mn) Forecast, By Operating System, 2016 - 2026
Table 184: GCC Countries Smartphone Market Volume (Mn Units) Forecast, By Operating System, 2016 - 2026
Table 185: GCC Countries Smartphone Market Revenue (US$ Mn) Forecast, Distribution Channel, 2016 - 2026
Table 186: GCC Countries Smartphone Market Volume (Mn Units) Forecast, By Distribution Channel, 2016 - 2026
Table 187: GCC Countries Smartphone Market Revenue (US$ Mn) Forecast, Price Range, 2016 - 2026
Table 188: GCC Countries Smartphone Market Volume (Mn Units) Forecast, By Price Range, 2016 - 2026
Table 189: GCC Countries Smartphone Market Revenue (US$ Mn) Forecast, Size, 2016 - 2026
Table 190: GCC Countries Smartphone Market Volume (Mn Units) Forecast, By Size, 2016 - 2026
Table 191: GCC Countries Smartphone Market Revenue (US$ Mn) Forecast, RAM Size, 2016 - 2026
Table 192: GCC Countries Smartphone Market Volume (Mn Units) Forecast, By RAM Size, 2016 - 2026
Table 193: South Africa Smartphone Market Revenue (US$ Mn) Forecast, By Operating System, 2016 - 2026
Table 194: South Africa Smartphone Market Volume (Mn Units) Forecast, By Operating System, 2016 - 2026
Table 195: South Africa Smartphone Market Revenue (US$ Mn) Forecast, Distribution Channel, 2016 - 2026
Table 196: South Africa Smartphone Market Volume (Mn Units) Forecast, By Distribution Channel, 2016 - 2026
Table 197: South Africa Smartphone Market Revenue (US$ Mn) Forecast, Price Range, 2016 - 2026
Table 198: South Africa Smartphone Market Volume (Mn Units) Forecast, By Price Range, 2016 - 2026
Table 199: South Africa Smartphone Market Revenue (US$ Mn) Forecast, Size, 2016 - 2026
Table 200: South Africa Smartphone Market Volume (Mn Units) Forecast, By Size, 2016 - 2026
Table 201: South Africa Smartphone Market Revenue (US$ Mn) Forecast, RAM Size, 2016 - 2026
Table 202: South Africa Smartphone Market Volume (Mn Units) Forecast, By RAM Size, 2016 - 2026
Table 203: South America Smartphone Market Revenue (US$ Mn) Forecast, By Operating System, 2016 - 2026
Table 204: South America Smartphone Market Volume (Mn Units) Forecast, By Operating System, 2016 - 2026
Table 205: South America Smartphone Market Revenue (US$ Mn) Forecast, Distribution Channel, 2016 - 2026
Table 206: South America Smartphone Market Volume (Mn Units) Forecast, By Distribution Channel, 2016 - 2026
Table 207: South America Smartphone Market Revenue (US$ Mn) Forecast, Price Range, 2016 - 2026
Table 208: South America Smartphone Market Volume (Mn Units) Forecast, By Price Range, 2016 - 2026
Table 209: South America Smartphone Market Revenue (US$ Mn) Forecast, Size, 2016 - 2026
Table 210: South America Smartphone Market Volume (Mn Units) Forecast, By Size, 2016 - 2026
Table 211: South America Smartphone Market Revenue (US$ Mn) Forecast, RAM Size, 2016 - 2026
Table 212: South America Smartphone Market Volume (Mn Units) Forecast, By RAM Size, 2016 - 2026
Table 213: South America Smartphone Market Revenue (US$ Mn) Forecast, Country, 2016 - 2026
Table 214: South America Smartphone Market Volume (Mn Units) Forecast, By Country, 2016 - 2026
Table 215: Brazil Smartphone Market Revenue (US$ Mn) Forecast, By Operating System, 2016 - 2026
Table 216: Brazil Smartphone Market Volume (Mn Units) Forecast, By Operating System, 2016 - 2026
Table 217: Brazil Smartphone Market Revenue (US$ Mn) Forecast, Distribution Channel, 2016 - 2026
Table 218: Brazil Smartphone Market Volume (Mn Units) Forecast, By Distribution Channel, 2016 - 2026
Table 219: Brazil Smartphone Market Revenue (US$ Mn) Forecast, Price Range, 2016 - 2026
Table 220: Brazil Smartphone Market Volume (Mn Units) Forecast, By Price Range, 2016 - 2026
Table 221: Brazil Smartphone Market Revenue (US$ Mn) Forecast, Size, 2016 - 2026
Table 222: Brazil Smartphone Market Volume (Mn Units) Forecast, By Size, 2016 - 2026
Table 223: Brazil Smartphone Market Revenue (US$ Mn) Forecast, RAM Size, 2016 - 2026
Table 224: Brazil Smartphone Market Volume (Mn Units) Forecast, By RAM Size, 2016 - 2026
Table 225: Argentina Smartphone Market Revenue (US$ Mn) Forecast, By Operating System, 2016 - 2026
Table 226: Argentina Smartphone Market Volume (Mn Units) Forecast, By Operating System, 2016 - 2026
Table 227: Argentina Smartphone Market Revenue (US$ Mn) Forecast, Distribution Channel, 2016 - 2026
Table 228: Argentina Smartphone Market Volume (Mn Units) Forecast, By Distribution Channel, 2016 - 2026
Table 229: Argentina Smartphone Market Revenue (US$ Mn) Forecast, Price Range, 2016 - 2026
Table 230: Argentina Smartphone Market Volume (Mn Units) Forecast, By Price Range, 2016 - 2026
Table 231: Argentina Smartphone Market Revenue (US$ Mn) Forecast, Size, 2016 - 2026
Table 232: Argentina Smartphone Market Volume (Mn Units) Forecast, By Size, 2016 - 2026
Table 233: Argentina Smartphone Market Revenue (US$ Mn) Forecast, RAM Size, 2016 - 2026
Table 234: Argentina Smartphone Market Volume (Mn Units) Forecast, By RAM Size, 2016 - 2026
Table 235: Competition Matrix
Table 236: Smartphone Vendor Market Share, By Key Smartphone Manufacturer (2017)
List of Figures
Figure 1: Inflation Rate, Consumer Prices (annual %)
Figure 2: Market Revenue Analysis, 2012-2017 (US$ Mn)
Figure 3: Historic growth trends, 2012-2017
Figure 4: Market Volume Analysis, 2012-2017 (Mn Units)
Figure 5: Historic growth trends, 2012-2017
Figure 6: Global Smartphone Market Size (US$ Mn) Forecast, 2016–2026
Figure 7: Global Smartphone Market Revenue Y-O-Y (%) 2017 - 2026
Figure 8: Global Smartphone Market Value Share Analysis and Forecast, By Operating System (2026)
Figure 9: Global Smartphone Market Volume Share Analysis and Forecast, By Operating System (2026)
Figure 10: Global Smartphone Market Value Share Analysis and Forecast, By Operating System (2018)
Figure 11: Global Smartphone Market Volume Share Analysis and Forecast, By Operating System (2018)
Figure 12: Global Smartphone Market Attractiveness Analysis, By Operating System
Figure 13: Global Smartphone Market Value Share Analysis and Forecast, By Distribution Channel (2026)
Figure 14 Global Smartphone Market Volume Share Analysis and Forecast, By Distribution Channel (2026)
Figure 15: Global Smartphone Market Value Share Analysis and Forecast, By Distribution Channel (2018)
Figure 16: Global Smartphone Market Volume Share Analysis and Forecast, By Distribution Channel (2018)
Figure 17: Global Smartphone Market Attractiveness Analysis, By Distribution Channel
Figure 18: Global Smartphone Market Value Share Analysis and Forecast, By Price Range (2026)
Figure 19: Global Smartphone Market Volume Share Analysis and Forecast, By Price Range (2026)
Figure 20: Global Smartphone Market Value Share Analysis and Forecast, By Price Range (2018)
Figure 21: Global Smartphone Market Volume Share Analysis and Forecast, By Price Range (2018)
Figure 22: Global Smartphone Market Attractiveness Analysis, By Price Range
Figure 23: Global Smartphone Market Value Share Analysis and Forecast, By Size (2026)
Figure 24: Global Smartphone Market Volume Share Analysis and Forecast, By Size (2026)
Figure 25: Global Smartphone Market Value Share Analysis and Forecast, By Size (2018)
Figure 26: Global Smartphone Market Volume Share Analysis and Forecast, By Size (2018)
Figure 27: Global Smartphone Market Attractiveness Analysis, By Size
Figure 28: Global Smartphone Market Value Share Analysis and Forecast, By RAM Size (2026)
Figure 29: Global Smartphone Market Volume Share Analysis and Forecast, By RAM Size (2026)
Figure 30: Global Smartphone Market Value Share Analysis and Forecast, By RAM Size (2018)
Figure 31: Global Smartphone Market Volume Share Analysis and Forecast, By RAM Size (2018)
Figure 32: Global Smartphone Market Attractiveness Analysis, By RAM Size
Figure 33: Global Smartphone Market Value Share Analysis, By Region, 2018 and 2026
Figure 34: Global Smartphone Market Volume Share Analysis, By Region, 2018 and 2026
Figure 35: Global Smartphone Market Attractiveness Analysis, By Region
Figure 36: North America Smartphone Market Revenue (US$ Mn) and Y-o-Y Forecast, 2018– 2026
Figure 37: North America Smartphone Market Opportunity Growth Analysis (US$ Mn), 2016 – 2026
Figure 38: North America Smartphone Market Value Share Analysis and Forecast, By Operating System (2026)
Figure 39: North America Smartphone Market Volume Share Analysis and Forecast, By Operating System (2026)
Figure 40: North America Smartphone Market Value Share Analysis and Forecast, By Operating System (2018)
Figure 41: North America Smartphone Market Volume Share Analysis and Forecast, By Operating System (2018)
Figure 42: North America Smartphone Market Value Share Analysis and Forecast, By Distribution Channel (2026)
Figure 43: North America Smartphone Market Volume Share Analysis and Forecast, By Distribution Channel (2026)
Figure 44: North America Smartphone Market Value Share Analysis and Forecast, By Distribution Channel (2018)
Figure 45: North America Smartphone Market Volume Share Analysis and Forecast, By Distribution Channel (2018)
Figure 46: North America Smartphone Market Value Share Analysis and Forecast, By Price Range (2026)
Figure 47: North America Smartphone Market Volume Share Analysis and Forecast, By Price Range (2026)
Figure 48: North America Smartphone Market Value Share Analysis and Forecast, By Price Range (2018)
Figure 49: North America Smartphone Market Volume Share Analysis and Forecast, By Price Range (2018)
Figure 50: North America Smartphone Market Value Share Analysis and Forecast, By Size (2026)
Figure 51: North America Smartphone Market Volume Share Analysis and Forecast, By Size (2026)
Figure 52: North America Smartphone Market Value Share Analysis and Forecast, By Size (2018)
Figure 53: North America Smartphone Market Volume Share Analysis and Forecast, By Size (2018)
Figure 54: North America Smartphone Market Value Share Analysis and Forecast, By RAM Size (2026)
Figure 55: North America Smartphone Market Volume Share Analysis and Forecast, By RAM Size (2026)
Figure 56: North America Smartphone Market Value Share Analysis and Forecast, By RAM Size (2018)
Figure 57: North America Smartphone Market Volume Share Analysis and Forecast, By RAM Size (2018)
Figure 58: North America Smartphone Market Value Share Analysis and Forecast, By Country (2026)
Figure 59: North America Smartphone Market Volume Share Analysis and Forecast, By Country (2026)
Figure 59: North America Smartphone Market Value Share Analysis and Forecast, By Country (2018)
Figure 60 North America Smartphone Market Volume Share Analysis and Forecast, By Country (2018)
Figure 61: North America Smartphone Market Attractiveness Analysis, By Operating System
Figure 62: North America Smartphone Market Attractiveness Analysis, By Distribution Channel
Figure 63: North America Smartphone Market Attractiveness Analysis, By Price Range
Figure 65: North America Smartphone Market Attractiveness Analysis, By Size
Figure 66: North America Smartphone Market Attractiveness Analysis, By RAM Size
Figure 67: North America Smartphone Market Attractiveness Analysis, By Country
Figure 68: U.S. Smartphone Market Revenue (US$ Mn) and Y-o-Y Forecast, 2018– 2026
Figure 69: U.S. Smartphone Market Opportunity Growth Analysis (US$ Mn), 2016 – 2026
Figure 70: U.S. Smartphone Market Volume (Mn Units) and Y-o-Y Forecast, 2018– 2026
Figure 71: U.S. Smartphone Market Opportunity Growth Analysis Volume (Mn Units), 2016 – 2026
Figure 72: U.S. Smartphone Market Value Share Analysis and Forecast, By Operating System (2026)
Figure 73: U.S. Smartphone Market Volume Share Analysis and Forecast, By Operating System (2026)
Figure 74: U.S Smartphone Market Value Share Analysis and Forecast, By Operating System (2018)
Figure 75: U.S Smartphone Market Volume Share Analysis and Forecast, By Operating System (2018)
Figure 76: U.S Smartphone Market Value Share Analysis and Forecast, By Distribution Channel (2026)
Figure 77: U.S Smartphone Market Volume Share Analysis and Forecast, By Distribution Channel (2026)
Figure 78: U.S Smartphone Market Value Share Analysis and Forecast, By Distribution Channel (2018)
Figure 79: U.S. Smartphone Market Volume Share Analysis and Forecast, By Distribution Channel (2018)
Figure 80: U.S. Smartphone Market Value Share Analysis and Forecast, By Price Range (2026)
Figure 81: U.S. Smartphone Market Volume Share Analysis and Forecast, By Price Range (2026)
Figure 82: U.S. Smartphone Market Value Share Analysis and Forecast, By Price Range (2018)
Figure 83: U.S. Smartphone Market Volume Share Analysis and Forecast, By Price Range (2018)
Figure 84: U.S. Smartphone Market Value Share Analysis and Forecast, By Size (2026)
Figure 85: U.S. Smartphone Market Volume Share Analysis and Forecast, By Size (2026)
Figure 86: U.S. Smartphone Market Value Share Analysis and Forecast, By Size (2018)
Figure 87: U.S. Smartphone Market Volume Share Analysis and Forecast, By Size (2018)
Figure 88: U.S. Smartphone Market Value Share Analysis and Forecast, By RAM Size (2026)
Figure 89: U.S. Smartphone Market Volume Share Analysis and Forecast, By RAM Size (2026)
Figure 90: U.S. Smartphone Market Value Share Analysis and Forecast, By RAM Size (2018)
Figure 91: U.S. Smartphone Market Volume Share Analysis and Forecast, By RAM Size (2018)
Figure 92: Canada Smartphone Market Revenue (US$ Mn) and Y-o-Y Forecast, 2018– 2026
Figure 93: Canada Smartphone Market Opportunity Growth Analysis (US$ Mn), 2016 – 2026
Figure 94: Canada Smartphone Market Volume (Mn Units) and Y-o-Y Forecast, 2018– 2026
Figure 95: Canada Smartphone Market Opportunity Growth Analysis Volume (Mn Units), 2016 – 2026
Figure 96: Canada Smartphone Market Value Share Analysis and Forecast, By Operating System (2018)
Figure 97: Canada Smartphone Market Value Share Analysis and Forecast, By Operating System (2026)
Figure 98: Canada Smartphone Market Volume Share Analysis and Forecast, By Operating System (2018)
Figure 99: Canada Smartphone Market Volume Share Analysis and Forecast, By Operating System (2026)
Figure 100: Canada Smartphone Market Value Share Analysis and Forecast, By Distribution Channel (2018)
Figure 101: Canada Smartphone Market Value Share Analysis and Forecast, By Distribution Channel (2026)
Figure 102: Canada Smartphone Market Volume Share Analysis and Forecast, By Distribution Channel (2018)
Figure 103: Canada Smartphone Market Volume Share Analysis and Forecast, By Distribution Channel (2026)
Figure 104: Canada Smartphone Market Value Share Analysis and Forecast, By Price Range (2018)
Figure 105: Canada Smartphone Market Value Share Analysis and Forecast, By Price Range (2026)
Figure 106: Canada Smartphone Market Volume Share Analysis and Forecast, By Price Range (2018)
Figure 107: Canada Smartphone Market Volume Share Analysis and Forecast, By Price Range (2026)
Figure 108: Canada Smartphone Market Value Share Analysis and Forecast, By Size (2018)
Figure 109: Canada Smartphone Market Value Share Analysis and Forecast, By Size (2026)
Figure 110: Canada Smartphone Market Volume Share Analysis and Forecast, By Size (2018)
Figure 111: Canada Smartphone Market Volume Share Analysis and Forecast, By Size (2026)
Figure 112: Canada Smartphone Market Value Share Analysis and Forecast, By RAM Size (2018)
Figure 113: Canada Smartphone Market Value Share Analysis and Forecast, By RAM Size (2026)
Figure 114: Canada Smartphone Market Volume Share Analysis and Forecast, By RAM Size (2018)
Figure 115: Canada Smartphone Market Volume Share Analysis and Forecast, By RAM Size (2026)
Figure 116: Europe Smartphone Market Revenue (US$ Mn) and Y-o-Y Forecast, 2018– 2026
Figure 117: Europe Smartphone Market Opportunity Growth Analysis (US$ Mn), 2016 – 2026
Figure 118: Europe Smartphone Market Volume (Mn Units) and Y-o-Y Forecast, 2018– 2026
Figure 119: Europe Smartphone Market Opportunity Growth Analysis Volume (Mn Units), 2016 – 2026
Figure 120: Europe Smartphone Market Value Share Analysis and Forecast, By Operating System (2018)
Figure 121: Europe Smartphone Market Value Share Analysis and Forecast, By Operating System (2026)
Figure 122: Europe Smartphone Market Volume Share Analysis and Forecast, By Operating System (2018)
Figure 123: Europe Smartphone Market Volume Share Analysis and Forecast, By Operating System (2026)
Figure 124: Europe Smartphone Market Value Share Analysis and Forecast, By Distribution Channel (2026)
Figure 125: Europe Smartphone Market Volume Share Analysis and Forecast, By Distribution Channel (2018)
Figure 126: Europe Smartphone Market Volume Share Analysis and Forecast, By Distribution Channel (2026)
Figure 127: Europe Smartphone Market Value Share Analysis and Forecast, By Price Range (2018)
Figure 128: Europe Smartphone Market Value Share Analysis and Forecast, By Price Range (2026)
Figure 129: Europe Smartphone Market Volume Share Analysis and Forecast, By Price Range (2018)
Figure 130: Europe Smartphone Market Volume Share Analysis and Forecast, By Price Range (2026)
Figure 131: Europe Smartphone Market Value Share Analysis and Forecast, By Size (2018)
Figure 132: Europe Smartphone Market Value Share Analysis and Forecast, By Size (2026)
Figure 133: Europe Smartphone Market Volume Share Analysis and Forecast, By Size (2018)
Figure 134: Europe Smartphone Market Volume Share Analysis and Forecast, By Size (2026)
Figure 135: Europe Smartphone Market Value Share Analysis and Forecast, By RAM Size (2018)
Figure 136: Europe Smartphone Market Value Share Analysis and Forecast, By RAM Size (2026)
Figure 137: Europe Smartphone Market Volume Share Analysis and Forecast, By RAM Size (2018)
Figure 138: Europe Smartphone Market Volume Share Analysis and Forecast, By RAM Size (2026)
Figure 139: Europe Smartphone Market Value Share Analysis and Forecast, By Country (2018)
Figure 140: Europe Smartphone Market Value Share Analysis and Forecast, By Country (2026)
Figure 141: Europe Smartphone Market Volume Share Analysis and Forecast, By Country (2018)
Figure 142: Europe Smartphone Market Volume Share Analysis and Forecast, By Country (2026)
Figure 143: Europe Smartphone Market Attractiveness Analysis, By Operating System
Figure 144: Europe Smartphone Market Attractiveness Analysis, By Distribution Channel
Figure 145: Europe Smartphone Market Attractiveness Analysis, By Price Range
Figure 146: Europe Smartphone Market Attractiveness Analysis, By Size
Figure 147: Europe Smartphone Market Attractiveness Analysis, By RAM Size
Figure 148: Europe Smartphone Market Attractiveness Analysis, By Country
Figure 149: Germany Smartphone Market Revenue (US$ Mn) and Y-o-Y Forecast, 2018– 2026
Figure 150: Germany Smartphone Market Opportunity Growth Analysis (US$ Mn), 2016 – 2026
Figure 151: Germany Smartphone Market Volume (Mn Units) and Y-o-Y Forecast, 2018– 2026
Figure 152: Germany Smartphone Market Opportunity Growth Analysis Volume (Mn Units), 2016 – 2026
Figure 153: Germany Smartphone Market Value Share Analysis and Forecast, By Operating System (2018)
Figure 154: Germany Smartphone Market Value Share Analysis and Forecast, By Operating System (2026)
Figure 155: Germany Smartphone Market Volume Share Analysis and Forecast, By Operating System (2018)
Figure 156: Germany Smartphone Market Volume Share Analysis and Forecast, By Operating System (2026)
Figure 157: Germany Smartphone Market Value Share Analysis and Forecast, By Distribution Channel (2018)
Figure 158: Germany Smartphone Market Value Share Analysis and Forecast, By Distribution Channel (2026)
Figure 159: Germany Smartphone Market Volume Share Analysis and Forecast, By Distribution Channel (2018)
Figure 160: Germany Smartphone Market Volume Share Analysis and Forecast, By Distribution Channel (2026)
Figure 161: Germany Smartphone Market Value Share Analysis and Forecast, By Price Range (2018)
Figure 162: Germany Smartphone Market Value Share Analysis and Forecast, By Price Range (2026)
Figure 163: Germany Smartphone Market Volume Share Analysis and Forecast, By Price Range (2018)
Figure 164: Germany Smartphone Market Volume Share Analysis and Forecast, By Price Range (2026)
Figure 165: Germany Smartphone Market Value Share Analysis and Forecast, By Size (2018)
Figure 166: Germany Smartphone Market Value Share Analysis and Forecast, By Size (2026)
Figure 167: Germany Smartphone Market Volume Share Analysis and Forecast, By Size (2018)
Figure 168: Germany Smartphone Market Volume Share Analysis and Forecast, By Size (2026)
Figure 169: Germany Smartphone Market Value Share Analysis and Forecast, By RAM Size (2018)
Figure 170: Germany Smartphone Market Value Share Analysis and Forecast, By RAM Size (2026)
Figure 171: Germany Smartphone Market Volume Share Analysis and Forecast, By RAM Size (2018)
Figure 172: Germany Smartphone Market Volume Share Analysis and Forecast, By RAM Size (2026)
Figure 173: U.K. Smartphone Market Revenue (US$ Mn) and Y-o-Y Forecast, 2018– 2026
Figure 174: U.K. Smartphone Market Opportunity Growth Analysis (US$ Mn), 2016 – 2026
Figure 175: U.K. Smartphone Market Volume (Mn Units) and Y-o-Y Forecast, 2018– 2026
Figure 176: U.K. Smartphone Market Opportunity Growth Analysis Volume (Mn Units), 2016 – 2026
Figure 177: U.K. Smartphone Market Value Share Analysis and Forecast, By Operating System (2018)
Figure 178: U.K. Smartphone Market Value Share Analysis and Forecast, By Operating System (2026)
Figure 179: U.K. Smartphone Market Volume Share Analysis and Forecast, By Operating System (2018)
Figure 180: U.K. Smartphone Market Volume Share Analysis and Forecast, By Operating System (2026)
Figure 181: U.K. Smartphone Market Value Share Analysis and Forecast, By Distribution Channel (2018)
Figure 182: U.K. Smartphone Market Value Share Analysis and Forecast, By Distribution Channel (2026)
Figure 183: U.K. Smartphone Market Volume Share Analysis and Forecast, By Distribution Channel (2018)
Figure 184: U.K. Smartphone Market Volume Share Analysis and Forecast, By Distribution Channel (2026)
Figure 185: U.K. Smartphone Market Value Share Analysis and Forecast, By Price Range (2018)
Figure 186: U.K. Smartphone Market Value Share Analysis and Forecast, By Price Range (2026)
Figure 187: U.K. Smartphone Market Volume Share Analysis and Forecast, By Price Range (2018)
Figure 188: U.K. Smartphone Market Volume Share Analysis and Forecast, By Price Range (2026)
Figure 189: U.K. Smartphone Market Value Share Analysis and Forecast, By Size (2018)
Figure 190: U.K. Smartphone Market Value Share Analysis and Forecast, By Size (2026)
Figure 191: U.K. Smartphone Market Volume Share Analysis and Forecast, By Size (2018)
Figure 192: U.K. Smartphone Market Volume Share Analysis and Forecast, By Size (2026)
Figure 193: U.K. Smartphone Market Value Share Analysis and Forecast, By RAM Size (2018)
Figure 194: U.K. Smartphone Market Value Share Analysis and Forecast, By RAM Size (2026)
Figure 195: U.K. Smartphone Market Volume Share Analysis and Forecast, By RAM Size (2018)
Figure 196: U.K. Smartphone Market Volume Share Analysis and Forecast, By RAM Size (2026)
Figure 197: France Smartphone Market Revenue (US$ Mn) and Y-o-Y Forecast, 2018– 2026
Figure 198: France Smartphone Market Opportunity Growth Analysis (US$ Mn), 2016 – 2026
Figure 199: France Smartphone Market Volume (Mn Units) and Y-o-Y Forecast, 2018– 2026
Figure 200: France Smartphone Market Opportunity Growth Analysis Volume (Mn Units), 2016 – 2026
Figure 201: France Smartphone Market Value Share Analysis and Forecast, By Operating System (2018)
Figure 202: France Smartphone Market Value Share Analysis and Forecast, By Operating System (2026)
Figure 203: France Smartphone Market Volume Share Analysis and Forecast, By Operating System (2018)
Figure 204: France Smartphone Market Volume Share Analysis and Forecast, By Operating System (2026)
Figure 205: France Smartphone Market Value Share Analysis and Forecast, By Distribution Channel (2018)
Figure 206: France Smartphone Market Value Share Analysis and Forecast, By Distribution Channel (2026)
Figure 207: France Smartphone Market Volume Share Analysis and Forecast, By Distribution Channel (2018)
Figure 208: France Smartphone Market Volume Share Analysis and Forecast, By Distribution Channel (2026)
Figure 209: France Smartphone Market Value Share Analysis and Forecast, By Price Range (2018)
Figure 210: France Smartphone Market Value Share Analysis and Forecast, By Price Range (2026)
Figure 211: France Smartphone Market Volume Share Analysis and Forecast, By Price Range (2018)
Figure 212: France Smartphone Market Volume Share Analysis and Forecast, By Price Range (2026)
Figure 213: France Smartphone Market Value Share Analysis and Forecast, By Size (2018)
Figure 214: France Smartphone Market Value Share Analysis and Forecast, By Size (2026)
Figure 215: France Smartphone Market Volume Share Analysis and Forecast, By Size (2018)
Figure 216: France Smartphone Market Volume Share Analysis and Forecast, By Size (2026)
Figure 217: France Smartphone Market Value Share Analysis and Forecast, By RAM Size (2018)
Figure 218: France Smartphone Market Value Share Analysis and Forecast, By RAM Size (2026)
Figure 219: France Smartphone Market Volume Share Analysis and Forecast, By RAM Size (2018)
Figure 220: France Smartphone Market Volume Share Analysis and Forecast, By RAM Size (2026)
Figure 221: Italy Smartphone Market Revenue (US$ Mn) and Y-o-Y Forecast, 2018– 2026
Figure 222: Italy Smartphone Market Opportunity Growth Analysis (US$ Mn), 2016 – 2026
Figure 223: Italy Smartphone Market Volume (Mn Units) and Y-o-Y Forecast, 2018– 2026
Figure 224: Italy Smartphone Market Opportunity Growth Analysis Volume (Mn Units), 2016 – 2026
Figure 225: Italy Smartphone Market Value Share Analysis and Forecast, By Operating System (2018)
Figure 226: Italy Smartphone Market Value Share Analysis and Forecast, By Operating System (2026)
Figure 227: Italy Smartphone Market Volume Share Analysis and Forecast, By Operating System (2018)
Figure 228: Italy Smartphone Market Volume Share Analysis and Forecast, By Operating System (2026)
Figure 229: Italy Smartphone Market Value Share Analysis and Forecast, By Distribution Channel (2018)
Figure 230: Italy Smartphone Market Value Share Analysis and Forecast, By Distribution Channel (2026)
Figure 231: Italy Smartphone Market Volume Share Analysis and Forecast, By Distribution Channel (2018)
Figure 232: Italy Smartphone Market Volume Share Analysis and Forecast, By Distribution Channel (2026)
Figure 233: Italy Smartphone Market Value Share Analysis and Forecast, By Price Range (2018)
Figure 234: Italy Smartphone Market Value Share Analysis and Forecast, By Price Range (2026)
Figure 235: Italy Smartphone Market Volume Share Analysis and Forecast, By Price Range (2018)
Figure 236: Italy Smartphone Market Volume Share Analysis and Forecast, By Price Range (2026)
Figure 237: Italy Smartphone Market Value Share Analysis and Forecast, By Size (2018)
Figure 238: Italy Smartphone Market Value Share Analysis and Forecast, By Size (2026)
Figure 239: Italy Smartphone Market Volume Share Analysis and Forecast, By Size (2018)
Figure 240: Italy Smartphone Market Volume Share Analysis and Forecast, By Size (2026)
Figure 241: Italy Smartphone Market Value Share Analysis and Forecast, By RAM Size (2018)
Figure 242: Italy Smartphone Market Value Share Analysis and Forecast, By RAM Size (2026)
Figure 243: Italy Smartphone Market Volume Share Analysis and Forecast, By RAM Size (2018)
Figure 244: Italy Smartphone Market Volume Share Analysis and Forecast, By RAM Size (2026)
Figure 245: Spain Smartphone Market Revenue (US$ Mn) and Y-o-Y Forecast, 2018– 2026
Figure 246: Spain Smartphone Market Opportunity Growth Analysis (US$ Mn), 2016 – 2026
Figure 247: Spain Smartphone Market Value Share Analysis and Forecast, By Operating System (2018)
Figure 248: Spain Smartphone Market Value Share Analysis and Forecast, By Operating System (2026)
Figure 249: Spain Smartphone Market Volume Share Analysis and Forecast, By Operating System (2018)
Figure 250: Spain Smartphone Market Volume Share Analysis and Forecast, By Operating System (2026)
Figure 251: Spain Smartphone Market Value Share Analysis and Forecast, By Distribution Channel (2018)
Figure 252: Spain Smartphone Market Value Share Analysis and Forecast, By Distribution Channel (2026)
Figure 253: Spain Smartphone Market Volume Share Analysis and Forecast, By Distribution Channel (2018)
Figure 254: Spain Smartphone Market Volume Share Analysis and Forecast, By Distribution Channel (2026)
Figure 255: Spain Smartphone Market Value Share Analysis and Forecast, By Price Range (2018)
Figure 256: Spain Smartphone Market Value Share Analysis and Forecast, By Price Range (2026)
Figure 257: Spain Smartphone Market Volume Share Analysis and Forecast, By Price Range (2018)
Figure 258: Spain Smartphone Market Volume Share Analysis and Forecast, By Price Range (2026)
Figure 259: Spain Smartphone Market Value Share Analysis and Forecast, By Size (2018)
Figure 260: Spain Smartphone Market Value Share Analysis and Forecast, By Size (2026)
Figure 261: Spain Smartphone Market Volume Share Analysis and Forecast, By Size (2018)
Figure 262: Spain Smartphone Market Volume Share Analysis and Forecast, By Size (2026)
Figure 263: Spain Smartphone Market Value Share Analysis and Forecast, By RAM Size (2018)
Figure 264: Spain Smartphone Market Value Share Analysis and Forecast, By RAM Size (2026)
Figure 265: Spain Smartphone Market Volume Share Analysis and Forecast, By RAM Size (2018)
Figure 266: Spain Smartphone Market Volume Share Analysis and Forecast, By RAM Size (2026)
Figure 267: Asia Pacific Smartphone Market Revenue (US$ Mn) and Y-o-Y Forecast, 2018– 2026
Figure 268: Asia Pacific Smartphone Market Opportunity Growth Analysis (US$ Mn), 2016 – 2026
Figure 269: Asia Pacific Smartphone Market Volume (Mn Units) and Y-o-Y Forecast, 2018– 2026
Figure 270: Asia Pacific Smartphone Market Opportunity Growth Analysis Volume (Mn Units), 2016 – 2026
Figure 271: Asia Pacific Smartphone Market Value Share Analysis and Forecast, By Operating System (2018)
Figure 272: Asia Pacific Smartphone Market Value Share Analysis and Forecast, By Operating System (2026)
Figure 273: Asia Pacific Smartphone Market Volume Share Analysis and Forecast, By Operating System (2018)
Figure 274: Asia Pacific Smartphone Market Volume Share Analysis and Forecast, By Operating System (2026)
Figure 275: Asia Pacific Smartphone Market Value Share Analysis and Forecast, By Distribution Channel (2018)
Figure 276: Asia Pacific Smartphone Market Value Share Analysis and Forecast, By Distribution Channel (2026)
Figure 277: Asia Pacific Smartphone Market Volume Share Analysis and Forecast, By Distribution Channel (2018)
Figure 278: Asia Pacific Smartphone Market Volume Share Analysis and Forecast, By Distribution Channel (2026)
Figure 279: Asia Pacific Smartphone Market Value Share Analysis and Forecast, By Price Range (2018)
Figure 280: Asia Pacific Smartphone Market Value Share Analysis and Forecast, By Price Range (2026)
Figure 281: Asia Pacific Smartphone Market Volume Share Analysis and Forecast, By Price Range (2018)
Figure 282: Asia Pacific Smartphone Market Volume Share Analysis and Forecast, By Price Range (2026)
Figure 283: Asia Pacific Smartphone Market Value Share Analysis and Forecast, By Size (2018)
Figure 284: Asia Pacific Smartphone Market Value Share Analysis and Forecast, By Size (2026)
Figure 285: Asia Pacific Smartphone Market Volume Share Analysis and Forecast, By Size (2018)
Figure 286: Asia Pacific Smartphone Market Volume Share Analysis and Forecast, By Size (2026)
Figure 287: Asia Pacific Smartphone Market Value Share Analysis and Forecast, By RAM Size (2018)
Figure 288: Asia Pacific Smartphone Market Value Share Analysis and Forecast, By RAM Size (2026)
Figure 289: Asia Pacific Smartphone Market Volume Share Analysis and Forecast, By RAM Size (2018)
Figure 290: Asia Pacific Smartphone Market Volume Share Analysis and Forecast, By RAM Size (2026)
Figure 291: Asia Pacific Smartphone Market Value Share Analysis and Forecast, By Country (2018)
Figure 292: Asia Pacific Smartphone Market Value Share Analysis and Forecast, By Country (2026)
Figure 293: Asia Pacific Smartphone Market Volume Share Analysis and Forecast, By Country (2018)
Figure 294: Asia Pacific Smartphone Market Volume Share Analysis and Forecast, By Country (2026)
Figure 295: Asia Pacific Smartphone Market Attractiveness Analysis, By Operating System
Figure 296: Asia Pacific Smartphone Market Attractiveness Analysis, By Distribution Channel
Figure 297: Asia Pacific Smartphone Market Attractiveness Analysis, By Price Range
Figure 298: Asia Pacific Smartphone Market Attractiveness Analysis, By Size
Figure 299: Asia Pacific Smartphone Market Attractiveness Analysis, By RAM Size
Figure 300: Asia Pacific Smartphone Market Attractiveness Analysis, By Country
Figure 301: China Smartphone Market Revenue (US$ Mn) and Y-o-Y Forecast, 2018– 2026
Figure 302: China Smartphone Market Opportunity Growth Analysis (US$ Mn), 2016 – 2026
Figure 303: China Smartphone Market Volume (Mn Units) and Y-o-Y Forecast, 2018– 2026
Figure 304: China Smartphone Market Opportunity Growth Analysis Volume (Mn Units), 2016 – 2026
Figure 305: China Smartphone Market Value Share Analysis and Forecast, By Operating System (2018)
Figure 306: China Smartphone Market Value Share Analysis and Forecast, By Operating System (2026)
Figure 307: China Smartphone Market Volume Share Analysis and Forecast, By Operating System (2018)
Figure 308: China Smartphone Market Volume Share Analysis and Forecast, By Operating System (2026)
Figure 309: China Smartphone Market Value Share Analysis and Forecast, By Distribution Channel (2018)
Figure 310: China Smartphone Market Value Share Analysis and Forecast, By Distribution Channel (2026)
Figure 311: China Smartphone Market Volume Share Analysis and Forecast, By Distribution Channel (2018)
Figure 312: China Smartphone Market Volume Share Analysis and Forecast, By Distribution Channel (2026)
Figure 313: China Smartphone Market Value Share Analysis and Forecast, By Price Range (2018)
Figure 314: China Smartphone Market Value Share Analysis and Forecast, By Price Range (2026)
Figure 315: China Smartphone Market Volume Share Analysis and Forecast, By Price Range (2018)
Figure 316: China Smartphone Market Volume Share Analysis and Forecast, By Price Range (2026)
Figure 317: China Smartphone Market Value Share Analysis and Forecast, By Size (2018)
Figure 318: China Smartphone Market Value Share Analysis and Forecast, By Size (2026)
Figure 319: China Smartphone Market Volume Share Analysis and Forecast, By Size (2018)
Figure 320: China Smartphone Market Volume Share Analysis and Forecast, By Size (2026)
Figure 321: China Smartphone Market Value Share Analysis and Forecast, By RAM Size (2018)
Figure 322: China Smartphone Market Value Share Analysis and Forecast, By RAM Size (2026)
Figure 323: China Smartphone Market Volume Share Analysis and Forecast, By RAM Size (2018)
Figure 324: China Smartphone Market Volume Share Analysis and Forecast, By RAM Size (2026)
Figure 325: India Smartphone Market Revenue (US$ Mn) and Y-o-Y Forecast, 2018– 2026
Figure 326: India Smartphone Market Opportunity Growth Analysis (US$ Mn), 2016 – 2026
Figure 327: India Smartphone Market Volume (Mn Units) and Y-o-Y Forecast, 2018– 2026
Figure 328: India Smartphone Market Opportunity Growth Analysis Volume (Mn Units), 2016 – 2026
Figure 329: India Smartphone Market Value Share Analysis and Forecast, By Operating System (2018)
Figure 330: India Smartphone Market Value Share Analysis and Forecast, By Operating System (2026)
Figure 331: India Smartphone Market Volume Share Analysis and Forecast, By Operating System (2018)
Figure 332: India Smartphone Market Volume Share Analysis and Forecast, By Operating System (2026)
Figure 333: India Smartphone Market Value Share Analysis and Forecast, By Distribution Channel (2018)
Figure 334: India Smartphone Market Value Share Analysis and Forecast, By Distribution Channel (2026)
Figure 335: India Smartphone Market Volume Share Analysis and Forecast, By Distribution Channel (2018)
Figure 336: India Smartphone Market Volume Share Analysis and Forecast, By Distribution Channel (2026)
Figure 337: India Smartphone Market Value Share Analysis and Forecast, By Price Range (2018)
Figure 338: India Smartphone Market Value Share Analysis and Forecast, By Price Range (2026)
Figure 339: India Smartphone Market Volume Share Analysis and Forecast, By Price Range (2018)
Figure 340: India Smartphone Market Volume Share Analysis and Forecast, By Price Range (2026)
Figure 341: India Smartphone Market Value Share Analysis and Forecast, By Size (2018)
Figure 342: India Smartphone Market Value Share Analysis and Forecast, By Size (2026)
Figure 343: India Smartphone Market Volume Share Analysis and Forecast, By Size (2018)
Figure 344: India Smartphone Market Volume Share Analysis and Forecast, By Size (2026)
Figure 345: India Smartphone Market Value Share Analysis and Forecast, By RAM Size (2018)
Figure 346: India Smartphone Market Value Share Analysis and Forecast, By RAM Size (2026)
Figure 347: India Smartphone Market Volume Share Analysis and Forecast, By RAM Size (2018)
Figure 348: India Smartphone Market Volume Share Analysis and Forecast, By RAM Size (2026)
Figure 349: Japan Smartphone Market Revenue (US$ Mn) and Y-o-Y Forecast, 2018– 2026
Figure 350: Japan Smartphone Market Opportunity Growth Analysis (US$ Mn), 2016 – 2026
Figure 351: Japan Smartphone Market Volume (Mn Units) and Y-o-Y Forecast, 2018– 2026
Figure 352: Japan Smartphone Market Opportunity Growth Analysis Volume (Mn Units), 2016 – 2026
Figure 353: Japan Smartphone Market Value Share Analysis and Forecast, By Operating System (2018)
Figure 354: Japan Smartphone Market Value Share Analysis and Forecast, By Operating System (2026)
Figure 355: Japan Smartphone Market Volume Share Analysis and Forecast, By Operating System (2018)
Figure 356: Japan Smartphone Market Volume Share Analysis and Forecast, By Operating System (2026)
Figure 357: Japan Smartphone Market Value Share Analysis and Forecast, By Distribution Channel (2018)
Figure 358: Japan Smartphone Market Value Share Analysis and Forecast, By Distribution Channel (2026)
Figure 359: Japan Smartphone Market Volume Share Analysis and Forecast, By Distribution Channel (2018)
Figure 360: Japan Smartphone Market Volume Share Analysis and Forecast, By Distribution Channel (2026)
Figure 361: Japan Smartphone Market Value Share Analysis and Forecast, By Price Range (2018)
Figure 362: Japan Smartphone Market Value Share Analysis and Forecast, By Price Range (2026)
Figure 363: Japan Smartphone Market Volume Share Analysis and Forecast, By Price Range (2018)
Figure 364: Japan Smartphone Market Volume Share Analysis and Forecast, By Price Range (2026)
Figure 365: Japan Smartphone Market Value Share Analysis and Forecast, By Size (2018)
Figure 366: Japan Smartphone Market Value Share Analysis and Forecast, By Size (2026)
Figure 367: Japan Smartphone Market Volume Share Analysis and Forecast, By Size (2018)
Figure 368: Japan Smartphone Market Volume Share Analysis and Forecast, By Size (2026)
Figure 369: Japan Smartphone Market Value Share Analysis and Forecast, By RAM Size (2018)
Figure 370: Japan Smartphone Market Value Share Analysis and Forecast, By RAM Size (2026)
Figure 371: Japan Smartphone Market Volume Share Analysis and Forecast, By RAM Size (2018)
Figure 372: Japan Smartphone Market Volume Share Analysis and Forecast, By RAM Size (2026)
Figure 373: South Korea Smartphone Market Revenue (US$ Mn) and Y-o-Y Forecast, 2018– 2026
Figure 374: South Korea Smartphone Market Opportunity Growth Analysis (US$ Mn), 2016 – 2026
Figure 375: South Korea Smartphone Market Volume (Mn Units) and Y-o-Y Forecast, 2018– 2026
Figure 376: South Korea Smartphone Market Opportunity Growth Analysis Volume (Mn Units), 2016 – 2026
Figure 377: South Korea Smartphone Market Value Share Analysis and Forecast, By Operating System (2018)
Figure 378: South Korea Smartphone Market Value Share Analysis and Forecast, By Operating System (2026)
Figure 379: South Korea Smartphone Market Volume Share Analysis and Forecast, By Operating System (2018)
Figure 380: South Korea Smartphone Market Volume Share Analysis and Forecast, By Operating System (2026)
Figure 381: South Korea Smartphone Market Value Share Analysis and Forecast, By Distribution Channel (2018)
Figure 382: South Korea Smartphone Market Value Share Analysis and Forecast, By Distribution Channel (2026)
Figure 383: South Korea Smartphone Market Volume Share Analysis and Forecast, By Distribution Channel (2018)
Figure 384: South Korea Smartphone Market Volume Share Analysis and Forecast, By Distribution Channel (2026)
Figure 385: South Korea Smartphone Market Value Share Analysis and Forecast, By Price Range (2018)
Figure 386: South Korea Smartphone Market Value Share Analysis and Forecast, By Price Range (2026)
Figure 387: South Korea Smartphone Market Volume Share Analysis and Forecast, By Price Range (2018)
Figure 388: South Korea Smartphone Market Volume Share Analysis and Forecast, By Price Range (2026)
Figure 389: South Korea Smartphone Market Value Share Analysis and Forecast, By Size (2018)
Figure 390: South Korea Smartphone Market Value Share Analysis and Forecast, By Size (2026)
Figure 391: South Korea Smartphone Market Volume Share Analysis and Forecast, By Size (2018)
Figure 392: South Korea Smartphone Market Volume Share Analysis and Forecast, By Size (2026)
Figure 393: South Korea Smartphone Market Value Share Analysis and Forecast, By RAM Size (2018)
Figure 394: South Korea Smartphone Market Value Share Analysis and Forecast, By RAM Size (2026)
Figure 395: South Korea Smartphone Market Volume Share Analysis and Forecast, By RAM Size (2018)
Figure 396: South Korea Smartphone Market Volume Share Analysis and Forecast, By RAM Size (2026)
Figure 397: Australia Smartphone Market Revenue (US$ Mn) and Y-o-Y Forecast, 2018– 2026
Figure 398: Australia Smartphone Market Opportunity Growth Analysis (US$ Mn), 2016 – 2026
Figure 399: Australia Smartphone Market Volume (Mn Units) and Y-o-Y Forecast, 2018– 2026
Figure 400: Australia Smartphone Market Opportunity Growth Analysis Volume (Mn Units), 2016 – 2026
Figure 401: Australia Smartphone Market Value Share Analysis and Forecast, By Operating System (2018)
Figure 402: Australia Smartphone Market Value Share Analysis and Forecast, By Operating System (2026)
Figure 403: Australia Smartphone Market Volume Share Analysis and Forecast, By Operating System (2018)
Figure 404: Australia Smartphone Market Volume Share Analysis and Forecast, By Operating System (2026)
Figure 405: Australia Smartphone Market Value Share Analysis and Forecast, By Distribution Channel (2018)
Figure 406: Australia Smartphone Market Value Share Analysis and Forecast, By Distribution Channel (2026)
Figure 407: Australia Smartphone Market Volume Share Analysis and Forecast, By Distribution Channel (2018)
Figure 408: Australia Smartphone Market Volume Share Analysis and Forecast, By Distribution Channel (2026)
Figure 409: Australia Smartphone Market Value Share Analysis and Forecast, By Price Range (2018)
Figure 410: Australia Smartphone Market Value Share Analysis and Forecast, By Price Range (2026)
Figure 411: Australia Smartphone Market Volume Share Analysis and Forecast, By Price Range (2018)
Figure 412: Australia Smartphone Market Volume Share Analysis and Forecast, By Price Range (2026)
Figure 413: Australia Smartphone Market Value Share Analysis and Forecast, By Size (2018)
Figure 414: Australia Smartphone Market Value Share Analysis and Forecast, By Size (2026)
Figure 415: Australia Smartphone Market Volume Share Analysis and Forecast, By Size (2018)
Figure 416: Australia Smartphone Market Volume Share Analysis and Forecast, By Size (2026)
Figure 417: Australia Smartphone Market Value Share Analysis and Forecast, By RAM Size (2018)
Figure 418: Australia Smartphone Market Value Share Analysis and Forecast, By RAM Size (2026)
Figure 419: Australia Smartphone Market Volume Share Analysis and Forecast, By RAM Size (2018)
Figure 420: Australia Smartphone Market Volume Share Analysis and Forecast, By RAM Size (2026)
Figure 421: Middle East and Africa Smartphone Market Revenue (US$ Mn) and Y-o-Y Forecast, 2018– 2026
Figure 422: Middle East and Africa Smartphone Market Opportunity Growth Analysis (US$ Mn), 2016 – 2026
Figure 423: Middle East and Africa Smartphone Market Volume (Mn Units) and Y-o-Y Forecast, 2018– 2026
Figure 424: Middle East and Africa Smartphone Market Opportunity Growth Analysis Volume (Mn Units), 2016 – 2026
Figure 425: Middle East and Africa Smartphone Market Value Share Analysis and Forecast, By Operating System (2018)
Figure 426: Middle East and Africa Smartphone Market Value Share Analysis and Forecast, By Operating System (2026)
Figure 427: Middle East and Africa Smartphone Market Volume Share Analysis and Forecast, By Operating System (2018)
Figure 428: Middle East and Africa Smartphone Market Volume Share Analysis and Forecast, By Operating System (2026)
Figure 429: Middle East and Africa Smartphone Market Value Share Analysis and Forecast, By Distribution Channel (2018)
Figure 430: Middle East and Africa Smartphone Market Value Share Analysis and Forecast, By Distribution Channel (2026)
Figure 431: Middle East and Africa Smartphone Market Volume Share Analysis and Forecast, By Distribution Channel (2018)
Figure 432: Middle East and Africa Smartphone Market Volume Share Analysis and Forecast, By Distribution Channel (2026)
Figure 433: Middle East and Africa Smartphone Market Value Share Analysis and Forecast, By Price Range (2018)
Figure 434: Middle East and Africa Smartphone Market Value Share Analysis and Forecast, By Price Range (2026)
Figure 435: Middle East and Africa Smartphone Market Volume Share Analysis and Forecast, By Price Range (2018)
Figure 436: Middle East and Africa Smartphone Market Volume Share Analysis and Forecast, By Price Range (2026)
Figure 437: Middle East and Africa Smartphone Market Value Share Analysis and Forecast, By Size (2018)
Figure 438: Middle East and Africa Smartphone Market Value Share Analysis and Forecast, By Size (2026)
Figure 439: Middle East and Africa Smartphone Market Volume Share Analysis and Forecast, By Size (2026)
Figure 440: Middle East and Africa Smartphone Market Value Share Analysis and Forecast, By RAM Size (2018)
Figure 441: Middle East and Africa Smartphone Market Value Share Analysis and Forecast, By RAM Size (2026)
Figure 442: Middle East and Africa Smartphone Market Volume Share Analysis and Forecast, By RAM Size (2018)
Figure 443: Middle East and Africa Smartphone Market Volume Share Analysis and Forecast, By RAM Size (2026)
Figure 444: Middle East and Africa Smartphone Market Value Share Analysis and Forecast, By Country (2018)
Figure 445: Middle East and Africa Smartphone Market Value Share Analysis and Forecast, By Country (2026)
Figure 446: Middle East and Africa Smartphone Market Volume Share Analysis and Forecast, By Country (2018)
Figure 447: Middle East and Africa Smartphone Market Volume Share Analysis and Forecast, By Country (2026)
Figure 448: Middle East and Africa Smartphone Market Attractiveness Analysis, By Operating System
Figure 449: Middle East and Africa Smartphone Market Attractiveness Analysis, By Distribution Channel
Figure 450: Middle East and Africa Smartphone Market Attractiveness Analysis, By Price Range
Figure 451: Middle East and Africa Smartphone Market Attractiveness Analysis, By Size
Figure 452: Middle East and Africa Smartphone Market Attractiveness Analysis, By RAM Size
Figure 453: Middle East and Africa Smartphone Market Attractiveness Analysis, By Country
Figure 454: GCC Countries Smartphone Market Revenue (US$ Mn) and Y-o-Y Forecast, 2018– 2026
Figure 455: GCC Countries Smartphone Market Opportunity Growth Analysis (US$ Mn), 2016 – 2026
Figure 456: GCC Countries Smartphone Market Volume (Mn Units) and Y-o-Y Forecast, 2018– 2026
Figure 457: GCC Countries Smartphone Market Opportunity Growth Analysis Volume (Mn Units), 2016 – 2026
Figure 458: GCC Countries Smartphone Market Value Share Analysis and Forecast, By Operating System (2018)
Figure 460: GCC Countries Smartphone Market Volume Share Analysis and Forecast, By Operating System (2018)
Figure 461: GCC Countries Smartphone Market Volume Share Analysis and Forecast, By Operating System (2026)
Figure 462: GCC Countries Smartphone Market Value Share Analysis and Forecast, By Distribution Channel (2018)
Figure 463: GCC Countries Smartphone Market Value Share Analysis and Forecast, By Distribution Channel (2026)
Figure 464: GCC Countries Smartphone Market Volume Share Analysis and Forecast, By Distribution Channel (2018)
Figure 465: GCC Countries Smartphone Market Volume Share Analysis and Forecast, By Distribution Channel (2026)
Figure 466: GCC Countries Smartphone Market Value Share Analysis and Forecast, By Price Range (2018)
Figure 467: GCC Countries Smartphone Market Value Share Analysis and Forecast, By Price Range (2026)
Figure 468: GCC Countries Smartphone Market Volume Share Analysis and Forecast, By Price Range (2018)
Figure 469: GCC Countries Smartphone Market Volume Share Analysis and Forecast, By Price Range (2026)
Figure 470: GCC Countries Smartphone Market Value Share Analysis and Forecast, By Size (2018)
Figure 471: GCC Countries Smartphone Market Value Share Analysis and Forecast, By Size (2026)
Figure 472: GCC Countries Smartphone Market Volume Share Analysis and Forecast, By Size (2018)
Figure 473: GCC Countries Smartphone Market Volume Share Analysis and Forecast, By Size (2026)
Figure 474: GCC Countries Smartphone Market Value Share Analysis and Forecast, By RAM Size (2018)
Figure 475: GCC Countries Smartphone Market Value Share Analysis and Forecast, By RAM Size (2026)
Figure 476: GCC Countries Smartphone Market Volume Share Analysis and Forecast, By RAM Size (2018)
Figure 477: GCC Countries Smartphone Market Volume Share Analysis and Forecast, By RAM Size (2026)
Figure 478: South Africa Smartphone Market Revenue (US$ Mn) and Y-o-Y Forecast, 2018– 2026
Figure 479: South Africa Smartphone Market Opportunity Growth Analysis (US$ Mn), 2016 – 2026
Figure 480: South Africa Smartphone Market Volume (Mn Units) and Y-o-Y Forecast, 2018– 2026
Figure 481: South Africa Smartphone Market Opportunity Growth Analysis Volume (Mn Units), 2016 – 2026
Figure 482: South Africa Smartphone Market Value Share Analysis and Forecast, By Operating System (2018)
Figure 483: South Africa Smartphone Market Value Share Analysis and Forecast, By Operating System (2026)
Figure 484: South Africa Smartphone Market Volume Share Analysis and Forecast, By Operating System (2018)
Figure 485: South Africa Smartphone Market Volume Share Analysis and Forecast, By Operating System (2026)
Figure 486: South Africa Smartphone Market Value Share Analysis and Forecast, By Distribution Channel (2018)
Figure 487: South Africa Smartphone Market Value Share Analysis and Forecast, By Distribution Channel (2026)
Figure 488: South Africa Smartphone Market Volume Share Analysis and Forecast, By Distribution Channel (2018)
Figure 489: South Africa Smartphone Market Volume Share Analysis and Forecast, By Distribution Channel (2026)
Figure 490: South Africa Smartphone Market Value Share Analysis and Forecast, By Price Range (2018)
Figure 491: South Africa Smartphone Market Value Share Analysis and Forecast, By Price Range (2026)
Figure 492: South Africa Smartphone Market Volume Share Analysis and Forecast, By Price Range (2018)
Figure 493: South Africa Smartphone Market Volume Share Analysis and Forecast, By Price Range (2026)
Figure 494: Africa Smartphone Market Value Share Analysis and Forecast, By Size (2018)
Figure 495: South Africa Smartphone Market Value Share Analysis and Forecast, By Size (2026)
Figure 496: South Africa Smartphone Market Volume Share Analysis and Forecast, By Size (2018)
Figure 497: South Africa Smartphone Market Volume Share Analysis and Forecast, By Size (2026)
Figure 498: South Africa Smartphone Market Value Share Analysis and Forecast, By RAM Size (2018)
Figure 499: South Africa Smartphone Market Value Share Analysis and Forecast, By RAM Size (2026)
Figure 500: South Africa Smartphone Market Volume Share Analysis and Forecast, By RAM Size (2018)
Figure 501: South Africa Smartphone Market Volume Share Analysis and Forecast, By RAM Size (2026)
Figure 502: South America Smartphone Market Revenue (US$ Mn) and Y-o-Y Forecast, 2018– 2026
Figure 503: South America Smartphone Market Opportunity Growth Analysis (US$ Mn), 2016 – 2026
Figure 504: South America Smartphone Market Volume (Mn Units) and Y-o-Y Forecast, 2018– 2026
Figure 505: South America Smartphone Market Opportunity Growth Analysis Volume (Mn Units), 2016 – 2026
Figure 506: South America Smartphone Market Value Share Analysis and Forecast, By Operating System (2018)
Figure 507: South America Smartphone Market Value Share Analysis and Forecast, By Operating System (2026)
Figure 508: South America Smartphone Market Volume Share Analysis and Forecast, By Operating System (2018)
Figure 509: South America Smartphone Market Volume Share Analysis and Forecast, By Operating System (2026)
Figure 510: South America Smartphone Market Value Share Analysis and Forecast, By Distribution Channel (2018)
Figure 511: South America Smartphone Market Value Share Analysis and Forecast, By Distribution Channel (2026)
Figure 512: South America Smartphone Market Volume Share Analysis and Forecast, By Distribution Channel (2018)
Figure 513: South America Smartphone Market Volume Share Analysis and Forecast, By Distribution Channel (2026)
Figure 514: South America Smartphone Market Value Share Analysis and Forecast, By Price Range (2018)
Figure 515: South America Smartphone Market Value Share Analysis and Forecast, By Price Range (2026)
Figure 516: South America Smartphone Market Volume Share Analysis and Forecast, By Price Range (2018)
Figure 517: South America Smartphone Market Volume Share Analysis and Forecast, By Price Range (2026)
Figure 518: South America Smartphone Market Value Share Analysis and Forecast, By Size (2018)
Figure 519: South America Smartphone Market Value Share Analysis and Forecast, By Size (2026)
Figure 520: South America Smartphone Market Volume Share Analysis and Forecast, By Size (2018)
Figure 521: South America Smartphone Market Volume Share Analysis and Forecast, By Size (2026)
Figure 523: South America Smartphone Market Value Share Analysis and Forecast, By RAM Size (2018)
Figure 524: South America Smartphone Market Value Share Analysis and Forecast, By RAM Size (2026)
Figure 525: South America Smartphone Market Volume Share Analysis and Forecast, By RAM Size (2018)
Figure 526: South America Smartphone Market Volume Share Analysis and Forecast, By RAM Size (2026)
Figure 527: South America Smartphone Market Value Share Analysis and Forecast, By Country (2018)
Figure 528: South America Smartphone Market Value Share Analysis and Forecast, By Country (2026)
Figure 529: South America Smartphone Market Volume Share Analysis and Forecast, By Country (2018)
Figure 530: South America Smartphone Market Volume Share Analysis and Forecast, By Country (2026)
Figure 531: South America Smartphone Market Attractiveness Analysis, By Operating System
Figure 532: South America Smartphone Market Attractiveness Analysis, By Distribution Channel
Figure 533: South America Smartphone Market Attractiveness Analysis, By Price Range
Figure 534: South America Smartphone Market Attractiveness Analysis, By Size
Figure 535 South America Smartphone Market Attractiveness Analysis, By RAM Size
Figure 536: South America Smartphone Market Attractiveness Analysis, By Country
Figure 537: Brazil Smartphone Market Revenue (US$ Mn) and Y-o-Y Forecast, 2018– 2026
Figure 538: Brazil Smartphone Market Opportunity Growth Analysis (US$ Mn), 2016 – 2026
Figure 539: Brazil Smartphone Market Volume (Mn Units) and Y-o-Y Forecast, 2018– 2026
Figure 540: Brazil Smartphone Market Opportunity Growth Analysis Volume (Mn Units), 2016 – 2026
Figure 541: Brazil Smartphone Market Value Share Analysis and Forecast, By Operating System (2018)
Figure 542: Brazil Smartphone Market Value Share Analysis and Forecast, By Operating System (2026)
Figure 543: Brazil Smartphone Market Volume Share Analysis and Forecast, By Operating System (2018)
Figure 544: Brazil Smartphone Market Volume Share Analysis and Forecast, By Operating System (2026)
Figure 545: Brazil Smartphone Market Value Share Analysis and Forecast, By Distribution Channel (2018)
Figure 546: Brazil Smartphone Market Value Share Analysis and Forecast, By Distribution Channel (2026)
Figure 547: Brazil Smartphone Market Volume Share Analysis and Forecast, By Distribution Channel (2018)
Figure 548: Brazil Smartphone Market Volume Share Analysis and Forecast, By Distribution Channel (2026)
Figure 549: Brazil Smartphone Market Value Share Analysis and Forecast, By Price Range (2018)
Figure 550: Brazil Smartphone Market Value Share Analysis and Forecast, By Price Range (2026)
Figure 551: Brazil Smartphone Market Volume Share Analysis and Forecast, By Price Range (2018)
Figure 552: Brazil Smartphone Market Volume Share Analysis and Forecast, By Price Range (2026)
Figure 553: Brazil Smartphone Market Value Share Analysis and Forecast, By Size (2018)
Figure 554: Brazil Smartphone Market Value Share Analysis and Forecast, By Size (2026)
Figure 555: Brazil Smartphone Market Volume Share Analysis and Forecast, By Size (2018)
Figure 556: Brazil Smartphone Market Volume Share Analysis and Forecast, By Size (2026)
Figure 557: Brazil Smartphone Market Value Share Analysis and Forecast, By RAM Size (2018)
Figure 558: Brazil Smartphone Market Value Share Analysis and Forecast, By RAM Size (2026)
Figure 559: Brazil Smartphone Market Volume Share Analysis and Forecast, By RAM Size (2018)
Figure 560: Brazil Smartphone Market Volume Share Analysis and Forecast, By RAM Size (2026)
Figure 561: Argentina Smartphone Market Revenue (US$ Mn) and Y-o-Y Forecast, 2018– 2026
Figure 562: Argentina Smartphone Market Opportunity Growth Analysis (US$ Mn), 2016 – 2026
Figure 563: Argentina Smartphone Market Volume (Mn Units) and Y-o-Y Forecast, 2018– 2026
Figure 564: Argentina Smartphone Market Opportunity Growth Analysis Volume (Mn Units), 2016 – 2026
Figure 565: Argentina Smartphone Market Value Share Analysis and Forecast, By Operating System (2026)
Figure 566: Argentina Smartphone Market Volume Share Analysis and Forecast, By Operating System (2018)
Figure 567: Argentina Smartphone Market Value Share Analysis and Forecast, By Operating System (2018)
Figure 568: Argentina Smartphone Market Value Share Analysis and Forecast, By Distribution Channel (2018)
Figure 569: Argentina Smartphone Market Value Share Analysis and Forecast, By Distribution Channel (2026)
Figure 570: Argentina Smartphone Market Volume Share Analysis and Forecast, By Distribution Channel (2018)
Figure 571: Argentina Smartphone Market Volume Share Analysis and Forecast, By Distribution Channel (2026)
Figure 572: Argentina Smartphone Market Value Share Analysis and Forecast, By Price Range (2018)
Figure 573: Argentina Smartphone Market Value Share Analysis and Forecast, By Price Range (2026)
Figure 574: Argentina Smartphone Market Volume Share Analysis and Forecast, By Price Range (2018)
Figure 575: Argentina Smartphone Market Volume Share Analysis and Forecast, By Price Range (2026)
Figure 576: Argentina Smartphone Market Value Share Analysis and Forecast, By Size (2018)
Figure 577: Argentina Smartphone Market Value Share Analysis and Forecast, By Size (2026)
Figure 578: Argentina Smartphone Market Volume Share Analysis and Forecast, By Size (2018)
Figure 579: Argentina Smartphone Market Volume Share Analysis and Forecast, By Size (2026)
Figure 580: Argentina Smartphone Market Value Share Analysis and Forecast, By RAM Size (2018)
Figure 581: Argentina Smartphone Market Value Share Analysis and Forecast, By RAM Size (2026)
Figure 582: Argentina Smartphone Market Volume Share Analysis and Forecast, By RAM Size (2018)
Figure 583: Argentina Smartphone Market Volume Share Analysis and Forecast, By RAM Size (2026)
Copyright © Transparency Market Research, Inc. All Rights reserved
Trust Online

Smartphone Market