
Reports
Reports
Analysts’ Viewpoint on Dura Substitute Market Scenario
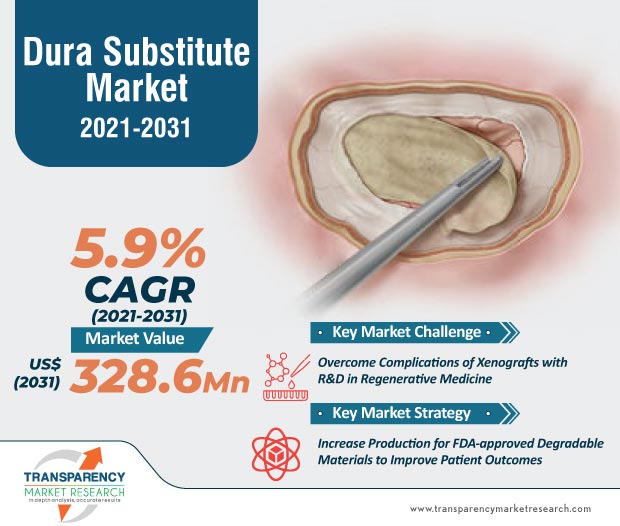
Healthcare providers in the dura substitute market are increasing efforts to improve the quality of life for patients with musculoskeletal disorders amid the ongoing coronavirus pandemic. It has been found that xenografts could cause complications such as graft disintegration, encapsulation, and scarring in patients. Hence, healthcare companies should increase R&D in regenerative medicine to overcome complications of xenografts.
Manufacturers are increasing the production of FDA-approved degradable materials such as biomimetic patch made of poly-L-lactic acid, which holds promising potentials to improve patient outcomes. Researchers have attempted to employ various synthetic polymers to make dural substitutes in order to minimize the spread of diseases caused by the use of allogeneic or xenogeneic materials for increasing clinical effectiveness and reduce costs.
The high prevalence of CNS (Central Nervous System) tumors caused by neurological disorders is emerging as a driver for companies in the dura substitute market. Chiari malformation and spinal cord related neurosurgery procedures are fuelling the demand for dura substitutes.
The rise in the number of neurological treatments, such as duraplasty, is triggering the demand for dura substitutes. It has been found that in 2018, more than half of all dural substitutes were utilized in cranial and spine tumor surgeries.
Healthcare services have been affected due to the ongoing coronavirus pandemic. Elective procedures have been postponed indefinitely in the dura substitute market. Neurosurgeons are being redeployed to treat COVID-19 patients. Recent cases of the Omicron variant are creating concerns for healthcare providers. Since coronavirus affects the brain of individuals, participants in the dura substitute market are improving their healthcare services to enable better patient outcomes.
There is a requirement of compulsory training to the neurosurgeon community to understand the symptoms of the novel infection. As such, participants in the market are increasing the availability of biological grafts & synthetic grafts to ensure continuity in healthcare services. They are increasing efforts to revive R&D activities to gain proficiency in neurosurgical and spinal surgeries.
Complications associated with dura substitute materials are affecting market growth. For instance, autologous tissue is generally preferred for commercialized dura replacements as it reduces the chances of infection and rejection. However, if there is insufficient local replacement tissue of sufficient quality to heal the dural defect, surgeons may avoid autografts. Hence, investments in R&D for materials and government initiatives to promote regenerative medicine hold promising potentials to improve surgical procedures.
Since governments across the world are realizing the importance of regenerative medicine, such trends are translating into revenue opportunities for companies in the dura substitute market.
Government funding for the treatment of various diseases is increasing globally due to the formulation and adoption of supporting legislation & policies. Such trends are contributing to expansion of the regenerative medicine sector in the dura substitute market.
Healthcare companies are drawing significant expenditure in regenerative medicines such as the establishment of centers of excellence, manufacturing infrastructure, and research networks, among others. The NIH (National Institutes of Health) Common Fund facilitated the establishment of the NIH Center for Regenerative Medicine in 2010 with the purpose of serving as a national resource for stem cell sciences. Such developments are helping to accelerate the development of novel medical applications and cell-based therapeutics.
Dural repair materials are transitioning from animal tissue-derived materials to synthetic materials as well as from inert to absorbable properties. Such findings are bringing a significant change in the global dura substitute market.
Biomimetic patch is a new dural repair product that provides functional properties similar to alternate therapies. This patch has a 3 dimensional (3D) non-woven microfiber structure that is both mechanically strong and biocompatible. The animal investigation revealed that the biomimetic patch and commercially synthesized material groups demonstrated new subdural regeneration after 90 days, with low inflammatory response and minimal to no adhesion development at each stage. It has been found that the biomimetic structure and proper rate of degradation of the new absorbable dura replacement can lead significant regeneration of the dura mater.
|
Attribute |
Detail |
|
Market Size Value in 2020 |
US$ 175.6 Mn |
|
Market Forecast Value in 2031 |
US$ 328.6 Mn |
|
Growth Rate (CAGR) |
5.9% |
|
Forecast Period |
2021–2031 |
|
Quantitative Units |
US$ Mn for Value |
|
Market Analysis |
It includes cross segment analysis at global as well as regional level. Moreover, qualitative analysis includes drivers, restraints, opportunities, key trends, and parent industry overview. |
|
Competition Landscape |
|
|
Format |
Electronic (PDF) + Excel |
|
Market Segmentation |
|
|
Regions Covered |
|
|
Countries Covered |
|
|
Companies Profiled |
|
|
Customization Scope |
Available upon request |
|
Pricing |
Available upon request |
Dura substitute market is expected to reach the value of US$ 328.6 Mn by the end of 2031
Dura substitute market is estimated to expand at a CAGR of 5.9% from 2021 to 2031
Dura substitute market is driven by rise in the number of road accidents and sports injuries
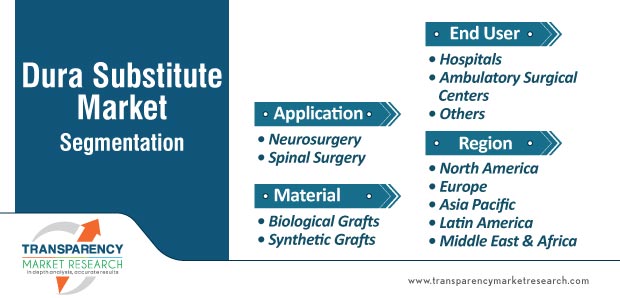
The end-use segments in dura substitute market are hospitals and ambulatory surgical centers
Key players operating in the global market include Cook Medical LLC, B. Braun Melsungen AG, Integra LifeSciences, Cousin Surgery, W. L. Gore & Associates, Inc.
1. Preface
1.1. Market Definition and Scope
1.2. Market Segmentation
1.3. Key Research Objectives
1.4. Research Highlights
2. Assumptions and Research Methodology
3. Executive Summary: Global Dura Substitute Market
4. Market Overview
4.1. Introduction
4.1.1. Material Definition
4.1.2. Industry Evolution / Developments
4.2. Overview
4.3. Market Dynamics
4.3.1. Drivers
4.3.2. Restraints
4.3.3. Opportunities
4.4. Global Dura Substitute Market Analysis and Forecast, 2017–2031
4.4.1. Market Revenue Projections (US$ Mn)
5. Key Insights
5.1. Technological Advancements
5.2. Key Industry Events (mergers, acquisitions, partnerships, collaborations, etc.)
5.3. Pricing Analysis
5.4. Product /Brand Analysis, by Application
5.5. COVID-19 Pandemic Impact on Industry (value chain and short / mid / long term impact)
6. Global Dura Substitute Market Analysis and Forecast, by Material
6.1. Introduction & Definition
6.2. Key Findings / Developments
6.3. Market Value Forecast, by Material, 2017–2031
6.3.1. Biological Grafts
6.3.1.1. Autografts
6.3.1.2. Allografts
6.3.1.3. Xenografts
6.3.1.3.1. Collagen
6.3.1.3.2. Decellularized Pericardium
6.3.1.3.3. Small Intestine Submucosa
6.3.2. Synthetic
6.3.2.1. Polytetrafluoroethylene (PTFE)
6.3.2.2. Others
6.4. Market Attractiveness Analysis, by Material
7. Global Dura Substitute Market Analysis and Forecast, by Application
7.1. Introduction & Definition
7.2. Key Findings / Developments
7.3. Market Value Forecast, by Application, 2017–2031
7.3.1. Neurosurgery
7.3.2. Spinal Surgery
7.4. Market Attractiveness Analysis, by Application
8. Global Dura Substitute Market Analysis and Forecast, by End-user
8.1. Introduction & Definition
8.2. Key Findings / Developments
8.3. Market Value Forecast, by End-user, 2017–2031
8.3.1. Hospitals
8.3.2. Ambulatory Surgical Centers
8.3.3. Others
8.4. Market Attractiveness Analysis, by End-user
9. Global Dura Substitute Market Analysis and Forecast, by Region
9.1. Key Findings
9.2. Market Value Forecast, by Region
9.2.1. North America
9.2.2. Europe
9.2.3. Asia Pacific
9.2.4. Latin America
9.2.5. Middle East & Africa
9.3. Market Attractiveness Analysis, by Region
10. North America Dura Substitute Market Analysis and Forecast
10.1. Introduction
10.1.1. Key Findings
10.2. Market Value Forecast, by Material, 2017–2031
10.2.1. Biological Grafts
10.2.1.1. Autografts
10.2.1.2. Allografts
10.2.1.3. Xenografts
10.2.1.3.1. Collagen
10.2.1.3.2. Decellularized Pericardium
10.2.1.3.3. Small Intestine Submucosa
10.2.2. Synthetic
10.2.2.1. Polytetrafluoroethylene (PTFE)
10.2.2.2. Others
10.3. Market Value Forecast, by Application, 2017–2031
10.3.1. Neurosurgery
10.3.2. Spinal Surgery
10.4. Market Value Forecast, by End-user, 2017–2031
10.4.1. Hospitals
10.4.2. Ambulatory Surgical Centers
10.4.3. Others
10.5. Market Value Forecast, by Country, 2017–2031
10.5.1. U.S.
10.5.2. Canada
10.6. Market Attractiveness Analysis
10.6.1. By Material
10.6.2. By Application
10.6.3. By End-user
10.6.4. By Country
11. U.S Dura Substitute Market Analysis and Forecast
11.1. Introduction
11.1.1. Key Findings
11.2. Market Value Forecast, by Material, 2017–2031
11.2.1. Biological Grafts
11.2.2. Synthetic
11.3. Market Value Forecast, by Application, 2017–2031
11.3.1. Neurosurgery
11.3.2. Spinal Surgery
11.4. Market Attractiveness Analysis
11.4.1. By Material
11.4.2. By Application
12. Canada Dura Substitute Market Analysis and Forecast
12.1. Introduction
12.1.1. Key Findings
12.2. Market Value Forecast, by Material, 2017–2031
12.2.1. Biological Grafts
12.2.2. Synthetic
12.3. Market Value Forecast, by Application, 2017–2031
12.3.1. Neurosurgery
12.3.2. Spinal Surgery
12.4. Market Attractiveness Analysis
12.4.1. By Material
12.4.2. By Application
13. Europe Dura Substitute Market Analysis and Forecast
13.1. Introduction
13.1.1. Key Findings
13.2. Market Value Forecast, by Material, 2017–2031
13.2.1. Biological Grafts
13.2.1.1. Autografts
13.2.1.2. Allografts
13.2.1.3. Xenografts
13.2.1.3.1. Collagen
13.2.1.3.2. Decellularized Pericardium
13.2.1.3.3. Small Intestine Submucosa
13.2.2. Synthetic
13.2.2.1. Polytetrafluoroethylene (PTFE)
13.2.2.2. Others
13.3. Market Value Forecast, by Application, 2017–2031
13.3.1. Neurosurgery
13.3.2. Spinal Surgery
13.4. Market Value Forecast, by End-user, 2017–2031
13.4.1. Hospitals
13.4.2. Ambulatory Surgical Centers
13.4.3. Others
13.5. Market Value Forecast, by Country/Sub-region, 2017–2031
13.5.1. Germany
13.5.2. U.K
13.5.3. France
13.5.4. Italy
13.5.5. Spain
13.5.6. Denmark
13.5.7. Sweden
13.5.8. Finland
13.5.9. Iceland
13.5.10. Norway
13.5.11. Rest of Europe
13.6. Market Attractiveness Analysis
13.6.1. By Material
13.6.2. By Application
13.6.3. By End-user
13.6.4. By Country/Sub-region
14. Germany Dura Substitute Market Analysis and Forecast
14.1. Introduction
14.1.1. Key Findings
14.2. Market Value Forecast, by Material, 2017–2031
14.2.1. Biological Grafts
14.2.2. Synthetic
14.3. Market Value Forecast, by Application, 2017–2031
14.3.1. Neurosurgery
14.3.2. Spinal Surgery
14.4. Market Attractiveness Analysis
14.4.1. By Material
14.4.2. By Application
15. U.K Dura Substitute Market Analysis and Forecast
15.1. Introduction
15.1.1. Key Findings
15.2. Market Value Forecast, by Material, 2017–2031
15.2.1. Biological Grafts
15.2.2. Synthetic
15.3. Market Value Forecast, by Application, 2017–2031
15.3.1. Neurosurgery
15.3.2. Spinal Surgery
15.4. Market Attractiveness Analysis
15.4.1. By Material
15.4.2. By Application
16. France Dura Substitute Market Analysis and Forecast
16.1. Introduction
16.1.1. Key Findings
16.2. Market Value Forecast, by Material, 2017–2031
16.2.1. Biological Grafts
16.2.2. Synthetic
16.3. Market Value Forecast, by Application, 2017–2031
16.3.1. Neurosurgery
16.3.2. Spinal Surgery
16.4. Market Attractiveness Analysis
16.4.1. By Material
16.4.2. By Application
17. Italy Dura Substitute Market Analysis and Forecast
17.1. Introduction
17.1.1. Key Findings
17.2. Market Value Forecast, by Material, 2017–2031
17.2.1. Biological Grafts
17.2.2. Synthetic
17.3. Market Value Forecast, by Application, 2017–2031
17.3.1. Neurosurgery
17.3.2. Spinal Surgery
17.4. Market Attractiveness Analysis
17.4.1. By Material
18. Competition Landscape
18.1. Market Player - Competition Matrix (by tier and size of companies)
18.2. Market Share Analysis, by Company, 2020
18.3. Company Profiles
18.3.1. Cook Medical LLC
18.3.1.1. Company Overview (HQ, Business Segments, Employee Strength)
18.3.1.2. Product Portfolio
18.3.1.3. SWOT Analysis
18.3.1.4. Strategic Overview
18.3.2. B. Braun Melsungen AG
18.3.2.1. Company Overview (HQ, Business Segments, Employee Strength)
18.3.2.2. Product Portfolio
18.3.2.3. SWOT Analysis
18.3.2.4. Strategic Overview
18.3.3. Integra LifeSciences
18.3.3.1. Company Overview (HQ, Business Segments, Employee Strength)
18.3.3.2. Product Portfolio
18.3.3.3. SWOT Analysis
18.3.3.4. Strategic Overview
18.3.4. Cousin Surgery
18.3.4.1. Company Overview (HQ, Business Segments, Employee Strength)
18.3.4.2. Product Portfolio
18.3.4.3. SWOT Analysis
18.3.4.4. Strategic Overview
18.3.5. W. L. Gore & Associates, Inc.
18.3.5.1. Company Overview (HQ, Business Segments, Employee Strength)
18.3.5.2. Product Portfolio
18.3.5.3. SWOT Analysis
18.3.5.4. Strategic Overview
18.3.6. Biosynth Lifesciences
18.3.6.1. Company Overview (HQ, Business Segments, Employee Strength)
18.3.6.2. Product Portfolio
18.3.6.3. SWOT Analysis
18.3.6.4. Strategic Overview
18.3.7. Acera Surgical, Inc.
18.3.7.1. Company Overview (HQ, Business Segments, Employee Strength)
18.3.7.2. Product Portfolio
18.3.7.3. SWOT Analysis
18.3.7.4. Strategic Overview
18.3.8. Medprin
18.3.8.1. Company Overview (HQ, Business Segments, Employee Strength)
18.3.8.2. Product Portfolio
18.3.8.3. SWOT Analysis
18.3.8.4. Strategic Overview
18.3.9. Medtronic
18.3.9.1. Company Overview (HQ, Business Segments, Employee Strength)
18.3.9.2. Product Portfolio
18.3.9.3. SWOT Analysis
18.3.9.4. Strategic Overview
18.3.10. Stryker
18.3.10.1. Company Overview (HQ, Business Segments, Employee Strength)
18.3.10.2. Product Portfolio
18.3.10.3. SWOT Analysis
18.3.10.4. Strategic Overview
18.3.11. DePuy Synthes
18.3.11.1. Company Overview (HQ, Business Segments, Employee Strength)
18.3.11.2. Product Portfolio
18.3.11.3. SWOT Analysis
18.3.11.4. Strategic Overview
18.3.12. Gunze Limited
18.3.12.1. Company Overview (HQ, Business Segments, Employee Strength)
18.3.12.2. Product Portfolio
18.3.12.3. SWOT Analysis
18.3.12.4. Strategic Overview
18.3.13. Baxter
18.3.13.1. Company Overview (HQ, Business Segments, Employee Strength)
18.3.13.2. Product Portfolio
18.3.13.3. SWOT Analysis
18.3.13.4. Strategic Overview
18.3.14. Bennett Health, Inc.
18.3.14.1. Company Overview (HQ, Business Segments, Employee Strength)
18.3.14.2. Product Portfolio
18.3.14.3. SWOT Analysis
18.3.14.4. Strategic Overview
18.3.15. RTI Surgical
18.3.15.1. Company Overview (HQ, Business Segments, Employee Strength)
18.3.15.2. Product Portfolio
18.3.15.3. SWOT Analysis
18.3.15.4. Strategic Overview
18.3.16. Natus Medical Incorporated
18.3.16.1. Company Overview (HQ, Business Segments, Employee Strength)
18.3.16.2. Product Portfolio
18.3.16.3. SWOT Analysis
18.3.16.4. Strategic Overview
List of Tables
Table 01: Global Dura Substitute Market Value (US$ Mn) Forecast, by Material, 2017–2031
Table 02: Global Dura Substitute Market Value (US$ Mn) Forecast, by Biological Grafts, 2017–2031
Table 03: Global Dura Substitute Market Value (US$ Mn) Forecast, by Xenografts, 2017–2031
Table 04: Global Dura Substitute Market Value (US$ Mn) Forecast, by Synthetic, 2017–2031
Table 05: Global Dura Substitute Market Value (US$ Mn) Forecast, by Application, 2017–2031
Table 06: Global Dura Substitute Market Value (US$ Mn) Forecast, by End-user, 2017–2031
Table 07: Global Dura Substitute Market Value (US$ Mn) Forecast, by Region, 2017–2031
Table 08: North America Dura Substitute Market Value (US$ Mn) Forecast, by Country/Sub-region, 2017–2031
Table 09: North America Dura Substitute Market Value (US$ Mn) Forecast, by Material, 2017–2031
Table 10: North America Dura Substitute Market Value (US$ Mn) Forecast, by Biological Grafts, 2017–2031
Table 11: North America Dura Substitute Market Value (US$ Mn) Forecast, by Xenografts, 2017–2031
Table 12: North America Dura Substitute Market Value (US$ Mn) Forecast, by Synthetic, 2017–2031
Table 13: North America Dura Substitute Market Value (US$ Mn) Forecast, by Application, 2017–2031
Table 14: North America Dura Substitute Market Value (US$ Mn) Forecast, by End-user, 2017–2031
Table 15: U.S Dura Substitute Market Value (US$ Mn) Forecast, by Material, 2017–2031
Table 16: U.S Dura Substitute Market Value (US$ Mn) Forecast, by Application, 2017–2031
Table 17: Canada Dura Substitute Market Value (US$ Mn) Forecast, by Material, 2017–2031
Table 18: Canada Dura Substitute Market Value (US$ Mn) Forecast, by Application, 2017–2031
Table 19: Europe Dura Substitute Market Value (US$ Mn) Forecast, by Country/Sub-region, 2017–2031
Table 20: Europe Dura Substitute Market Value (US$ Mn) Forecast, by Material, 2017–2031
Table 21: Europe Dura Substitute Market Value (US$ Mn) Forecast, by Biological Grafts, 2017–2031
Table 22: Europe Dura Substitute Market Value (US$ Mn) Forecast, by Xenografts, 2017–2031
Table 23: Europe Dura Substitute Market Value (US$ Mn) Forecast, by Synthetic, 2017–2031
Table 24: Europe Dura Substitute Market Value (US$ Mn) Forecast, by Application, 2017–2031
Table 25: Europe Dura Substitute Market Value (US$ Mn) Forecast, by End-user, 2017–2031
Table 26: Germany Dura Substitute Market Value (US$ Mn) Forecast, by Material, 2017–2031
Table 27: Germany Dura Substitute Market Value (US$ Mn) Forecast, by Application, 2017–2031
Table 28: U.K. Dura Substitute Market Value (US$ Mn) Forecast, by Material, 2017–2031
Table 29: U.K Dura Substitute Market Value (US$ Mn) Forecast, by Application, 2017–2031
Table 30: France Dura Substitute Market Value (US$ Mn) Forecast, by Material, 2017–2031
Table 31: France Dura Substitute Market Value (US$ Mn) Forecast, by Application, 2017–2031
Table 32: Spain Dura Substitute Market Value (US$ Mn) Forecast, by Material, 2017–2031
Table 33: Spain Dura Substitute Market Value (US$ Mn) Forecast, by Application, 2017–2031
Table 34: Italy Dura Substitute Market Value (US$ Mn) Forecast, by Material, 2017–2031
Table 35: Italy Dura Substitute Market Value (US$ Mn) Forecast, by Application, 2017–2031
Table 36: Denmark Dura Substitute Market Value (US$ Mn) Forecast, by Material, 2017–2031
Table 37: Denmark Dura Substitute Market Value (US$ Mn) Forecast, by Application, 2017–2031
Table 38: Sweden Dura Substitute Market Value (US$ Mn) Forecast, by Material, 2017–2031
Table 39: Sweden Dura Substitute Market Value (US$ Mn) Forecast, by Application, 2017–2031
Table 40: Finland Dura Substitute Market Value (US$ Mn) Forecast, by Material, 2017–2031
Table 41: Finland Dura Substitute Market Value (US$ Mn) Forecast, by Application, 2017–2031
Table 42: Iceland Dura Substitute Market Value (US$ Mn) Forecast, by Material, 2017–2031
Table 43: Iceland Dura Substitute Market Value (US$ Mn) Forecast, by Application, 2017–2031
Table 44: Norway Dura Substitute Market Value (US$ Mn) Forecast, by Material, 2017–2031
Table 45: Norway Dura Substitute Market Value (US$ Mn) Forecast, by Application, 2017–2031
Table 46: Rest of Europe Dura Substitute Market Value (US$ Mn) Forecast, by Material, 2017–2031
Table 47: Rest of Europe Dura Substitute Market Value (US$ Mn) Forecast, by Application, 2017–2031
Table 48: Asia Pacific Dura Substitute Market Value (US$ Mn) Forecast, by Country/Sub-region, 2017–2031
Table 49: Asia Pacific Dura Substitute Market Value (US$ Mn) Forecast, by Material, 2017–2031
Table 50: Asia Pacific Dura Substitute Market Value (US$ Mn) Forecast, by Biological Grafts, 2017–2031
Table 51: Asia Pacific Dura Substitute Market Value (US$ Mn) Forecast, by Xenografts, 2017–2031
Table 52: Asia Pacific Dura Substitute Market Value (US$ Mn) Forecast, by Synthetic, 2017–2031
Table 53: Asia Pacific Dura Substitute Market Value (US$ Mn) Forecast, by Application, 2017–2031
Table 54: Asia Pacific Dura Substitute Market Value (US$ Mn) Forecast, by End-user, 2017–2031
Table 55: China Dura Substitute Market Value (US$ Mn) Forecast, by Material, 2017–2031
Table 56: China Dura Substitute Market Value (US$ Mn) Forecast, by Application, 2017–2031
Table 57: Japan Dura Substitute Market Value (US$ Mn) Forecast, by Material, 2017–2031
Table 58: Japan Dura Substitute Market Value (US$ Mn) Forecast, by Application, 2017–2031
Table 59: India Dura Substitute Market Value (US$ Mn) Forecast, by Material, 2017–2031
Table 60: India Dura Substitute Market Value (US$ Mn) Forecast, by Application, 2017–2031
Table 61: South Korea Dura Substitute Market Value (US$ Mn) Forecast, by Material, 2017–2031
Table 62: South Korea Dura Substitute Market Value (US$ Mn) Forecast, by Application, 2017–2031
Table 63: Australia Dura Substitute Market Value (US$ Mn) Forecast, by Material, 2017–2031
Table 64: Australia Dura Substitute Market Value (US$ Mn) Forecast, by Application, 2017–2031
Table 65: Rest of Asia Pacific Dura Substitute Market Value (US$ Mn) Forecast, by Material, 2017–2031
Table 66: Rest of Asia Pacific Dura Substitute Market Value (US$ Mn) Forecast, by Application, 2017–2031
Table 67: Latin America Dura Substitute Market Value (US$ Mn) Forecast, by Material, 2017–2031
Table 68: Latin America Dura Substitute Market Value (US$ Mn) Forecast, by Biological Grafts, 2017–2031
Table 69: Latin America Dura Substitute Market Value (US$ Mn) Forecast, by Xenografts, 2017–2031
Table 70: Latin America Dura Substitute Market Value (US$ Mn) Forecast, by Synthetic, 2017–2031
Table 71: Latin America Dura Substitute Market Value (US$ Mn) Forecast, by Application, 2017–2031
Table 72: Latin America Dura Substitute Market Value (US$ Mn) Forecast, by End-user, 2017–2031
Table 73: Middle East & Africa Dura Substitute Market Value (US$ Mn) Forecast, by Material, 2017–2031
Table 74: Middle East & Africa Dura Substitute Market Value (US$ Mn) Forecast, by Biological Grafts, 2017–2031
Table 75: Middle East & Africa Dura Substitute Market Value (US$ Mn) Forecast, by Xenografts, 2017–2031
Table 76: Middle East & Africa Dura Substitute Market Value (US$ Mn) Forecast, by Synthetic, 2017–2031
Table 77: Middle East & Africa Dura Substitute Market Value (US$ Mn) Forecast, by Application, 2017–2031
Table 78: Middle East & Africa Dura Substitute Market Value (US$ Mn) Forecast, by End-user, 2017–2031
List of Figures
Figure 01: Global Dura Substitute Market Value (US$ Mn) Forecast, 2017–2031
Figure 02: Global Dura Substitute Market Value Share, by Material, 2020
Figure 03: Global Dura Substitute Market Value Share, by Application, 2020
Figure 04: Global Dura Substitute Market Value Share, by End-user, 2020
Figure 05: Global Dura Substitute Market Value Share, by Region, 2020
Figure 06: Global Dura Substitute Market Value Share Analysis, by Material, 2020 and 2031
Figure 07: Global Dura Substitute Market Attractiveness Analysis, by Material, 2021–2031
Figure 08: Global Dura Substitute Market Value (US$ Mn), by Biological Grafts, 2017–2031
Figure 09: Global Dura Substitute Market Value (US$ Mn), by Synthetic, 2017–2031
Figure 10: Global Dura Substitute Market Value (US$ Mn), by Xenografts, 2017–2031
Figure 11: Global Dura Substitute Market Value (US$ Mn), by Autografts, 2017–2031
Figure 12: Global Dura Substitute Market Value (US$ Mn), by Allografts, 2017–2031
Figure 13: Global Dura Substitute Market Value (US$ Mn), by Trichomoniasis, 2017–2031
Figure 14: Global Dura Substitute Market Value (US$ Mn), by Others, 2017–2031
Figure 15: Global Dura Substitute Market Value Share Analysis, by Application, 2020 and 2031
Figure 16: Global Dura Substitute Market Attractiveness Analysis, by Application, 2021–2031
Figure 17: Global Dura Substitute Market Value (US$ Mn), by Neurosurgery, 2017–2031
Figure 18: Global Dura Substitute Market Value (US$ Mn), by Spinal Surgery, 2017–2031
Figure 19: Global Dura Substitute Market Value (US$ Mn), by Others, 2017–2031
Figure 20: Global Dura Substitute Market Value Share Analysis, by Application, 2020 and 2031
Figure 21: Global Dura Substitute Market Value Share Analysis, by End-user, 2020 and 2031
Figure 22: Global Dura Substitute Market Attractiveness Analysis, by End-user, 2021–2031
Figure 23: Global Dura Substitute Market Value (US$ Mn), by Hospitals, 2017–2031
Figure 24: Global Dura Substitute Market Value (US$ Mn), by Ambulatory Surgical Centers, 2017–2031
Figure 25: Global Dura Substitute Market Value (US$ Mn), by Others, 2017–2031
Figure 26: Global Dura Substitute Market Analysis, 2020 and 2031
Figure 27: Global Dura Substitute Market Attractiveness Analysis, by Region, 2021–2031
Figure 28: North America Dura Substitute Market Value (US$ Mn) Forecast and Y-o-Y Growth (%) Projection, 2017–2031
Figure 29: North America Dura Substitute Market Value Share, by Country/Sub-region, 2020–2031
Figure 30: North America Dura Substitute Market Attractiveness, by Country/Sub-region, 2021–2031
Figure 31: North America Dura Substitute Market Value Share Analysis, by Material, 2020 and 2031
Figure 32: North America Dura Substitute Market Attractiveness Analysis, by Material, 2021–2031
Figure 33: North America Dura Substitute Market Value Share Analysis, by Application, 2020 and 2031
Figure 34: North America Dura Substitute Market Attractiveness Analysis, by Application, 2021–2031
Figure 35: North America Dura Substitute Market Value Share Analysis, by End-user, 2020 and 2031
Figure 36: North America Dura Substitute Market Attractiveness Analysis, by End-user, 2021–2031
Figure 37: U.S Dura Substitute Market Value Share Analysis, by Material, 2020 and 2031
Figure 38: U.S Dura Substitute Market Attractiveness Analysis, by Material, 2021–2031
Figure 39: U.S Dura Substitute Market Value Share Analysis, by Application, 2020 and 2031
Figure 40: U.S Dura Substitute Market Attractiveness Analysis, by Application, 2021–2031
Figure 41: Canada Dura Substitute Market Value Share Analysis, by Material, 2020 and 2031
Figure 42: Canada Dura Substitute Market Attractiveness Analysis, by Material, 2021–2031
Figure 43: Canada Dura Substitute Market Value Share Analysis, by Application, 2020 and 2031
Figure 44: Canada Dura Substitute Market Attractiveness Analysis, by Application, 2021–2031
Figure 45: Europe Dura Substitute Market Value (US$ Mn) Forecast and Y-o-Y Growth (%) Projection, 2017–2031
Figure 46: Europe Dura Substitute Market Value Share, by Country/Sub-region, 2020–2031
Figure 47: Europe Dura Substitute Market Attractiveness, by Country/Sub-region, 2021–2031
Figure 48: Europe Dura Substitute Market Value Share Analysis, by Material, 2020 and 2031
Figure 49: Europe Dura Substitute Market Attractiveness Analysis, by Material, 2021–2031
Figure 50: Europe Dura Substitute Market Value Share Analysis, by End-user, 2020 and 2031
Figure 51: Europe Dura Substitute Market Attractiveness Analysis, by End-user, 2021–2031
Figure 52: Germany Dura Substitute Market Value Share Analysis, by Material, 2020 and 2031
Figure 53: Germany Dura Substitute Market Attractiveness Analysis, by Material, 2021–2031
Figure 54: Germany Dura Substitute Market Value Share Analysis, by Application, 2020 and 2031
Figure 55: Germany Dura Substitute Market Attractiveness Analysis, by Application, 2021–2031
Figure 56: U.K. Dura Substitute Market Value Share Analysis, by Material, 2020 and 2031
Figure 57: U.K. Dura Substitute Market Attractiveness Analysis, by Material, 2021–2031
Figure 58: U.K. Dura Substitute Market Value Share Analysis, by Application, 2020 and 2031
Figure 59: U.K. Dura Substitute Market Attractiveness Analysis, by Application, 2021–2031
Figure 60: France Dura Substitute Market Value Share Analysis, by Material, 2020 and 2031
Figure 61: France Dura Substitute Market Attractiveness Analysis, by Material, 2021–2031
Figure 62: France Dura Substitute Market Value Share Analysis, by Application, 2020 and 2031
Figure 63: France Dura Substitute Market Attractiveness Analysis, by Application, 2021–2031
Figure 64: Spain Dura Substitute Market Value Share Analysis, by Material, 2020 and 2031
Figure 65: Spain Dura Substitute Market Attractiveness Analysis, by Material, 2021–2031
Figure 66: Spain Dura Substitute Market Value Share Analysis, by Application, 2020 and 2031
Figure 67: Spain Dura Substitute Market Attractiveness Analysis, by Application, 2021–2031
Figure 68: Italy Dura Substitute Market Value Share Analysis, by Material, 2020 and 2031
Figure 69: Italy Dura Substitute Market Attractiveness Analysis, by Material, 2021–2031
Figure 70: Italy Dura Substitute Market Value Share Analysis, by Application, 2020 and 2031
Figure 71: Italy Dura Substitute Market Attractiveness Analysis, by Application, 2021–2031
Figure 72: Denmark Dura Substitute Market Value Share Analysis, by Material, 2020 and 2031
Figure 73: Denmark Dura Substitute Market Attractiveness Analysis, by Material, 2021–2031
Figure 74: Denmark Dura Substitute Market Value Share Analysis, by Application, 2020 and 2031
Figure 75: Denmark Dura Substitute Market Attractiveness Analysis, by Application, 2021–2031
Figure 76: Sweden Dura Substitute Market Value Share Analysis, by Material, 2020 and 2031
Figure 77: Sweden Dura Substitute Market Attractiveness Analysis, by Material, 2021–2031
Figure 78: Sweden Dura Substitute Market Value Share Analysis, by Application, 2020 and 2031
Figure 79: Sweden Dura Substitute Market Attractiveness Analysis, by Application, 2021–2031
Figure 80: Finland Dura Substitute Market Value Share Analysis, by Material, 2020 and 2031
Figure 81: Finland Dura Substitute Market Attractiveness Analysis, by Material, 2021–2031
Figure 82: Finland Dura Substitute Market Value Share Analysis, by Application, 2020 and 2031
Figure 83: Finland Dura Substitute Market Attractiveness Analysis, by Application, 2021–2031
Figure 84: Iceland Dura Substitute Market Value Share Analysis, by Material, 2020 and 2031
Figure 85: Iceland Dura Substitute Market Attractiveness Analysis, by Material, 2021–2031
Figure 86: Iceland Dura Substitute Market Value Share Analysis, by Application, 2020 and 2031
Figure 87: Iceland Dura Substitute Market Attractiveness Analysis, by Application, 2021–2031
Figure 88: Norway Dura Substitute Market Value Share Analysis, by Material, 2020 and 2031
Figure 89: Norway Dura Substitute Market Attractiveness Analysis, by Material, 2021–2031
Figure 90: Norway Dura Substitute Market Value Share Analysis, by Application, 2020 and 2031
Figure 91: Norway Dura Substitute Market Attractiveness Analysis, by Application, 2021–2031
Figure 92: Rest of Europe Dura Substitute Market Value Share Analysis, by Material, 2020 and 2031
Figure 93: Rest of Europe Dura Substitute Market Attractiveness Analysis, by Material, 2021–2031
Figure 94: Rest of Europe Dura Substitute Market Value Share Analysis, by Application, 2020 and 2031
Figure 95: Rest of Europe Dura Substitute Market Attractiveness Analysis, by Application, 2021–2031
Figure 96: Asia Pacific Dura Substitute Market Value (US$ Mn) Forecast and Y-o-Y Growth (%) Projection, 2017–2031
Figure 97: Asia Pacific Dura Substitute Market Value Share, by Country/Sub-region, 2020–2031
Figure 98: Asia Pacific Dura Substitute Market Attractiveness, by Country/Sub-region, 2021–2031
Figure 99: Asia Pacific Dura Substitute Market Value Share Analysis, by Material, 2020 and 2031
Figure 100: Asia Pacific Dura Substitute Market Attractiveness Analysis, by Material, 2021–2031
Figure 101: Asia Pacific Dura Substitute Market Value Share Analysis, by Application, 2020 and 2031
Figure 102: Asia Pacific Dura Substitute Market Attractiveness Analysis, by Application, 2021–2031
Figure 103: Asia Pacific Dura Substitute Market Value Share Analysis, by End-user, 2020 and 2031
Figure 104: Asia Pacific Dura Substitute Market Attractiveness Analysis, by End-user, 2021–2031
Figure 105: China Dura Substitute Market Value Share Analysis, by Material, 2020 and 2031
Figure 106: China Dura Substitute Market Attractiveness Analysis, by Material, 2021–2031
Figure 107: China Dura Substitute Market Value Share Analysis, by Application, 2020 and 2031
Figure 108: China Dura Substitute Market Attractiveness Analysis, by Application, 2021–2031
Figure 109: Japan Dura Substitute Market Value Share Analysis, by Material, 2020 and 2031
Figure 110: Japan Dura Substitute Market Attractiveness Analysis, by Material, 2021–2031
Figure 111: Japan Dura Substitute Market Value Share Analysis, by Application, 2020 and 2031
Figure 112: Japan Dura Substitute Market Attractiveness Analysis, by Application, 2021–2031
Figure 113: India Dura Substitute Market Value Share Analysis, by Material, 2020 and 2031
Figure 114: India Dura Substitute Market Attractiveness Analysis, by Material, 2021–2031
Figure 115: India Dura Substitute Market Value Share Analysis, by Application, 2020 and 2031
Figure 116: India Dura Substitute Market Attractiveness Analysis, by Application, 2021–2031
Figure 117: South Korea Dura Substitute Market Value Share Analysis, by Material, 2020 and 2031
Figure 118: South Korea Dura Substitute Market Attractiveness Analysis, by Material, 2021–2031
Figure 119: South Korea Dura Substitute Market Value Share Analysis, by Application, 2020 and 2031
Figure 120: South Korea Dura Substitute Market Attractiveness Analysis, by Application, 2021–2031
Figure 121: Australia Dura Substitute Market Value Share Analysis, by Material, 2020 and 2031
Figure 122 Australia Dura Substitute Market Attractiveness Analysis, by Material, 2021–2031
Figure 123: Australia Dura Substitute Market Value Share Analysis, by Application, 2020 and 2031
Figure 124: Australia Dura Substitute Market Attractiveness Analysis, by Application, 2021–2031
Figure 125: Rest of Asia Pacific Dura Substitute Market Value Share Analysis, by Material, 2020 and 2031
Figure 126: Rest of Asia Pacific Dura Substitute Market Attractiveness Analysis, by Material, 2021–2031
Figure 127: Rest of Asia Pacific Dura Substitute Market Value Share Analysis, by Application, 2020 and 2031
Figure 128: Rest of Asia Pacific Dura Substitute Market Attractiveness Analysis, by Application, 2021–2031
Figure 129: Latin America Dura Substitute Market Value (US$ Mn) Forecast and Y-o-Y Growth (%) Projection, 2017–2031
Figure 130: Latin America Dura Substitute Market Value Share Analysis, by Material, 2020 and 2031
Figure 131: Latin America Dura Substitute Market Attractiveness Analysis, by Material, 2021–2031
Figure 132: Latin America Dura Substitute Market Value Share Analysis, by Application, 2020 and 2031
Figure 133: Latin America Dura Substitute Market Attractiveness Analysis, by Application, 2021–2031
Figure 134: Latin America Dura Substitute Market Value Share Analysis, by End-user, 2020 and 2031
Figure 135: Latin America Dura Substitute Market Attractiveness Analysis, by End-user, 2021–2031
Figure 136: Middle East & Africa Dura Substitute Market Value (US$ Mn) Forecast and Y-o-Y Growth (%) Projection, 2017–2031
Figure 137: Middle East & Africa Dura Substitute Market Value Share Analysis, by Material, 2020 and 2031
Figure 138: Middle East & Africa Dura Substitute Market Attractiveness Analysis, by Material, 2021–2031
Figure 139: Middle East & Africa Dura Substitute Market Value Share Analysis, by Application, 2020 and 2031
Figure 140: Middle East & Africa Dura Substitute Market Attractiveness Analysis, by Application, 2021–2031
Figure 141: Middle East & Africa Dura Substitute Market Value Share Analysis, by End-user, 2020 and 2031
Figure 142: Middle East & Africa Dura Substitute Market Attractiveness Analysis, by End-user, 2021–2031
Copyright © Transparency Market Research, Inc. All Rights reserved
Trust Online

Dura Substitute Market