
Reports
Reports
Analysts’ Viewpoint on Market Scenario
Leading companies in the market are focusing on high-growth end-use industries of capacitor market, such as consumer electronics, IT & telecommunication, and power and utility to keep their businesses growing post the COVID-19 pandemic. Accordingly, the market is estimated to grow considerably during the forecast period, owing to a rise in the demand for consumer electronics products, increase in demand for mobile devices, and surge in production of electric vehicles.
Furthermore, demand for capacitors is increasing from multiple electronic devices including control circuits, inverter main circuits, switching mode power supplies, and computer motherboards. Thus, rise in demand for such products and components is expected to create significant opportunities for the global market. Key players are also focusing on the development of small devices with high capacitance. Top capacitor manufacturers and suppliers should tap into incremental opportunities in capacitor to broaden their revenue streams.
The capacitor is a component that has the ability to store energy in the form of an electrical charge, producing a potential difference (Static Voltage) across its plates, similar to a small rechargeable battery. The basic structure of all capacitors is the same. A non-conductive material, called dielectric, separates two parallel metal electrode plates. An electric field exists in the dielectric when a voltage exists between these conductive parallel plates. This field conserves energy and generates mechanical force between the plates. There are several types of capacitors available in the global market, ranging from very small capacitor beads and high voltage capacitors to high temperature capacitors and large power factor correction capacitors; however, they all do the same thing, they store charge.
Demand for electric vehicles is increasing consistently due to favorable government regulations and rising incentive policies for the adoption of electric vehicles across the globe. Electric vehicles (EVs) have fueled the demand for capacitor technologies with high performance and reliability. Diverse voltage, power, and size requirements of modern EV electrical subsystems necessitate careful capacitor selection by designers.
Capacitors in electric vehicles are designed to prevent ripple currents from returning to the power source and to smooth out DC bus voltage variations. Capacitors are also used to keep semiconductors safe. Furthermore, these capacitors are used to suppress harmful high frequency components generated by switching devices in an electric vehicle's drive system.
According to the International Energy Agency (IEA), in 2021, electric vehicle sold 6.6 million. Approximately 10% of global car sales were electric in 2021, four times the in the 2019 market share. This brought the total number of electric cars on the world’s roads to about 16.5 million, triple the amount in 2018.
Some of the key players from the capacitor market such as KYOCERA Corporation provides ceramic capacitor that has a wide voltage range and low series resistance (ESR). These specifications are well-suited for automotive applications. Thus, rise in sales of electric vehicles is likely to have a positive impact on the market.
Rising demand for capacitors from the consumer electronics sector is one of the significant factors that is projected to boost the capacitor market in the next few years. Portable consumer electronics, such as cell phones and cameras, are rapidly evolving to meet the needs of modern society. They're getting smaller, lighter, thinner, more flexible, and more wearable. Supercapacitors are appealing power supplies for portable electronic devices because they can store nearly as much energy as a battery, while also having the advantage of the high-speed energy discharge that is the characteristic of normal capacitors.
Jinzhou Kaimei Power Co., Ltd. is one of the most professional supercapacitor suppliers from China. The company produces several type of capacitors including supercapacitors. Supercapacitors have stable performance, fast charging and discharging speed, environmental protection and safety, and are suitable for electronics applications. Therefore, growing demand for capacitors from the consumer electronics sector is expected fuel the capacitor industry.
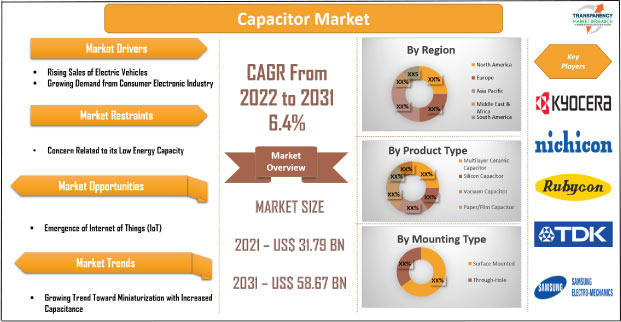
In terms of product type, the global capacitor market has been segregated into multilayer ceramic capacitor, silicon capacitor, vacuum capacitor, paper/film capacitor, tantalum capacitor, and others (electrolytic capacitor, supercapacitor, etc.). Among the segments, the multilayer ceramic capacitor segment held the highest share of the market in 2021.
Multilayer ceramic capacitor can be utilized in various applications, such as audio and RF, due to their cost-effective prices and reliability. The values of ceramic capacitors range from a few pico-farads to 0.1 micro-farads. Their loss factor varies depending on the dielectric in the system; however, it is still considered to be particularly low.
Ceramic capacitors are primarily used in devices with high stability and low loss. These devices provide accurate results, and their capacitance values are stable with respect to applied voltage, frequency, and temperature.
Some of the major players from the capacitor market, such as Vishay Intertechnology, Inc. provides axial leaded multilayer ceramic capacitors for general purpose class 1, class 2 and class 3, 50 vdc, 100 vdc, 200 vdc, and 500 vdc. They possess various features such as high capacitance, high reliability, and axial mounting style.
In terms of mounting type, the global capacitor has been classified into surface mounted and through-hole. Surface mounted is one of the significant type of capacitor mounting and these capacitors are widely used in high-volume manufacturing. This type of capacitor is small, leadless, and can be placed on modern printed circuit boards using modern pick and place machines. The primary function of any surface mounted capacitor is to store and re-supply electrical energy, i.e. charge and discharge electrical energy.
In April 2022, Omni Pro Electronics introduced the NAZR Series of surface mount High-CV aluminum electrolytic capacitors. The series can be used in communication infrastructure and supports power electronics applications up to 100 vdc.
Asia Pacific held the largest share of approximately 38% of the global market in 2021 due to the presence of major players in the region and growing adoption of capacitors in consumer electronic devices. China is a prominent market in Asia Pacific for capacitor due to the availability of raw materials and strong presence of small-scale capacitor manufacturing companies in the country. Furthermore, increase in usage of capacitor for the automotive and power and utility sectors drives capacitor market growth.
Middle East & Africa is a larger market for capacitor as compared to South America; however, the market in South America is estimated to grow at a rapid pace as compared to the market in Middle East & Africa.
The global market is consolidated with a small number of large-scale vendors controlling a majority of the capacitor market share. A majority of the firms are spending significantly on comprehensive research and new product development. Expansion of product portfolios and mergers and acquisitions are major strategies adopted by key players. Alcon Electronics Private Limited, Evans Capacitor Company, Jinzhou Kaimei Power Co., Ltd., KEMET Corporation, Kendeil Srl, KYOCERA Corporation, Murata Manufacturing Co., Ltd., NICHICON CORPORATION, Nippon Chemi-Con Corporation, Omni Pro Electronics, Panasonic Industry Co., Ltd., Rubycon Corporation, SAMSUNG ELECTRO-MECHANICS, TAIYO YUDEN CO., LTD., TDK Electronics AG, and Vishay Intertechnology, Inc. are the prominent entities operating in this market.
In June 2021, NICHICON CORPORATION introduced the GYE series of aluminum capacitors with high ripple current and low ESR performance, which are witnessing increasing demanded in automotive and telecommunications applications. This series is used to design advanced circuit by reducing the number of capacitors.
In April 2021, Kyocera Corporation and AVX Corporation announced that they have developed a new integrated brand "KYOCERA AVX" to be used for the Kyocera Group's electronic components business starting in October 2021. The new brand structure would strengthen the growth of Kyocera's electronic components business globally.
Each of these players has been profiled in the market report based on parameters such as company overview, financial overview, business strategies, product portfolio, business segments, and recent developments
|
Attribute |
Detail |
|
Market Size Value in 2021 |
US$ 31.79 Bn |
|
Market Forecast Value in 2031 |
US$ 58.67 BN |
|
Growth Rate (CAGR) |
6.4% |
|
Forecast Period |
2022–2031 |
|
Historical Data Available for |
2017–2020 |
|
Quantitative Units |
US$ Bn for Value and Million Units for Volume |
|
Market Analysis |
It includes cross segment analysis at global as well as regional level. Furthermore, qualitative analysis includes drivers, restraints, opportunities, key trends, Porter’s Five Forces analysis, value chain analysis, and key trend analysis. |
|
Competition Landscape |
|
|
Format |
Electronic (PDF) + Excel |
|
Market Segmentation |
|
|
Regions Covered |
|
|
Countries Covered |
|
|
Companies Profiled |
|
|
Customization Scope |
Available upon request |
|
Pricing |
Available upon request |
The global market stood at US$ 31.79 Bn in 2021
The global industry is expected to rise at a CAGR of 6.4% by 2031
The global market would reach US$ 58.67 Bn in 2031
Alcon Electronics Private Limited, Evans Capacitor Company, Jinzhou Kaimei Power Co., Ltd., KEMET Corporation, Kendeil Srl, KYOCERA Corporation, Murata Manufacturing Co., Ltd., NICHICON CORPORATION, Nippon Chemi-Con Corporation, Omni Pro Electronics, Panasonic Industry Co., Ltd., Rubycon Corporation, SAMSUNG ELECTRO-MECHANICS, TAIYO YUDEN CO., LTD., TDK Electronics AG, and Vishay Intertechnology, Inc.
The U.S. held approximately 22% of share of the global market in 2021
Based on product type, the multilayer ceramic capacitor segment is expected to hold approximately 38% of share in the market
Growing trend toward miniaturization with increased capacitance
Asia Pacific is highly lucrative region of the global market
1. Preface
1.1. Market Introduction
1.2. Market and Segments Definition
1.3. Market Taxonomy
1.4. Research Methodology
1.5. Assumption and Acronyms
2. Executive Summary
2.1. Global Capacitor Market Overview
2.2. Regional Outline
2.3. Industry Outline
2.4. Market Dynamics Snapshot
2.5. Competition Blueprint
3. Market Dynamics
3.1. Macro-economic Factors
3.2. Drivers
3.3. Restraints
3.4. Opportunities
3.5. Key Trends
3.6. Regulatory Scenario
4. Associated Industry and Key Indicator Assessment
4.1. Parent Industry Overview – Global Electronic Component Industry Overview
4.2. Supply Chain Analysis
4.3. Pricing Trend Analysis
4.4. Technology Roadmap Analysis
4.5. Industry SWOT Analysis
4.6. Porter Five Forces Analysis
4.7. Covid-19 Impact and Recovery Analysis
5. Capacitor Market Analysis, by Product Type
5.1. Capacitor Market Value (US$ Bn) and Volume (Million Units) Analysis & Forecast, by Product Type, 2017–2031
5.1.1. Multilayer Ceramic Capacitor
5.1.2. Silicon Capacitor
5.1.3. Vacuum Capacitor
5.1.4. Paper/Film Capacitor
5.1.5. Tantalum Capacitor
5.1.6. Others
5.2. Market Attractiveness Analysis, by Product Type
6. Capacitor Market Analysis, by Mounting Type
6.1. Capacitor Market Value (US$ Bn) Analysis & Forecast, by Mounting Type, 2017–2031
6.1.1. Surface Mounted
6.1.2. Through-Hole
6.2. Market Attractiveness Analysis, by Mounting Type
7. Capacitor Market Analysis, by Voltage Range
7.1. Capacitor Market Value (US$ Bn) and Volume (Million Units) Analysis & Forecast, by Voltage Range, 2017–2031
7.1.1. Upto 500 V
7.1.2. 501 to 1000 V
7.1.3. 1001 to 2000 V
7.1.4. Above 2000 V
7.2. Market Attractiveness Analysis, by Voltage Range
8. Capacitor Market Analysis, by End-use Industry
8.1. Capacitor Market Value (US$ Bn) Analysis & Forecast, by End-use Industry, 2017–2031
8.1.1. Automotive and Transportation
8.1.2. Consumer Electronics
8.1.3. IT and Telecommunication
8.1.4. Power and Utility
8.1.5. Aerospace and Defense
8.1.6. Healthcare
8.1.7. Others
8.2. Market Attractiveness Analysis, by End-use Industry
9. Capacitor Market Analysis and Forecast, by Region
9.1. Capacitor Market Value (US$ Bn) and Volume (Million Units) Analysis & Forecast, by Region, 2017–2031
9.1.1. North America
9.1.2. Europe
9.1.3. Asia Pacific
9.1.4. Middle East & Africa
9.1.5. South America
9.2. Market Attractiveness Analysis, by Region
10. North America Capacitor Market Analysis and Forecast
10.1. Market Snapshot
10.2. Drivers and Restraints: Impact Analysis
10.3. Capacitor Market Value (US$ Bn) and Volume (Million Units) Analysis & Forecast, by Product Type, 2017–2031
10.3.1. Multilayer Ceramic Capacitor
10.3.2. Silicon Capacitor
10.3.3. Vacuum Capacitor
10.3.4. Paper/Film Capacitor
10.3.5. Tantalum Capacitor
10.3.6. Others
10.4. Capacitor Market Value (US$ Bn) Analysis & Forecast, by Mounting Type, 2017–2031
10.4.1. Surface Mounted
10.4.2. Through-Hole
10.5. Capacitor Market Value (US$ Bn) and Volume (Million Units) Analysis & Forecast, by Voltage Range, 2017–2031
10.5.1. Upto 500 V
10.5.2. 501 to 1000 V
10.5.3. 1001 to 2000 V
10.5.4. Above 2000 V
10.6. Capacitor Market Value (US$ Bn) Analysis & Forecast, by End-use Industry, 2017–2031
10.6.1. Automotive and Transportation
10.6.2. Consumer Electronics
10.6.3. IT and Telecommunication
10.6.4. Power and Utility
10.6.5. Aerospace and Defense
10.6.6. Healthcare
10.6.7. Others
10.7. Capacitor Market Value (US$ Bn) and Volume (Million Units) Analysis & Forecast, by Country and Sub-region, 2017–2031
10.7.1. U.S.
10.7.2. Canada
10.7.3. Rest of North America
10.8. Market Attractiveness Analysis
10.8.1. By Product Type
10.8.2. By Mounting Type
10.8.3. By Voltage Range
10.8.4. By End-use Industry
10.8.5. By Country and Sub-region
11. Europe Capacitor Market Analysis and Forecast
11.1. Market Snapshot
11.2. Drivers and Restraints: Impact Analysis
11.3. Capacitor Market Value (US$ Bn) and Volume (Million Units) Analysis & Forecast, by Product Type, 2017–2031
11.3.1. Multilayer Ceramic Capacitor
11.3.2. Silicon Capacitor
11.3.3. Vacuum Capacitor
11.3.4. Paper/Film Capacitor
11.3.5. Tantalum Capacitor
11.3.6. Others
11.4. Capacitor Market Value (US$ Bn) Analysis & Forecast, by Mounting Type, 2017–2031
11.4.1. Surface Mounted
11.4.2. Through-Hole
11.5. Capacitor Market Value (US$ Bn) and Volume (Million Units) Analysis & Forecast, by Voltage Range, 2017–2031
11.5.1. Upto 500 V
11.5.2. 501 to 1000 V
11.5.3. 1001 to 2000 V
11.5.4. Above 2000 V
11.6. Capacitor Market Value (US$ Bn) Analysis & Forecast, by End-use Industry, 2017–2031
11.6.1. Automotive and Transportation
11.6.2. Consumer Electronics
11.6.3. IT and Telecommunication
11.6.4. Power and Utility
11.6.5. Aerospace and Defense
11.6.6. Healthcare
11.6.7. Others
11.7. Capacitor Market Value (US$ Bn) and Volume (Million Units) Analysis & Forecast, by Country and Sub-region, 2017–2031
11.7.1. U.K.
11.7.2. Germany
11.7.3. France
11.7.4. Rest of Europe
11.8. Market Attractiveness Analysis
11.8.1. By Product Type
11.8.2. By Mounting Type
11.8.3. By Voltage Range
11.8.4. By End-use Industry
11.8.5. By Country and Sub-region
12. Asia Pacific Capacitor Market Analysis and Forecast
12.1. Market Snapshot
12.2. Drivers and Restraints: Impact Analysis
12.3. Capacitor Market Value (US$ Bn) and Volume (Million Units) Analysis & Forecast, by Product Type, 2017–2031
12.3.1. Multilayer Ceramic Capacitor
12.3.2. Silicon Capacitor
12.3.3. Vacuum Capacitor
12.3.4. Paper/Film Capacitor
12.3.5. Tantalum Capacitor
12.3.6. Others
12.4. Capacitor Market Value (US$ Bn) Analysis & Forecast, by Mounting Type, 2017–2031
12.4.1. Surface Mounted
12.4.2. Through-Hole
12.5. Capacitor Market Value (US$ Bn) and Volume (Million Units) Analysis & Forecast, by Voltage Range, 2017–2031
12.5.1. Upto 500 V
12.5.2. 501 to 1000 V
12.5.3. 1001 to 2000 V
12.5.4. Above 2000 V
12.6. Capacitor Market Value (US$ Bn) Analysis & Forecast, by End-use Industry, 2017–2031
12.6.1. Automotive and Transportation
12.6.2. Consumer Electronics
12.6.3. IT and Telecommunication
12.6.4. Power and Utility
12.6.5. Aerospace and Defense
12.6.6. Healthcare
12.6.7. Others
12.7. Capacitor Market Value (US$ Bn) and Volume (Million Units) Analysis & Forecast, by Country and Sub-region, 2017–2031
12.7.1. China
12.7.2. Japan
12.7.3. India
12.7.4. South Korea
12.7.5. ASEAN
12.7.6. Rest of Asia Pacific
12.8. Market Attractiveness Analysis
12.8.1. By Product Type
12.8.2. By Mounting Type
12.8.3. By Voltage Range
12.8.4. By End-use Industry
12.8.5. By Country and Sub-region
13. Middle East & Africa Capacitor Market Analysis and Forecast
13.1. Market Snapshot
13.2. Drivers and Restraints: Impact Analysis
13.3. Capacitor Market Value (US$ Bn) and Volume (Million Units) Analysis & Forecast, by Product Type, 2017–2031
13.3.1. Multilayer Ceramic Capacitor
13.3.2. Silicon Capacitor
13.3.3. Vacuum Capacitor
13.3.4. Paper/Film Capacitor
13.3.5. Tantalum Capacitor
13.3.6. Others
13.4. Capacitor Market Value (US$ Bn) Analysis & Forecast, by Mounting Type, 2017–2031
13.4.1. Surface Mounted
13.4.2. Through-Hole
13.5. Capacitor Market Value (US$ Bn) and Volume (Million Units) Analysis & Forecast, by Voltage Range, 2017–2031
13.5.1. Upto 500 V
13.5.2. 501 to 1000 V
13.5.3. 1001 to 2000 V
13.5.4. Above 2000 V
13.6. Capacitor Market Value (US$ Bn) Analysis & Forecast, by End-use Industry, 2017–2031
13.6.1. Automotive and Transportation
13.6.2. Consumer Electronics
13.6.3. IT and Telecommunication
13.6.4. Power and Utility
13.6.5. Aerospace and Defense
13.6.6. Healthcare
13.6.7. Others
13.7. Capacitor Market Value (US$ Bn) and Volume (Million Units) Analysis & Forecast, by Country and Sub-region, 2017–2031
13.7.1. GCC
13.7.2. South Africa
13.7.3. Rest of Middle East & Africa
13.8. Market Attractiveness Analysis
13.8.1. By Product Type
13.8.2. By Mounting Type
13.8.3. By Voltage Range
13.8.4. By End-use Industry
13.8.5. By Country and Sub-region
14. South America Capacitor Market Analysis and Forecast
14.1. Market Snapshot
14.2. Drivers and Restraints: Impact Analysis
14.3. Capacitor Market Value (US$ Bn) and Volume (Million Units) Analysis & Forecast, by Product Type, 2017–2031
14.3.1. Multilayer Ceramic Capacitor
14.3.2. Silicon Capacitor
14.3.3. Vacuum Capacitor
14.3.4. Paper/Film Capacitor
14.3.5. Tantalum Capacitor
14.3.6. Others
14.4. Capacitor Market Value (US$ Bn) Analysis & Forecast, by Mounting Type, 2017–2031
14.4.1. Surface Mounted
14.4.2. Through-Hole
14.5. Capacitor Market Value (US$ Bn) and Volume (Million Units) Analysis & Forecast, by Voltage Range, 2017–2031
14.5.1. Upto 500 V
14.5.2. 501 to 1000 V
14.5.3. 1001 to 2000 V
14.5.4. Above 2000 V
14.6. Capacitor Market Value (US$ Bn) Analysis & Forecast, by End-use Industry, 2017–2031
14.6.1. Automotive and Transportation
14.6.2. Consumer Electronics
14.6.3. IT and Telecommunication
14.6.4. Power and Utility
14.6.5. Aerospace and Defense
14.6.6. Healthcare
14.6.7. Others
14.7. Capacitor Market Value (US$ Bn) and Volume (Million Units) Analysis & Forecast, by Country and Sub-region, 2017–2031
14.7.1. Brazil
14.7.2. Rest of South America
14.8. Market Attractiveness Analysis
14.8.1. By Product Type
14.8.2. By Mounting Type
14.8.3. By Voltage Range
14.8.4. By End-use Industry
14.8.5. By Country and Sub-region
15. Competition Assessment
15.1. Global Capacitor Market Competition Matrix - a Dashboard View
15.1.1. Global Capacitor Market Company Share Analysis, by Value (2021)
15.1.2. Technological Differentiator
16. Company Profiles (Global Manufacturers/Suppliers)
16.1. Alcon Electronics Private Limited
16.1.1. Overview
16.1.2. Product Portfolio
16.1.3. Sales Footprint
16.1.4. Key Subsidiaries or Distributors
16.1.5. Strategy and Recent Developments
16.1.6. Key Financials
16.2. Evans Capacitor Company
16.2.1. Overview
16.2.2. Product Portfolio
16.2.3. Sales Footprint
16.2.4. Key Subsidiaries or Distributors
16.2.5. Strategy and Recent Developments
16.2.6. Key Financials
16.3. Jinzhou Kaimei Power Co., Ltd.
16.3.1. Overview
16.3.2. Product Portfolio
16.3.3. Sales Footprint
16.3.4. Key Subsidiaries or Distributors
16.3.5. Strategy and Recent Developments
16.3.6. Key Financials
16.4. KEMET Corporation
16.4.1. Overview
16.4.2. Product Portfolio
16.4.3. Sales Footprint
16.4.4. Key Subsidiaries or Distributors
16.4.5. Strategy and Recent Developments
16.4.6. Key Financials
16.5. Kendeil Srl
16.5.1. Overview
16.5.2. Product Portfolio
16.5.3. Sales Footprint
16.5.4. Key Subsidiaries or Distributors
16.5.5. Strategy and Recent Developments
16.5.6. Key Financials
16.6. KYOCERA Corporation
16.6.1. Overview
16.6.2. Product Portfolio
16.6.3. Sales Footprint
16.6.4. Key Subsidiaries or Distributors
16.6.5. Strategy and Recent Developments
16.6.6. Key Financials
16.7. Murata Manufacturing Co., Ltd.
16.7.1. Overview
16.7.2. Product Portfolio
16.7.3. Sales Footprint
16.7.4. Key Subsidiaries or Distributors
16.7.5. Strategy and Recent Developments
16.7.6. Key Financials
16.8. NICHICON CORPORATION
16.8.1. Overview
16.8.2. Product Portfolio
16.8.3. Sales Footprint
16.8.4. Key Subsidiaries or Distributors
16.8.5. Strategy and Recent Developments
16.8.6. Key Financials
16.9. Nippon Chemi-Con Corporation
16.9.1. Overview
16.9.2. Product Portfolio
16.9.3. Sales Footprint
16.9.4. Key Subsidiaries or Distributors
16.9.5. Strategy and Recent Developments
16.9.6. Key Financials
16.10. Omni Pro Electronics
16.10.1. Overview
16.10.2. Product Portfolio
16.10.3. Sales Footprint
16.10.4. Key Subsidiaries or Distributors
16.10.5. Strategy and Recent Developments
16.10.6. Key Financials
16.11. Panasonic Industry Co., Ltd.
16.11.1. Overview
16.11.2. Product Portfolio
16.11.3. Sales Footprint
16.11.4. Key Subsidiaries or Distributors
16.11.5. Strategy and Recent Developments
16.11.6. Key Financials
16.12. Rubycon Corporation
16.12.1. Overview
16.12.2. Product Portfolio
16.12.3. Sales Footprint
16.12.4. Key Subsidiaries or Distributors
16.12.5. Strategy and Recent Developments
16.12.6. Key Financials
16.13. SAMSUNG ELECTRO-MECHANICS
16.13.1. Overview
16.13.2. Product Portfolio
16.13.3. Sales Footprint
16.13.4. Key Subsidiaries or Distributors
16.13.5. Strategy and Recent Developments
16.13.6. Key Financials
16.14. TAIYO YUDEN CO., LTD.
16.14.1. Overview
16.14.2. Product Portfolio
16.14.3. Sales Footprint
16.14.4. Key Subsidiaries or Distributors
16.14.5. Strategy and Recent Developments
16.14.6. Key Financials
16.15. TDK Electronics AG
16.15.1. Overview
16.15.2. Product Portfolio
16.15.3. Sales Footprint
16.15.4. Key Subsidiaries or Distributors
16.15.5. Strategy and Recent Developments
16.15.6. Key Financials
16.16. Vishay Intertechnology, Inc.
16.16.1. Overview
16.16.2. Product Portfolio
16.16.3. Sales Footprint
16.16.4. Key Subsidiaries or Distributors
16.16.5. Strategy and Recent Developments
16.16.6. Key Financials
17. Recommendation
17.1. Opportunity Assessment
17.1.1. By Product Type
17.1.2. By Mounting Type
17.1.3. By Voltage Range
17.1.4. By End-use Industry
17.1.5. By Region
List of Tables
Table 01: Global Capacitor Market Value (US$ Bn) Forecast, by Product Type, 2017‒2031
Table 02: Global Capacitor Market Volume (Million Units) Forecast, by Product Type, 2017‒2031
Table 03: Global Capacitor Market Value (US$ Bn) Forecast, by Mounting Type, 2017‒2031
Table 04: Global Capacitor Market Value (US$ Bn) Forecast, by Voltage, 2017‒2031
Table 05: Global Capacitor Market Volume (Million Units) Forecast, by Voltage, 2017‒2031
Table 06: Global Capacitor Market Value (US$ Bn) Forecast, by End-use Industry, 2017‒2031
Table 07: Global Capacitor Market Value (US$ Bn) Forecast, by Region, 2017‒2031
Table 08: North America Capacitor Market Value (US$ Bn) Forecast, by Product Type, 2017‒2031
Table 09: North America Capacitor Market Volume (Million Units) Forecast, by Product Type, 2017‒2031
Table 10: North America Capacitor Market Value (US$ Bn) Forecast, by Mounting Type, 2017‒2031
Table 11: North America Capacitor Market Value (US$ Bn) Forecast, by Voltage, 2017‒2031
Table 12: North America Capacitor Market Volume (Million Units) Forecast, by Voltage, 2017‒2031
Table 13: North America Capacitor Market Value (US$ Bn) Forecast, by End-use Industry, 2017‒2031
Table 14: North America Capacitor Market Value (US$ Bn) Forecast, by Country & Sub-region, 2017‒2031
Table 15: Europe Capacitor Market Value (US$ Bn) Forecast, by Product Type, 2017‒2031
Table 16: Europe Capacitor Market Volume (Million Units) Forecast, by Product Type, 2017‒2031
Table 17: Europe Capacitor Market Value (US$ Bn) Forecast, by Mounting Type, 2017‒2031
Table 18: Europe Capacitor Market Value (US$ Bn) Forecast, by Voltage, 2017‒2031
Table 19: Europe Capacitor Market Volume (Million Units) Forecast, by Voltage, 2017‒2031
Table 20: Europe Capacitor Market Value (US$ Bn) Forecast, by End-use Industry, 2017‒2031
Table 21: Europe Capacitor Market Value (US$ Bn) Forecast, by Country & Sub-region, 2017‒2031
Table 22: Asia Pacific Capacitor Market Value (US$ Bn) Forecast, by Product Type, 2017‒2031
Table 23:Asia Pacific Capacitor Market Volume (Million Units) Forecast, by Product Type, 2017‒2031
Table 24: Asia Pacific Capacitor Market Value (US$ Bn) Forecast, by Mounting Type, 2017‒2031
Table 25: Asia Pacific Capacitor Market Value (US$ Bn) Forecast, by Voltage, 2017‒2031
Table 26: Asia Pacific Capacitor Market Volume (Million Units) Forecast, by Voltage, 2017‒2031
Table 27: Asia Pacific Capacitor Market Value (US$ Bn) Forecast, by End-use Industry, 2017‒2031
Table 28: Asia Pacific Capacitor Market Value (US$ Bn) Forecast, by Country & Sub-region, 2017‒2031
Table 29: Middle East & Africa Capacitor Market Value (US$ Bn) Forecast, by Product Type, 2017‒2031
Table 30: Middle East & Africa Capacitor Market Volume (Million Units) Forecast, by Product Type, 2017‒2031
Table 31: Middle East & Africa Capacitor Market Value (US$ Bn) Forecast, by Mounting Type, 2017‒2031
Table 32: Middle East & Africa Capacitor Market Value (US$ Bn) Forecast, by Voltage, 2017‒2031
Table 33: Middle East & Africa Capacitor Market Volume (Million Units) Forecast, by Voltage, 2017‒2031
Table 34: Middle East & Africa Capacitor Market Value (US$ Bn) Forecast, by End-use Industry, 2017‒2031
Table 35: Middle East & Africa Capacitor Market Value (US$ Bn) Forecast, by Country & Sub-region, 2017‒2031
Table 36: South America Capacitor Market Value (US$ Bn) Forecast, by Product Type, 2017‒2031
Table 37: South America Capacitor Market Volume (Million Units) Forecast, by Product Type, 2017‒2031
Table 38: South America Capacitor Market Value (US$ Bn) Forecast, by Mounting Type, 2017‒2031
Table 39: South America Capacitor Market Value (US$ Bn) Forecast, by Voltage, 2017‒2031
Table 40: South America Capacitor Market Volume (Million Units) Forecast, by Voltage, 2017‒2031
Table 41: South America Capacitor Market Value (US$ Bn) Forecast, by End-use Industry, 2017‒2031
Table 42: South America Capacitor Market Value (US$ Bn) Forecast, by Country & Sub-region, 2017‒2031
List of Figures
Figure 01: Global Capacitor Market Share Analysis, by Region, 2022 and 2031
Figure 02: Global Capacitor Price Trend Analysis (Average Price, US$ Thousand)
Figure 03: Global Capacitor Market Size & Forecast, Value (US$ Bn), 2017-2031
Figure 04: Global Capacitor Market Size & Forecast, Volume (Million Units), 2017-2031
Figure 05: Global Capacitor Market, Year-on-Year Growth, Global Overview, 2018-2031
Figure 06: Global Capacitor Market Projections by Product Type, Value (US$ Bn), 2017-2031
Figure 07: Global Capacitor Market, Incremental Opportunity, by Product Type, Value (US$ Mn ), 2022-2031
Figure 08: Global Capacitor Market Share Analysis, by Product Type, 2022 and 2031
Figure 09: Global Capacitor Market Projections by Mounting Type, Value (US$ Bn), 2017-2031
Figure 10: Global Capacitor Market, Incremental Opportunity, by Mounting Type, Value (US$ Bn), 2022-2031
Figure 11: Global Capacitor Market Share Analysis, by Mounting Type, 2022 and 2031
Figure 12: Global Capacitor Market Projections by Voltage, Value (US$ Mn ), 2017-2031
Figure 13: Global Capacitor Market, Incremental Opportunity, by Voltage, Value (US$ Mn ), 2022-2031
Figure 14: Global Capacitor Market Share Analysis, by Voltage, 2022 and 2031
Figure 15: Global Capacitor Market Projections by End-use Industry, Value (US$ Bn), 2017-2031
Figure 16: Global Capacitor Market, Incremental Opportunity, by End-use Industry, Value (US$ Bn), 2022-2031
Figure 17: Global Capacitor Market Share Analysis, by End-use Industry, 2022 and 2031
Figure 18: Global Capacitor Market Projections by Region, Value (US$ Bn), 2017-2031
Figure 19: Global Capacitor Market, Incremental Opportunity, by Region, Value (US$ Bn), 2022-2031
Figure 20: Global Capacitor Market Share Analysis, by Region, 2022 and 2031
Figure 21: North America Capacitor Market Size & Forecast, Value (US$ Bn), 2017-2031
Figure 22: North America Capacitor Market Size & Forecast, Volume (Million Units), 2017-2031
Figure 23: North America Capacitor Market, Year-on-Year Growth, North America Overview, 2018-2031
Figure 24: North America Capacitor Market Projections by Product Type, Value (US$ Bn), 2017-2031
Figure 25: North America Capacitor Market, Incremental Opportunity, by Product Type, Value (US$ Mn ), 2022-2031
Figure 26: North America Capacitor Market Share Analysis, by Product Type, 2022 and 2031
Figure 27: North America Capacitor Market Projections by Mounting Type, Value (US$ Bn), 2017-2031
Figure 28: North America Capacitor Market, Incremental Opportunity, by Mounting Type, Value (US$ Bn), 2022-2031
Figure 29: North America Capacitor Market Share Analysis, by Mounting Type, 2022 and 2031
Figure 30: North America Capacitor Market Projections by Voltage, Value (US$ Mn ), 2017-2031
Figure 31: North America Capacitor Market, Incremental Opportunity, by Voltage, Value (US$ Mn ), 2022-2031
Figure 32: North America Capacitor Market Share Analysis, by Voltage, 2022 and 2031
Figure 33: North America Capacitor Market Projections by End-use Industry, Value (US$ Bn), 2017-2031
Figure 34: North America Capacitor Market, Incremental Opportunity, by End-use Industry, Value (US$ Bn), 2022-2031
Figure 35: North America Capacitor Market Share Analysis, by End-use Industry, 2022 and 2031
Figure 36: North America Capacitor Market Projections by Country and Sub-region, Value (US$ Bn), 2017-2031
Figure 37: North America Capacitor Market, Incremental Opportunity, by Country and Sub-region, Value (US$ Bn), 2022-2031
Figure 38: North America Capacitor Market Share Analysis, by Country and Sub-region, 2022 and 2031
Figure 39: Europe Capacitor Market Size & Forecast, Value (US$ Bn), 2017-2031
Figure 40: Europe Capacitor Market Size & Forecast, Volume (Million Units), 2017-2031
Figure 41: Europe Capacitor Market, Year-on-Year Growth, Europe Overview, 2018-2031
Figure 42: Europe Capacitor Market Projections by Product Type, Value (US$ Bn), 2017-2031
Figure 43: Europe Capacitor Market, Incremental Opportunity, by Product Type, Value (US$ Mn ), 2022-2031
Figure 44: Europe Capacitor Market Share Analysis, by Product Type, 2022 and 2031
Figure 45: Europe Capacitor Market Projections by Mounting Type, Value (US$ Bn), 2017-2031
Figure 46: Europe Capacitor Market, Incremental Opportunity, by Mounting Type, Value (US$ Bn), 2022-2031
Figure 47: Europe Capacitor Market Share Analysis, by Mounting Type, 2022 and 2031
Figure 48: Europe Capacitor Market Projections by Voltage, Value (US$ Mn ), 2017-2031
Figure 49: Europe Capacitor Market, Incremental Opportunity, by Voltage, Value (US$ Mn ), 2022-2031
Figure 50: Europe Capacitor Market Share Analysis, by Voltage, 2022 and 2031
Figure 51: Europe Capacitor Market Projections by End-use Industry, Value (US$ Bn), 2017-2031
Figure 52: Europe Capacitor Market, Incremental Opportunity, by End-use Industry, Value (US$ Bn), 2022-2031
Figure 53: Europe Capacitor Market Share Analysis, by End-use Industry, 2022 and 2031
Figure 54: Europe Capacitor Market Projections by Country and Sub-region, Value (US$ Bn), 2017-2031
Figure 55: Europe Capacitor Market, Incremental Opportunity, by Country and Sub-region, Value (US$ Bn), 2022-2031
Figure 56: Europe Capacitor Market Share Analysis, by Country and Sub-region, 2022 and 2031
Figure 57: Asia Pacific Capacitor Market Size & Forecast, Value (US$ Bn), 2017-2031
Figure 58: Asia Pacific Capacitor Market Size & Forecast, Volume (Million Units), 2017-2031
Figure 59: Asia Pacific Capacitor Market, Year-on-Year Growth, Asia Pacific Overview, 2018-2031
Figure 60: Asia Pacific Capacitor Market Projections by Product Type, Value (US$ Bn), 2017-2031
Figure 61: Asia Pacific Capacitor Market, Incremental Opportunity, by Product Type, Value (US$ Mn ), 2022-2031
Figure 62: Asia Pacific Capacitor Market Share Analysis, by Product Type, 2022 and 2031
Figure 63: Asia Pacific Capacitor Market Projections by Mounting Type, Value (US$ Bn), 2017-2031
Figure 64: Asia Pacific Capacitor Market, Incremental Opportunity, by Mounting Type, Value (US$ Bn), 2022-2031
Figure 65: Asia Pacific Capacitor Market Share Analysis, by Mounting Type, 2022 and 2031
Figure 66: Asia Pacific Capacitor Market Projections by Voltage, Value (US$ Mn ), 2017-2031
Figure 67: Asia Pacific Capacitor Market, Incremental Opportunity, by Voltage, Value (US$ Mn ), 2022-2031
Figure 68: Asia Pacific Capacitor Market Share Analysis, by Voltage, 2022 and 2031
Figure 69: Asia Pacific Capacitor Market Projections by End-use Industry, Value (US$ Bn), 2017-2031
Figure 70: Asia Pacific Capacitor Market, Incremental Opportunity, by End-use Industry, Value (US$ Bn), 2022-2031
Figure 71: Asia Pacific Capacitor Market Share Analysis, by End-use Industry, 2022 and 2031
Figure 72: Asia Pacific Capacitor Market Projections by Country and Sub-region, Value (US$ Bn), 2017-2031
Figure 73: Asia Pacific Capacitor Market, Incremental Opportunity, by Country and Sub-region, Value (US$ Bn), 2022-2031
Figure 74: Asia Pacific Capacitor Market Share Analysis, by Country and Sub-region, 2022 and 2031
Figure 75: Middle East & Africa Capacitor Market Size & Forecast, Value (US$ Bn), 2017-2031
Figure 76: Middle East & Africa Capacitor Market Size & Forecast, Volume (Million Units), 2017-2031
Figure 77: Middle East & Africa Capacitor Market, Year-on-Year Growth Overview, 2018-2031
Figure 78: Middle East & Africa Capacitor Market Projections by Product Type, Value (US$ Bn), 2017-2031
Figure 79: Middle East & Africa Capacitor Market, Incremental Opportunity, by Product Type, Value (US$ Mn ), 2022-2031
Figure 80: Middle East & Africa Capacitor Market Share Analysis, by Product Type, 2022 and 2031
Figure 81: Middle East & Africa Capacitor Market Projections by Mounting Type, Value (US$ Bn), 2017-2031
Figure 82: Middle East & Africa Capacitor Market, Incremental Opportunity, by Mounting Type, Value (US$ Bn), 2022-2031
Figure 83: Middle East & Africa Capacitor Market Share Analysis, by Mounting Type, 2022 and 2031
Figure 84: Middle East & Africa Capacitor Market Projections by Voltage, Value (US$ Mn ), 2017-2031
Figure 85: Middle East & Africa Capacitor Market, Incremental Opportunity, by Voltage, Value (US$ Mn ), 2022-2031
Figure 86: Middle East & Africa Capacitor Market Share Analysis, by Voltage, 2022 and 2031
Figure 87: Middle East & Africa Capacitor Market Projections by End-use Industry, Value (US$ Bn), 2017-2031
Figure 88: Middle East & Africa Capacitor Market, Incremental Opportunity, by End-use Industry, Value (US$ Bn), 2022-2031
Figure 89: Middle East & Africa Capacitor Market Share Analysis, by End-use Industry, 2022 and 2031
Figure 90: Middle East & Africa Capacitor Market Projections by Country and Sub-region, Value (US$ Bn), 2017-2031
Figure 91: Middle East & Africa Capacitor Market, Incremental Opportunity, by Country and Sub-region, Value (US$ Bn), 2022-2031
Figure 92: Middle East & Africa Capacitor Market Share Analysis, by Country and Sub-region, 2022 and 2031
Figure 93: South America Capacitor Market Size & Forecast, Value (US$ Bn), 2017-2031
Figure 94: South America Capacitor Market Size & Forecast, Volume (Million Units), 2017-2031
Figure 95: South America Capacitor Market, Year-on-Year Growth Overview, 2018-2031
Figure 96: South America Capacitor Market Projections by Product Type, Value (US$ Bn), 2017-2031
Figure 97: South America Capacitor Market, Incremental Opportunity, by Product Type, Value (US$ Mn ), 2022-2031
Figure 98: South America Capacitor Market Share Analysis, by Product Type, 2022 and 2031
Figure 99: South America Capacitor Market Projections by Mounting Type, Value (US$ Bn), 2017-2031
Figure 100: South America Capacitor Market, Incremental Opportunity, by Mounting Type, Value (US$ Bn), 2022-2031
Figure 101: South America Capacitor Market Share Analysis, by Mounting Type, 2022 and 2031
Figure 102: South America Capacitor Market Projections by Voltage, Value (US$ Mn ), 2017-2031
Figure 103: South America Capacitor Market, Incremental Opportunity, by Voltage, Value (US$ Mn ), 2022-2031
Figure 104: South America Capacitor Market Share Analysis, by Voltage, 2022 and 2031
Figure 105: South America Capacitor Market Projections by End-use Industry, Value (US$ Bn), 2017-2031
Figure 106: South America Capacitor Market, Incremental Opportunity, by End-use Industry, Value (US$ Bn), 2022-2031
Figure 107: South America Capacitor Market Share Analysis, by End-use Industry, 2022 and 2031
Figure 108: South America Capacitor Market Projections by Country and Sub-region, Value (US$ Bn), 2017-2031
Figure 109: South America Capacitor Market, Incremental Opportunity, by Country and Sub-region, Value (US$ Bn), 2022-2031
Figure 110: South America Capacitor Market Share Analysis, by Country and Sub-region, 2022 and 2031
Copyright © Transparency Market Research, Inc. All Rights reserved
Trust Online

Capacitor Market