
Reports
Reports
The global bioreactors and fermenters market is estimated to expand at a CAGR of 12.2% during the forecast period, 2016-2024. Thus, the market is estimated to gain a valuation of US$ 4,461.0 Mn by 2024.
Bioreactors and fermenters are widely utilized in the creation of appropriate environment for the microorganisms’ growth. Furthermore, these devices are also useful in driving biochemically active substances created by such organisms. Fermenters find application in the development and maintenance of fungal or bacterial cells in a controlled atmosphere. Bioreactors are the bigger versions of fermenters that are extensively used in the biopharmaceutical industry for the production of biologics including recombinant proteins, vaccines, and monoclonal antibodies.
A research report by Transparency Market Research (TMR) gives in-depth analysis of many crucial factors impacting the growth of the bioreactors and fermenters market. Thus, readers gain complete assessment on growth drivers, restraints, challenges, trends, and expansion opportunities in the market for bioreactors and fermenters.
Analysts of the study by TMR have performed the segmentation of the global bioreactors and fermenters market based on many important parameters such as product type, process, end-user, and region. In terms of product type, the market is classified into single-use bioreactors and multiple-use bioreactors. Moreover, the market is divided into continuous, fed batch, and batch on the basis of process.
Due to many factors such as unhealthy eating habits and sedentary lifestyles, there is rise in the number of health issues across the globe. This situation has resulted into increasing the requirement for personalized medicines, biologics, and drugs for orphan diseases, which is creating sales prospects in the global bioreactors and fermenters market. Moreover, the market is being driven by increase in demand for bioreactors and fermenters by varied end-users such as CROs, academic & research institutes, and biopharmaceutical companies.
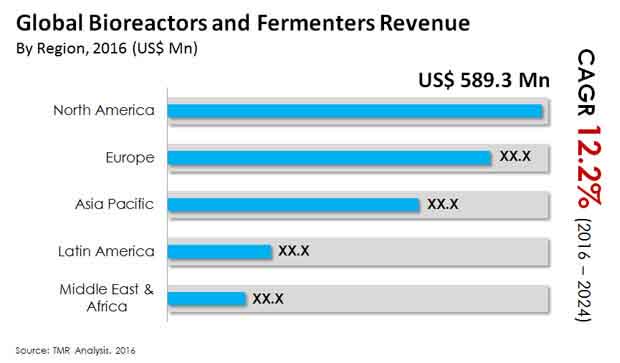
Various key regions supporting the growth of the global bioreactors and fermenters industry are North America, Europe, Asia Pacific, Latin America, and the Middle East and Africa. Among all, Europe and North America are prominent regions holding 62% share of the global market for bioreactors and fermenters.
Some of the key factors making North America a dominating region include increasing use of single-use disposable bioreactors and rise in the adoption of advanced technologies in the bio-processing systems. Moreover, the regional market is prognosticated to experience higher growth prospects on the back of existence of many well-entrenched bioprocessing equipment producers and biopharmaceutical enterprises in the region.
Asia Pacific is estimated to provide lucrative prospects in the bioreactors and fermenters market owing to many factors such as presence of several emerging economies in the region. Moreover, increase in investments by international level biopharmaceutical enterprises and contract manufacturers is likely to bode well with the regional market growth in the years to come.
The global bioreactors and fermenters market is fragmented in nature. Presence of many well-established companies represents intense level of competition in the market. Thus to sustain in this competition, enterprises are utilizing strategies such as collaborations and acquisitions.
Many players in the bioreactors and fermenters industry are increasing investments in R&D projects, which are focused on the introduction of break-through features in their existing products. Besides, several companies are focused on the launch of next-gen products. Such efforts are likely to generate promising business prospects in the bioreactors and fermenters market in the upcoming years.
Some of the key players operating in the global bioreactors and fermenters market include Applikon Biotechnology B.V., Finesse Solutions, Inc., Danaher Corporation, PBS Biotech, Inc., Eppendorf AG, Sartorius AG, GE Healthcare, ZETA Holding GmbH, PIERRE GUERIN TECHNOLOGIES, Solaris Biotechnology srl, Merck KGaA, and Thermo Fisher Scientific Inc.
Bioreactors and fermenters market is estimated to gain a valuation of US$ 4,461.0 Mn by 2024
Bioreactors and fermenters market is estimated to expand at a CAGR of 12.2% during the forecast period, 2016-2024
Bioreactors and fermenters market is driven by increased prevalence of chronic diseases
Asia Pacific is estimated to provide lucrative prospects in the bioreactors and fermenters market owing to many factors such as presence of several emerging economies in the region
Key players operating in the global bioreactors and fermenters market include Applikon Biotechnology B.V., Finesse Solutions, Inc., Danaher Corporation, PBS Biotech, Inc., Eppendorf AG, Sartorius AG, GE Healthcare
1. Preface
1.1. Market Definition and Scope
1.2. Market Segmentation
1.3. Key Research Objectives
1.4. Research Highlights
2. Assumptions and Research Methodology
3. Executive Summary : Global Bioreactors and Fermenters Market
4. Market Overview
4.1. Introduction
4.2. Overview
4.3. Market Dynamics
4.3.1. Drivers
4.3.2. Restraints
4.3.3. Opportunity
4.4. Global Bioreactors and Fermenters Market Analysis and Forecasts, 2016–2024
4.4.1. Market Volume Projections
4.5. Bioreactors and Fermenters Market - Global Supply Demand Scenario
4.6. Porter’s Five Force Analysis
4.7. Value Chain Analysis
4.7.1. List of active market participants
4.8. Market Outlook
5. Global Bioreactors and Fermenters Market Analysis and Forecasts, By Product
5.1. Introduction & Definition
5.2. Key Findings / Developments
5.3. Key Trends
5.4. Market Value Forecast By Product
5.4.1. Single-use bioreactors
5.4.2. Multi-use bioreactors
5.5. Market Attractiveness By Product
6. Global Bioreactors and Fermenters Market Analysis and Forecasts, By Process
6.1. Introduction & Definition
6.2. Key Findings / Developments
6.3. Key Trends
6.4. Market Value Forecast By Process
6.4.1. Fed batch
6.4.2. Continuous
6.4.3. Batch
6.5. Market Attractiveness By Process
7. Global Bioreactors and Fermenters Market Analysis and Forecasts, By End-User
7.1. Introduction & Definition
7.2. Key Findings / Developments
7.3. Key Trends
7.4. Market Value Forecast By End-User
7.4.1. Biopharmaceutical companies
7.4.2. CROs
7.4.3. Academic & Research Institutes
7.5. Market Attractiveness By End-User
8. Global Bioreactors and Fermenters Market Analysis and Forecasts, By Region
8.1. Key Findings
8.2. Market Value Forecast By Region
8.2.1. North America
8.2.2. Europe
8.2.3. Asia Pacific
8.2.4. Latin America
8.2.5. Middle East and Africa
8.3. Market Attractiveness By Country/Region
9. North America Bioreactors and Fermenters Market Analysis and Forecast
9.1. Introduction
9.1.1. Key Findings
9.1.2. Key Trends
9.2. Market Value Forecast By Product
9.2.1. Single-use bioreactors
9.2.2. Multi-use bioreactors
9.3. Market Value Forecast By Process
9.3.1. Fed batch
9.3.2. Continuous
9.3.3. Batch
9.4. Market Value Forecast By End-User
9.4.1. Biopharmaceutical companies
9.4.2. CROs
9.4.3. Academic & Research Institutes
9.5. Market Value Forecast By Country
9.5.1. U.S.
9.5.2. Canada
9.6. Market Attractiveness Analysis
10. Europe Bioreactors and Fermenters Market Analysis and Forecast
10.1. Introduction
10.1.1. Key Findings
10.1.2. Key Trends
10.2. Market Value Forecast By Product
10.2.1. Single-use bioreactors
10.2.2. Multi-use bioreactors
10.3. Market Value Forecast By Process
10.3.1. Fed batch
10.3.2. Continuous
10.3.3. Batch
10.4. Market Value Forecast By End-User , 2014–2024
10.4.1. Biopharmaceutical companies
10.4.2. CROs
10.4.3. Academic & Research Institutes
10.5. Market Value Forecast By Country , 2014–2024
10.5.1. Germany
10.5.2. France
10.5.3. U.K.
10.5.4. Rest of Europe
10.6. Market Attractiveness Analysis
11. Asia Pacific Bioreactors and Fermenters Market Analysis and Forecast
11.1. Introduction
11.1.1. Key Findings
11.1.2. Key Trends
11.2. Market Value Forecast By Product
11.2.1. Single-use bioreactors
11.2.2. Multi-use bioreactors
11.3. Market Value Forecast By Process
11.3.1. Fed batch
11.3.2. Continuous
11.3.3. Batch
11.4. Market Value Forecast By End-User
11.4.1. Biopharmaceutical companies
11.4.2. CROs
11.4.3. Academic & Research Institutes
11.5. Market Value Forecast By Country
11.5.1. Japan
11.5.2. China
11.5.3. India
11.5.4. Australia
11.5.5. Rest of Asia Pacific
11.6. Market Attractiveness Analysis
12. Latin America Bioreactors and Fermenters Market Analysis and Forecast
12.1. Introduction
12.1.1. Key Findings
12.1.2. Key Trends
12.2. Market Value Forecast By Product
12.2.1. Single-use bioreactors
12.2.2. Multi-use bioreactors
12.3. Market Value Forecast By Process
12.3.1. Fed batch
12.3.2. Continuous
12.3.3. Batch
12.4. Market Value Forecast By End-User
12.4.1. Biopharmaceutical companies
12.4.2. CROs
12.4.3. Academic & Research Institutes
12.5. Market Value Forecast By Country
12.5.1. Brazil
12.5.2. Mexico
12.5.3. Rest of Latin America
12.6. Market Attractiveness Analysis
13. Middle East and Africa Bioreactors and Fermenters Market Analysis and Forecast
13.1. Introduction
13.1.1. Key Findings
13.1.2. Key Trends
13.2. Market Value Forecast By Product
13.2.1. Single-use bioreactors
13.2.2. Multi-use bioreactors
13.3. Market Value Forecast By Process
13.3.1. Fed batch
13.3.2. Continuous
13.3.3. Batch
13.4. Market Value Forecast By End-User
13.4.1. Biopharmaceutical companies
13.4.2. CROs
13.4.3. Academic & Research Institutes
13.5. Market Value Forecast By Country
13.5.1. Saudi Arabia
13.5.2. South Africa
13.5.3. Rest of MEA
13.6. Market Attractiveness Analysis
14. Competition Landscape
14.1. Market Player – Competition Matrix (By Tier and Size of companies)
14.2. Market Share Analysis By Company (2015)
14.3. Company Profiles (Details – Overview, Financials, Recent Developments, Strategy)
14.3.1. Applikon Biotechnology B.V.
14.3.1.1. Company Overview (HQ, Business Segments, Employee Strength)
14.3.1.2. Business Overview
14.3.1.3. Product Portfolio
14.3.1.4. Financial Overview
14.3.1.5. SWOT Analysis
14.3.1.6. Strategic overview
14.3.2. Danaher Corporation
14.3.2.1. Company Overview (HQ, Business Segments, Employee Strength)
14.3.2.2. Business Overview
14.3.2.3. Product Portfolio
14.3.2.4. Financial Overview
14.3.2.5. SWOT Analysis
14.3.2.6. Strategic overview
14.3.3. Eppendorf AG
14.3.3.1. Company Overview (HQ, Business Segments, Employee Strength)
14.3.3.2. Business Overview
14.3.3.3. Product Portfolio
14.3.3.4. Financial Overview
14.3.3.5. SWOT Analysis
14.3.3.6. Strategic overview
14.3.4. Finesse Solutions, Inc.
14.3.4.1. Company Overview (HQ, Business Segments, Employee Strength)
14.3.4.2. Business Overview
14.3.4.3. Product Portfolio
14.3.4.4. Financial Overview
14.3.4.5. SWOT Analysis
14.3.4.6. Strategic overview
14.3.5. GE Healthcare
14.3.5.1. Company Overview (HQ, Business Segments, Employee Strength)
14.3.5.2. Business Overview
14.3.5.3. Product Portfolio
14.3.5.4. Financial Overview
14.3.5.5. SWOT Analysis
14.3.5.6. Strategic overview
14.3.6. Merck KGaA
14.3.6.1. Company Overview (HQ, Business Segments, Employee Strength)
14.3.6.2. Business Overview
14.3.6.3. Product Portfolio
14.3.6.4. Financial Overview
14.3.6.5. SWOT Analysis
14.3.6.6. Strategic overview
14.3.7. PBS Biotech, Inc.
14.3.7.1. Company Overview (HQ, Business Segments, Employee Strength)
14.3.7.2. Business Overview
14.3.7.3. Product Portfolio
14.3.7.4. Financial Overview
14.3.7.5. SWOT Analysis
14.3.7.6. Strategic overview
14.3.8. PIERRE GUERIN TECHNOLOGIES
14.3.8.1. Company Overview (HQ, Business Segments, Employee Strength)
14.3.8.2. Business Overview
14.3.8.3. Product Portfolio
14.3.8.4. Financial Overview
14.3.8.5. SWOT Analysis
14.3.8.6. Strategic overview
14.3.9. Sartorius AG
14.3.9.1. Company Overview (HQ, Business Segments, Employee Strength)
14.3.9.2. Business Overview
14.3.9.3. Product Portfolio
14.3.9.4. Financial Overview
14.3.9.5. SWOT Analysis
14.3.9.6. Strategic overview
14.3.10. SOLARIS BIOTECHNOLOGY srl
14.3.10.1. Company Overview (HQ, Business Segments, Employee Strength)
14.3.10.2. Business Overview
14.3.10.3. Product Portfolio
14.3.10.4. Financial Overview
14.3.10.5. SWOT Analysis
14.3.10.6. Strategic overview
14.3.11. Thermo Fisher Scientific Inc
14.3.11.1. Company Overview (HQ, Business Segments, Employee Strength)
14.3.11.2. Business Overview
14.3.11.3. Product Portfolio
14.3.11.4. Financial Overview
14.3.11.5. SWOT Analysis
14.3.11.6. Strategic overview
14.3.12. ZETA Holding GmbH
14.3.12.1. Company Overview (HQ, Business Segments, Employee Strength)
14.3.12.2. Business Overview
14.3.12.3. Product Portfolio
14.3.12.4. Financial Overview
14.3.12.5. SWOT Analysis
14.3.12.6. Strategic overview
List of Tables
Table 01: Global Bioreactors and Fermenters Market Size (US$ Mn) Forecast, by Product Type, 2016–2024
Table 02: Global Bioreactors and Fermenters Market Size (US$ Mn) Forecast, by Process Type, 2016–2024
Table 03: Global Bioreactors and Fermenters Market Size (US$ Mn) Forecast, by End user, 2016–2024
Table 04: Global Bioreactors and Fermenters Market Size (US$ Mn) Forecast, by Region, 2016–2024
Table 05: North America Bioreactors and Fermenters Market Size (US$ Mn) Forecast, by Product, 2016–2024
Table 06: North America Bioreactors and Fermenters Market Size (US$ Mn) Forecast, by Process, 2016–2024
Table 07: North America Bioreactors and Fermenters Market Size (US$ Mn) Forecast, by End user, 2016–2024
Table 08: North America Bioreactors and Fermenters Market Size (US$ Mn) Forecast, by Country, 2016–2024
Table 09: Europe Bioreactors and Fermenters Market Size (US$ Mn) Forecast, by Product, 2016–2024
Table 10: Europe Bioreactors and Fermenters Market Size (US$ Mn) Forecast, by Process, 2016–2024
Table 11: Europe Bioreactors and Fermenters Market Size (US$ Mn) Forecast, by End user, 2016–2024
Table 12: Europe Bioreactors and Fermenters Market Size (US$ Mn) Forecast, by Country, 2016–2024
Table 13: Asia Pacific Bioreactors and Fermenters Market Size (US$ Mn) Forecast, by Product, 2016–2024
Table 14: Asia Pacific Bioreactors and Fermenters Market Size (US$ Mn) Forecast, by Process, 2016–2024
Table 15: Asia Pacific Bioreactors and Fermenters Market Size (US$ Mn) Forecast, by End user, 2016–2024
Table 16: Asia Pacific Bioreactors and Fermenters Market Size (US$ Mn) Forecast, by Country, 2016–2024
Table 17: Latin America Bioreactors and Fermenters Market Size (US$ Mn) Forecast, by Product, 2016–2024
Table 18: Latin America Bioreactors and Fermenters Market Size (US$ Mn) Forecast, by Process, 2016–2024
Table 19: Latin America Bioreactors and Fermenters Market Size (US$ Mn) Forecast, by End user, 2016–2024
Table 20: Latin America Bioreactors and Fermenters Market Size (US$ Mn) Forecast, by Country, 2016–2024
Table 21: Middle East and Africa Bioreactors and Fermenters Market Size (US$ Mn) Forecast, by Product, 2016–2024
Table 22: Middle East and Africa Bioreactors and Fermenters Market Size (US$ Mn) Forecast, by Process, 2016–2024
Table 23: Middle East and Africa Bioreactors and Fermenters Market Size (US$ Mn) Forecast, by End user, 2016–2024
Table 24: Middle East and Africa Bioreactors and Fermenters Market Size (US$ Mn) Forecast, by Country, 2016–2024
List of Figures
Figure 01: Global Bioreactors and Fermenters Market Size (US$ Mn) Forecast, 2016–2024
Figure 02: Global Bioreactors and Fermenters Market Value Share Analysis, by Product Type, 2016 and 2024
Figure 03: Global Single-use Bioreactors Market Revenue (US$ Mn), 2015-2024
Figure 04: Global Multiple-use Bioreactors Market Revenue, US$ Mn, 2015–2024
Figure 05: Bioreactors and Fermenters Market Attractiveness Analysis By Product Type
Figure 06: Global Bioreactors and Fermenters Market Value Share Analysis By Process Type, 2016 and 2024
Figure 07: Fed batch Bioreactors Market Revenue, US$ Mn, 2014–2024
Figure 08: Global Continuous Process Bioreactors Market Revenue, US$ Mn, 2014–2024
Figure 09: Global Batch Process Bioreactors Market Revenue, US$ Mn, 2014–2024
Figure 10: Global Bioreactors and Fermenters Market Attractiveness Analysis, By Process Type
Figure 11: Global Bioreactors and Fermenters Market Value Share Analysis By End users, 2016 and 2024
Figure 12: Global Biopharmaceutical companies Market Revenue (US$ Mn), 2016–2024
Figure 13: Global CROs Market Revenue (US$ Mn), 2016–2024
Figure 14: Global Academic & Research Institutes Market Revenue (US$ Mn), 2016–2024
Figure 15: Bioreactors and Fermenters Market Attractiveness Analysis, by End user
Figure 16: Global Bioreactors and Fermenters Market Analysis By Region, 2016 and 2024
Figure 17: Global Bioreactors and Fermenters Market Attractiveness Analysis, By Region Type
Figure 18: North America Bioreactors and Fermenters Market Size (US$ Mn) Forecast, 2016–2024
Figure 19: North America Market Attractiveness Analysis By Country
Figure 20: North America Bioreactors and Fermenters Market Value Share Analysis By Product Type, 2016 and 2024
Figure 21: North America Bioreactors and Fermenters Market Value Share Analysis By Process Type, 2016 and 2024
Figure 22: North America Bioreactors and Fermenters Market Value Share Analysis By End User Type, 2016 and 2024
Figure 23: North America Market Value Share Analysis By Country, 2016 and 2024
Figure 24: North America Market Attractiveness Analysis, by Product
Figure 25: North America Market Attractiveness Analysis, by Process
Figure 26: North America Market Attractiveness Analysis, by End User
Figure 27: Europe Bioreactors and Fermenters Market Size (US$ Mn) Forecast, 2016–2024
Figure 28: Europe Market Attractiveness Analysis, by Country
Figure 29: Europe Market Value Share Analysis By Product Type, 2016 and 2024
Figure 30: Europe Market Value Share Analysis By Process Type, 2016 and 2024
Figure 31: Europe Bioreactors and Fermenters Market Value Share Analysis By End User Type, 2016 and 2024
Figure 32: Europe Market Value Share Analysis, by Country, 2016 and 2024
Figure 33: Europe Market Attractiveness Analysis, by Product
Figure 34: Europe Market Attractiveness Analysis, by Process
Figure 35: Europe Market Attractiveness Analysis, by End User
Figure 36: Asia Pacific Bioreactors and Fermenters Market Size (US$ Mn) Forecast, 2016–2024
Figure 37: Asia Pacific Market Attractiveness Analysis, by Country
Figure 38: Asia Pacific Market Value Share Analysis By Product Type, 2016 and 2024
Figure 39: Asia Pacific Market Value Share Analysis By Process Type, 2016 and 2024
Figure 40: Asia Pacific Bioreactors and Fermenters Market Value Share Analysis By End User Type, 2016 and 2024
Figure 41: Asia Pacific Market Value Share Analysis, by Country, 2016 and 2024
Figure 42: Asia Pacific Market Attractiveness Analysis, by Product
Figure 43: Asia Pacific Market Attractiveness Analysis, by Process
Figure 44: Asia Pacific Market Attractiveness Analysis, by End User
Figure 45: Latin America Bioreactors and Fermenters Market Size (US$ Mn) Forecast, 2016–2024
Figure 46: Latin America Market Attractiveness Analysis, by Country
Figure 47: Latin America Market Value Share Analysis By Product Type, 2016 and 2024
Figure 48: Latin America Market Value Share Analysis By Process Type, 2016 and 2024
Figure 49: Latin America Bioreactors and Fermenters Market Value Share Analysis By End User Type, 2016 and 2024
Figure 50: Latin America Market Value Share Analysis, by Country, 2016 and 2024
Figure 51: Latin America Market Attractiveness Analysis, by Product
Figure 52: Latin America Market Attractiveness Analysis, by Process
Figure 53: Latin America Market Attractiveness Analysis, by End User
Figure 54: Middle East and Africa Bioreactors and Fermenters Market Size (US$ Mn) Forecast, 2016–2024
Figure 55: Middle East and Africa Market Attractiveness Analysis, by Country
Figure 56: Middle East and Africa Market Value Share Analysis By Product Type, 2016 and 2024
Figure 57: Middle East and Africa Market Value Share Analysis By Process Type, 2016 and 2024
Figure 58: Middle East and Africa Bioreactors and Fermenters Market Value Share Analysis By End User Type, 2016 and 2024
Figure 59: Middle East and Africa Market Value Share Analysis, by Country, 2016 and 2024
Figure 60: Middle East and Africa Market Attractiveness Analysis, by Product
Figure 61: Middle East and Africa Market Attractiveness Analysis, by Process
Figure 62: Middle East and Africa Market Attractiveness Analysis, by End User
Figure 63: Global Bioreactors and Fermenters Market Share Analysis By Company (2015)
Copyright © Transparency Market Research, Inc. All Rights reserved
Trust Online

Bioreactors and Fermenters Market