
Reports
Reports
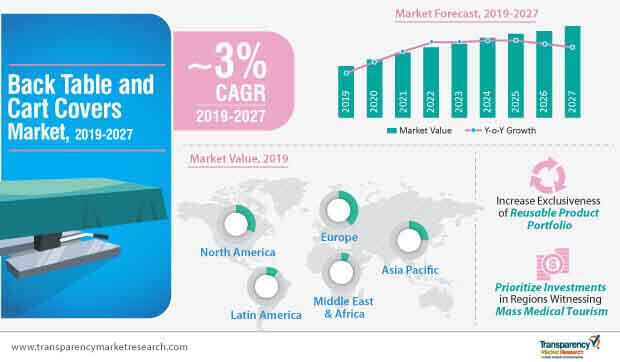
The sales of back table and cart covers will correspond to a value of ~US$ 735 Mn in 2019, representing ~2 percent y-o-y growth from 2018.
The statistical findings of an exclusive report published by Transparency Market Research (TMR) also infer that, the back table and cart covers market will continue its steady drift through to 2027, with impressive sales of back table covers prefiguring their high popularity over cart covers. Increasing consciousness regarding healthcare-associated infections (HAIs) and surgical site infections (SSIs) among hospital staff is anticipated to strengthen the demand for back table covers.
A spike in the sales of back table and cart covers can also be ascribed to the rising number of patients opting for minimally-invasive surgeries, given their benefits over traditional surgeries, such as shorter hospital stays, minimal pain, and better recovery time. With a growing patient base demanding quality care, hospitals and surgical centers operate under the pressure of creating an 'infection-free' surgical environment, meaning, long-term supply opportunities for market players in the back table and cart covers landscape.
However, on the downside, disposal concerns regarding contaminated medical supplies, including back table and cart covers, could add uncertainties to the long-term growth of the landscape. The stringent regulatory maze scrutinizing the quality of back table and cart covers is likely to present yet another hurdle for market players.
As 'green and clean' makes the new value propositions for industries, ample care is taken to ensure environmentally-benign healthcare operations, which also takes into account the bio-hazardous waste produced by hospitals, ambulatory surgical centers, and clinics. Central organizations such as the Health Care Without Harm (HCWH) are conducting programs such as medical waste management and disposal of toxic materials, with an intent to reduce environmental pollution.
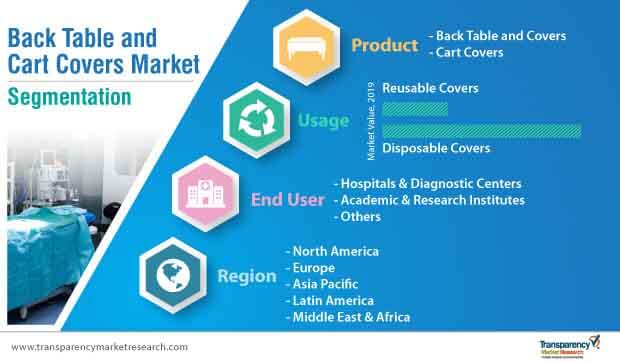
In 2019, the usage of disposable back table and cart covers manufactured from propylene, polyethylene, and polyester resins will account for ~76% of the market share, and add to environmental-sustainability concerns. Manufacturers can leverage this opportunity to recycle raw materials and shrink their disposal costs, raw material costs, and carbon footprint by partnering with institutions such as InterVol. This New York-based NGO engages in the collection of supplies, and instigates healthcare institutions to recycle and reuse them.
Yet another solution for manufacturers is to intensify their focus on the development of back table and cart covers that can be reused after sterilization. Reusable back table and cart covers currently account for a small market share, which is leading to increased manufacturing focus on tightly-woven back table and cart covers.
Manufacturers’ focus on the development of high-quality reusable back table and cart covers is underway to increase the marketability of their products. Evolving trends, with regards to the manufacturing of reusable back table and cart covers, will reflect on their adoption pace, which is projected to tantamount 3.2 percent during the forecast period.
In November 2018, the European Center for Disease Prevention and Control brought to light a staggering statistic regarding healthcare-associated infections (HAIs) in hospitals and long-term care facilities. As per the study, ~33,000 people die each year as a direct consequence of infections, and 75% of diseases is caused on account of HAIs and lack of adequate infection prevention practices. Such awareness initiatives, coupled with the call for continued action to address the spread of infections in the region, have been rendering strength to the European back table and cart covers market.
The uptick in the growth of the European market is highly powered by Germany. High standards of healthcare, including compulsion of health insurance plans, incite patients to opt for surgeries and medical care. To add to that, the country has a large hospital sector and an increasing number of fee-for-service segment of doctors that significantly prevents long waits and increases the number of surgeries, which translates into long-term opportunities for the supply of back table and cart covers.
With the adoption rate mirroring the growing emphasis on hygiene, the sales of back table and cart covers in Germany are projected to rise from a value of ~US$ 55 million in 2019 to ~US$ 70 million in 2027, corresponding to a CAGR of 2.5% during 2019-2027, and account for ~23% of the European market.
Medical Tourism to be a Game-Changer for Asia Pacific
In 2018, the sales of back table and cart covers in North America corresponded to a value of ~US$ 200 million, which was ~US$ 32 million more than that recorded in Asia Pacific. However, 2027 will be a game-changer for players in these regions.
Despite the concentration of high quality healthcare units present in the developed countries of North America and Europe, the novel concept of 'medical tourism' has brought about an epochal scale of changes in the way patients avail treatment. As a number of underlying parameters make surgeries cost-prohibitive in North America, the populace resort to medical tourism to complete their dual quest for quality and cost-effective healthcare services. In addition, limited coverage of healthcare conditions under insurance plans encourages patients to seek treatment in Asia Pacific, which is unlocking bigger and better sales opportunities for back table and cart covers manufacturers.
Perpetual improvement in the quality of care, growing focus on hygiene, and surging patient base will power an exponential growth of the back table and cart covers market in Asia Pacific, tantamount to ~4% during 2019-2027.
Key Focus Areas for Market Players
Some of the key qualities that end users seek, prior to spending on back table and cart covers, include high density, durability, antimicrobial properties, antifungal characteristics, mildew and flame resistance, odor resistance, tear/stain resistance, water resistance, heat resistance, easy access during emergencies, and transparent design. Harnessing the prowess of technology, a number of market players strive towards distinguishing their products by improving the strength, durability, permeability, and protection of drapes, cart covers, and back table covers.
For example, leading companies such as DuPont and Cardinal Health make hefty investments in research & development activities for the manufacturing of medical nonwoven disposable products and kits. Taking a cue from these global players, manufacturers can foray into the development of high quality back table and cart covers that boast multiple properties. Though disposable back table and cart covers are way more affordable for end users, manufacturers can raise awareness regarding the long-term payback opportunities offered by reusable back table and cart covers market.
Usually, bariatric surgery, cosmetic surgery, and dental treatments are excluded from medical insurance coverage, and are the very surgeries that medical tourists seek. Manufacturers can fortify efforts towards partnering with end users that offer the most sought-after surgeries and treatments in the developing countries of Asia Pacific, with intense focus on China, Japan, and India. Overall, medical supplies developed within the territories defined by regulatory bodies and by staying abreast with the fickle end users’ quest will lead to impressive exposure in the back table and cart covers market.
Global Back Table and Cart Covers Market: Market Overview
Global Back Table and Cart Covers Market: Drivers & Restraints
Global Back Table and Cart Covers Market: Regional Segmentation
Global Back Table and Cart Covers Market: Major Players
These companies have diverse portfolios of back table and cart covers, along with a strong geographic presence.
Back table and cart covers market is projected to reach ~US$ 918 Mn by 2027
Back table and cart covers market to expand at a CAGR of ~3% from 2019 to 2027
Back table and cart covers market is driven by a rise in the prevalence of hospital-acquired infections
North America accounted for a major share of the global back table and cart covers market
Key players in the global back table and cart covers market include 3M, Cardinal Health, Medline Industries, Inc., Halyard Health, SW Med-Source, David Scott Company
1. Preface
1.1. Market Definition and Scope
1.2. Market Segmentation
1.3. Key Research Objectives
1.4. Research Highlights
2. Assumptions and Research Methodology
3. Executive Summary: Global Back Table and Cart Covers Market
4. Market Overview
4.1. Introduction
4.1.1. Product Definition
4.1.2. Industry Evolution / Developments
4.2. Overview
4.3. Market Dynamics
4.3.1. Drivers
4.3.2. Restraints
4.3.3. Opportunities
4.4. Global Back Table and Cart Covers Market Analysis and Forecast, 2017–2027
4.4.1. Market Revenue Projections (US$ Mn)
5. Market Outlook
5.1. Reimbursement Scenario
5.2. Estimated Number of Procedures Performed Annually
6. Global Back Table and Cart Covers Market Analysis and Forecast, by Product
6.1. Introduction & Definition
6.2. Key Findings / Developments
6.3. Global Back Table and Cart Covers Market Value Forecast, by Product, 2017–2027
6.3.1. Back Table Covers
6.3.2. Cart Covers
6.4. Global Back Table and Cart Covers Market Attractiveness, by Product
7. Global Back Table and Cart Covers Market Analysis and Forecast, by Usage
7.1. Introduction & Definition
7.2. Key Findings / Developments
7.3. Global Back Table and Cart Covers Market Value Forecast, by Usage, 2017–2027
7.3.1. Disposables Covers
7.3.2. Reusable Covers
7.4. Global Back Table and Cart Covers Market Attractiveness, by Usage
8. Global Back Table and Cart Covers Market Analysis and Forecast, by End-user
8.1. Introduction & Definition
8.2. Key Findings / Developments
8.3. Global Back Table and Cart Covers Market Value Forecast, by End-user, 2017–2027
8.3.1. Hospitals & Diagnostic Centers
8.3.2. Academic & Research Institutes
8.3.3. Others
8.4. Global Back Table and Cart Covers Market Attractiveness, by End-user
9. Global Back Table and Cart Covers Market Analysis and Forecast, by Region
9.1. Key Findings
9.2. Global Back Table and Cart Covers Market Value Forecast, by Region
9.2.1. North America
9.2.2. Europe
9.2.3. Asia Pacific
9.2.4. Latin America
9.2.5. Middle East & Africa
9.3. Global Back Table and Cart Covers Market Attractiveness, by Region
10. North America Back Table and Cart Covers Market Analysis and Forecast
10.1. Introduction
10.1.1. Key Findings
10.2. North America Back Table and Cart Covers Market Value Share and Attractiveness and Analysis, by Country
10.3. North America Back Table and Cart Covers Market Value Forecast, by Country
10.3.1. U.S.
10.3.2. Canada
10.4. North America Back Table and Cart Covers Market Value Share and Attractiveness Analysis, by Product
10.5. North America Back Table and Cart Covers Market Forecast, by Product
10.5.1. Back Table Covers
10.5.2. Cart Covers
10.6. North America Back Table and Cart Covers Market Value Share and Attractiveness Analysis, by Usage
10.7. North America Back Table and Cart Covers Market Forecast, by Usage
10.7.1. Disposable Covers
10.7.2. Reusable Covers
10.8. North America Back Table and Cart Covers Market Value Share and Attractiveness Analysis, by End-user
10.9. North America Back Table and Cart Covers Market Forecast, by End-user
10.9.1. Hospitals & Diagnostic Centers
10.9.2. Academic & Research Institutes
10.9.3. Others
11. Europe Back Table and Cart Covers Market Analysis and Forecast
11.1. Introduction
11.1.1. Key Findings
11.2. Europe Back Table and Cart Covers Market Value Share and Attractiveness and Analysis, by Country/Sub-region
11.3. Europe Back Table and Cart Covers Market Value Forecast, by Country/Sub-region
11.3.1. Germany
11.3.2. U.K.
11.3.3. France
11.3.4. Italy
11.3.5. Spain
11.3.6. Rest of Europe
11.4. Europe Back Table and Cart Covers Market Value Share and Attractiveness Analysis, by Product
11.5. Europe Back Table and Cart Covers Market Forecast, by Product
11.5.1. Back Table Covers
11.5.2. Cart Covers
11.6. Europe Back Table and Cart Covers Market Value Share and Attractiveness Analysis, by Usage
11.7. Europe Back Table and Cart Covers Market Forecast, by Usage
11.7.1. Disposable Covers
11.7.2. Reusable Covers
11.8. Europe Back Table and Cart Covers Market Value Share and Attractiveness Analysis, by End-user
11.9. Europe Back Table and Cart Covers Market Forecast, by End-user
11.9.1. Hospitals & Diagnostic Centers
11.9.2. Academic & Research Institutes
11.9.3. Others
12. Asia Pacific Back Table and Cart Covers Market Analysis and Forecast
12.1. Introduction
12.1.1. Key Findings
12.2. Asia Pacific Back Table and Cart Covers Market Value Share and Attractiveness and Analysis, by Country/Sub-region
12.3. Asia Pacific Back Table and Cart Covers Market Value Forecast, by Country/Sub-region
12.3.1. China
12.3.2. India
12.3.3. Japan
12.3.4. Australia & New Zealand
12.3.5. Rest of Asia Pacific
12.4. Asia Pacific Back Table and Cart Covers Market Value Share and Attractiveness Analysis, by Product
12.5. Asia Pacific Back Table and Cart Covers Market Forecast, by Product
12.5.1. Back Table Covers
12.5.2. Cart Covers
12.6. Asia Pacific Back Table and Cart Covers Market Value Share and Attractiveness Analysis, by Usage
12.7. Asia Pacific Back Table and Cart Covers Market Forecast, by Usage
12.7.1. Disposable Covers
12.7.2. Reusable Covers
12.8. Asia Pacific Back Table and Cart Covers Market Value Share and Attractiveness Analysis, by End-user
12.9. Asia Pacific Back Table and Cart Covers Market Forecast, by End-user
12.9.1. Hospitals & Diagnostic Centers
12.9.2. Academic & Research Institutes
12.9.3. Others
13. Latin America Back Table and Cart Covers Market Analysis and Forecast
13.1. Introduction
13.1.1. Key Findings
13.2. Latin America Back Table and Cart Covers Market Value Share and Attractiveness and Analysis, by Country/Sub-region
13.3. Latin America Back Table and Cart Covers Market Value Forecast, by Country/Sub-region
13.3.1. Brazil
13.3.2. Mexico
13.3.3. Rest of Latin America
13.4. Latin America Back Table and Cart Covers Market Value Share and Attractiveness Analysis, by Product
13.5. Latin America Back Table and Cart Covers Market Forecast, by Product
13.5.1. Back Table Covers
13.5.2. Cart Covers
13.6. Latin America Back Table and Cart Covers Market Value Share and Attractiveness Analysis, by Usage
13.7. Latin America Back Table and Cart Covers Market Forecast, by Usage
13.7.1. Disposable Covers
13.7.2. Reusable Covers
13.8. Latin America Back Table and Cart Covers Market Value Share and Attractiveness Analysis, by End-user
13.9. Latin America Back Table and Cart Covers Market Forecast, by End-user
13.9.1. Hospitals & Diagnostic Centers
13.9.2. Academic & Research Institutes
13.9.3. Others
14. Middle East & Africa Back Table and Cart Covers Market Analysis and Forecast
14.1. Introduction
14.1.1. Key Findings
14.2. Middle East & Africa Back Table and Cart Covers Market Value Share and Attractiveness and Analysis, by Country/Sub-region
14.3. Middle East & Africa Back Table and Cart Covers Market Value Forecast, by Country/Sub-region
14.3.1. GCC Countries
14.3.2. South Africa
14.3.3. Rest of Middle East & Africa
14.4. Middle East & Africa Back Table and Cart Covers Market Value Share and Attractiveness Analysis, by Product
14.5. Middle East & Africa Back Table and Cart Covers Market Forecast, by Product
14.5.1. Back Table Covers
14.5.2. Cart Covers
14.6. Middle East & Africa Back Table and Cart Covers Market Value Share and Attractiveness Analysis, by Usage
14.7. Middle East & Africa Back Table and Cart Covers Market Forecast, by Usage
14.7.1. Disposable Covers
14.7.2. Reusable Covers
14.8. Middle East & Africa Back Table and Cart Covers Market Value Share and Attractiveness Analysis, by End-user
14.9. Middle East & Africa Back Table and Cart Covers Market Forecast, by End-user
14.9.1. Hospitals & Diagnostic Centers
14.9.2. Academic & Research Institutes
14.9.3. Others
15. Competition Landscape
15.1. Market Player - Competition Matrix (By Tier and Size of companies)
15.2. Company Profiles
15.2.1. 3M
15.2.2. Cardinal Health
15.2.3. Medline Industries, Inc.
15.2.4. Halyard Health
15.2.5. SW Med-Source
15.2.6. David Scott Company
15.2.7. Lac-Mac Limited
15.2.8. TIDI Products, LLC (RoundTable Healthcare Partners)
15.2.9. Ansell Healthcare LLC
*Note: Financial details of companies that do not provide financial information in public domain might not be captured
List of Tables
Table 01: Estimated Number of Procedures Performed Annually
Table 02: Estimated Number of Procedures Performed Annually
Table 03: Global Back Table & Cart Cover Market Value (US$ Mn) Forecast, by Product, 2017–2027
Table 04: Global Back Table & Cart Cover Market Value (US$ Mn) Forecast, by Usage, 2017–2027
Table 05: Global Back Table & Cart Cover Market Value (US$ Mn) Forecast, by End-user, 2017–2027
Table 06: North America Back Table and Cart Covers Market Value (US$ Mn) Forecast, by Country, 2017–2027
Table 07: North America Back Table and Cart Covers Value (US$ Mn) Forecast, by Product, 2017–2027
Table 08: North America Back Table and Cart Covers Value (US$ Mn) Forecast, by Usage, 2017–2027
Table 09: North America Back Table and Cart Covers Value (US$ Mn) Forecast, by End-user, 2017–2027
Table 10: Europe Back Table and Cart Covers Market Value (US$ Mn) Forecast, by Country/Sub-region, 2017–2027
Table 11: Europe Back Table and Cart Covers Value (US$ Mn) Forecast, by Product, 2017–2027
Table 12: Europe Back Table and Cart Covers Value (US$ Mn) Forecast, by Usage, 2017–2027
Table 13: Europe Back Table and Cart Covers Value (US$ Mn) Forecast, by End-user, 2017–2027
Table 14: Asia Pacific Back Table and Cart Covers Market Value (US$ Mn) Forecast, by Country/Sub-region, 2017–2027
Table 15: Asia Pacific Back Table and Cart Covers Value (US$ Mn) Forecast, by Product, 2017–2027
Table 16: Asia Pacific Back Table and Cart Covers Value (US$ Mn) Forecast, by Usage, 2017–2027
Table 17: Asia Pacific Back Table and Cart Covers Value (US$ Mn) Forecast, by End-user, 2017–2027
Table 18: Latin America Back Table and Cart Covers Market Value (US$ Mn) Forecast, by Country/Sub-region, 2017–2027
Table 19: Latin America Back Table and Cart Covers Value (US$ Mn) Forecast, by Product, 2017–2027
Table 20: Latin America Back Table and Cart Covers Value (US$ Mn) Forecast, by Usage, 2017–2027
Table 21: Latin America Back Table and Cart Covers Value (US$ Mn) Forecast, by End-user, 2017–2027
Table 22: Middle East & Africa Back Table and Cart Covers Market Value (US$ Mn) Forecast, by Country/Sub-region, 2017–2027
Table 23: Middle East & Africa Back Table and Cart Covers Value (US$ Mn) Forecast, by Product, 2017–2027
Table 24: Middle East & Africa Back Table and Cart Covers Value (US$ Mn) Forecast, by Usage, 2017–2027
Table 25: Middle East & Africa Back Table and Cart Covers Value (US$ Mn) Forecast, by End-user, 2017–2027
List of Figures
Figure 01: Global Back Table and Cart Covers Market Value (US$ Mn) and Distribution, by Region, 2018 and 2027
Figure 02: Global Back Table and Cart Covers Market Value (US$ Mn) Forecast, 2017–2027
Figure 03: Global Back Table and Cart Covers Market Value Share (%), by Product Type (2018)
Figure 04: Global Back Table and Cart Covers Market Value Share (%), by Usage (2018)
Figure 05: Global Back Table and Cart Covers Market Value Share (%), by End-user (2018)
Figure 06: Global Back Table and Cart Covers Market Value Share (%), by Region (2018)
Figure 07: Reimbursement Model in U.S.
Figure 08: Global Back Table & Cart Cover Market Value Share Analysis, by Product, 2018 and 2027
Figure 09: Global Back Table & Cart Cover Market Value (US$ Mn) and Y-o-Y Growth (%) Forecast, by Back Table Covers, 2017–2027
Figure 10: Global Back Table & Cart Cover Market Value (US$ Mn) and Y-o-Y Growth (%) Forecast, by Cart Covers, 2017–2027
Figure 11: Global Back Table & Cart Cover Market Attractiveness Analysis, by Product, 2019–2027
Figure 12: Global Back Table & Cart Cover Market Value Share Analysis, by Usage, 2018 and 2027
Figure 13: Global Back Table & Cart Cover Market Value (US$ Mn) and Y-o-Y Growth (%) Forecast, by Disposable, 2017–2027
Figure 14: Global Back Table & Cart Cover Market Value (US$ Mn) and Y-o-Y Growth (%) Forecast, by Reusable, 2017–2027
Figure 15: Global Back Table & Cart Cover Market Attractiveness Analysis, by Usage, 2019–2027
Figure 16: Global Back Table & Cart Cover Market Value Share Analysis, by End-user, 2018 and 2027
Figure 17: Global Back Table & Cart Cover Market Value (US$ Mn) and Y-o-Y Growth (%), by Hospitals & Diagnostic Centers, 2017–2027
Figure 18: Global Back Table & Cart Cover Market Value (US$ Mn) and Y-o-Y Growth (%), by Academic & Research Institutes, 2017–2027
Figure 19: Global Back Table & Cart Cover Market Value (US$ Mn) and Y-o-Y Growth (%), by Others, 2017–2027
Figure 20: Global Back Table & Cart Cover Market Attractiveness Analysis, by End-user, 2019–2027
Figure 21: North America Back Table and Cart Covers Market Value (US$ Mn) and Y-o-Y Growth (%) Forecast, 2017–2027
Figure 22: North America Back Table and Cart Covers Market Value Share (%), by Country, 2018 and 2027
Figure 23: North America Back Table and Cart Covers Market Attractiveness, by Country, 2019–2027
Figure 24: North America Back Table and Cart Covers Market Value Share (%), by Product, 2018 and 2027
Figure 25: North America Back Table and Cart Covers Market Attractiveness, by Product, 2019–2027
Figure 26: North America Back Table and Cart Covers Market Value Share (%), by Usage, 2018 and 2027
Figure 27: North America Back Table and Cart Covers Market Attractiveness, by Usage, 2019–2027
Figure 28: North America Back Table and Cart Covers Market Value Share (%), by End-user, 2018 and 2027
Figure 29: North America Back Table and Cart Covers Market Attractiveness, by End-user, 2019–2027
Figure 30: Europe Back Table and Cart Covers Market Value (US$ Mn) and Y-o-Y Growth (%) Forecast, 2017–2027
Figure 31: Europe Back Table and Cart Covers Market Value Share (%), by Country/Sub-region, 2018 and 2027
Figure 32: Europe Back Table and Cart Covers Market Attractiveness, by Country/Sub-region, 2019–2027
Figure 33: Europe Back Table and Cart Covers Market Value Share (%), by Product, 2018 and 2027
Figure 34: Europe Back Table and Cart Covers Market Attractiveness, by Product, 2019–2027
Figure 35: Europe Back Table and Cart Covers Market Value Share (%), by Usage, 2018 and 2027
Figure 36: Europe Back Table and Cart Covers Market Attractiveness, by Usage, 2019–2027
Figure 37: Europe Back Table and Cart Covers Market Value Share (%), by End-user, 2018 and 2027
Figure 38: Europe Back Table and Cart Covers Market Attractiveness, by End-user, 2019–2027
Figure 39: Asia Pacific Back Table and Cart Covers Market Value (US$ Mn) and Y-o-Y Growth (%) Forecast, 2017–2027
Figure 40: Asia Pacific Back Table and Cart Covers Market Value Share (%), by Country/Sub-region, 2018 and 2027
Figure 41: Asia Pacific Back Table and Cart Covers Market Attractiveness, by Country/Sub-region, 2019–2027
Figure 42: Asia Pacific Back Table and Cart Covers Market Value Share (%), by Product, 2018 and 2027
Figure 43: Asia Pacific Back Table and Cart Covers Market Attractiveness, by Product, 2019–2027
Figure 44: Asia Pacific Back Table and Cart Covers Market Value Share (%), by Usage, 2018 and 2027
Figure 45: Asia Pacific Back Table and Cart Covers Market Attractiveness, by Usage, 2019–2027
Figure 46: Asia Pacific Back Table and Cart Covers Market Value Share (%), by End-user, 2018 and 2027
Figure 47: Asia Pacific Back Table and Cart Covers Market Attractiveness, by End-user, 2019–2027
Figure 48: Latin America Back Table and Cart Covers Market Value (US$ Mn) and Y-o-Y Growth (%) Forecast, 2017–2027
Figure 49: Latin America Back Table and Cart Covers Market Value Share (%), by Country/Sub-region, 2018 and 2027
Figure 50: Latin America Back Table and Cart Covers Market Attractiveness, by Country/Sub-region, 2019–2027
Figure 51: Latin America Back Table and Cart Covers Market Value Share (%), by Product, 2018 and 2027
Figure 52: Latin America Back Table and Cart Covers Market Attractiveness, by Product, 2019–2027
Figure 53: Latin America Back Table and Cart Covers Market Value Share (%), by Usage, 2018 and 2027
Figure 54: Latin America Back Table and Cart Covers Market Attractiveness, by Usage, 2019–2027
Figure 55: Latin America Back Table and Cart Covers Market Value Share (%), by End-user, 2018 and 2027
Figure 56: Latin America Back Table and Cart Covers Market Attractiveness, by End-user, 2019–2027
Figure 57: Middle East & Africa Back Table and Cart Covers Market Value (US$ Mn) and Y-o-Y Growth (%) Forecast, 2017–2027
Figure 58: Middle East & Africa Back Table and Cart Covers Market Value Share (%), by Country/Sub-region, 2018 and 2027
Figure 59: Middle East & Africa Back Table and Cart Covers Market Attractiveness, by Country/Sub-region, 2019–2027
Figure 60: Middle East & Africa Back Table and Cart Covers Market Value Share (%), by Product, 2018 and 2027
Figure 61: Middle East & Africa Back Table and Cart Covers Market Attractiveness, by Product, 2019–2027
Figure 62: Middle East & Africa Back Table and Cart Covers Market Value Share (%), by Usage, 2018 and 2027
Figure 63: Middle East & Africa Back Table and Cart Covers Market Attractiveness, by Usage, 2019–2027
Figure 64: Middle East & Africa Back Table and Cart Covers Market Value Share (%), by End-user, 2018 and 2027
Figure 65: Middle East & Africa Back Table and Cart Covers Market Attractiveness, by End-user, 2019–2027
Figure 66: 3M, Revenue (US$ Bn) and Y-o-Y Growth (%), 2015–2018
Figure 67: 3M, Research & Development Expenses (US$ Mn), 2016–2018
Figure 68: 3M, Breakdown of Net Sales (%), by Business Segment, 2018
Figure 69: 3M, Breakdown of Net Sales (%), by Region, 2018
Figure 70: Cardinal Health, Revenue (US$ Bn) and Y-o-Y Growth (%), 2015–2018
Figure 71: Cardinal Health, Segment Profit (US$ Bn), 2016–2018
Figure 72: Cardinal Health, Breakdown of Net Sales (%), by Business Segment, 2018
Figure 73: Cardinal Health, Breakdown of Net Sales (%), by Region, 2018
Figure 74: Halyard Health, Revenue (US$ Mn) and Y-o-Y Growth (%), 2017–2018
Figure 75: Halyard Health, Research and Development Expenses (US$ Mn), 2017–2018
Figure 76: Halyard Health, Breakdown of Net Sales (%), by Business Segment, 2017
Figure 77: Halyard Health, Research & Development Expenses (US$ Mn), 2016–2017
Figure 78: Halyard Health, Breakdown of Net Sales (%), by Region, 2017
Copyright © Transparency Market Research, Inc. All Rights reserved
Trust Online

Back Table and Cart Covers Market