
Reports
Reports
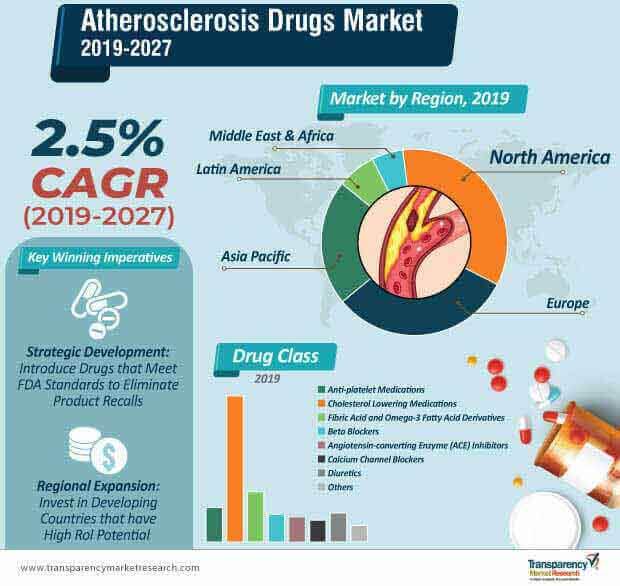
Despite the prevalence of diabetes and cholesterol among a wide patient pool, the atherosclerosis drugs market will move at a sluggish CAGR of 2.5% during the forecast period, finds a recently published report by Transparency Market Research (TMR).
This market growth is attributable to the high consumption of cholesterol-lowering drugs by patients to reduce blockages in arteries. A sedentary, yet, demanding lifestyle instigates consumers to opt for quick dietary choices, which will catalyze revenue streams to the atherosclerosis drugs landscape.
To add to that, government initiatives at a global level have played a crucial role in improving the quality of healthcare services and infrastructure, which has been encouraging pharmaceutical companies to develop effective drugs for the treatment of various diseases. The effectiveness of drugs coupled with their easy availability through streamlined distribution channels has been complementing the sales of atherosclerosis drugs. Analyzing the current and the future growth scope, the TMR study opines that, the atherosclerosis drugs market will register a value tantamount to ~US$ 57.4 Bn by 2027.
In March 2019, the U.S. Food and Drug Administration approved a novel generic drug of Diovan to bridge the high demand and low supply gap of this critical drug, on account of multiple recalls of valsartan products manufactured by several brands. After two months, Zydus Cadila announced that it has received approval for Chlorthalidone, a generic version of Thalitone produced by Pfizer.
These and many companies have scrambled towards the development of generic drugs to offer the near-same benefits of branded drugs at a low cost. The rapid rise in the penetration of generic drugs in parallel to increasing awareness among consumers about the cost benefits of these drugs is likely to curb the growth potential of the atherosclerosis drugs market.
Also, heart strokes and cardiovascular dysfunction are the symptoms associated with atherosclerosis conditions, which could lead to sudden death. On account of the severity of these symptoms, the survival rate is low among patients, which reduces the diagnosis percentage of atherosclerosis.
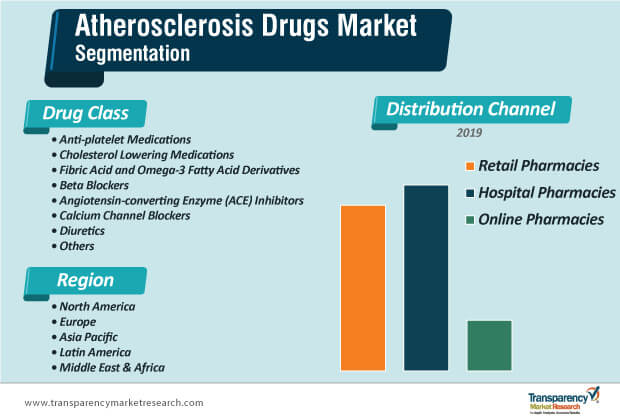
According to the statistical data of the TMR study, retail pharmacies will grow as the key point-of-sales channel for atherosclerosis drugs, as they are established at even the remotest of locations, thereby making it convenient for consumers to present prescriptions and purchase drugs. In addition, retail pharmacists offer a more consultative role regarding the route of administration and possible side effects of drugs. Retail pharmacies have the presence of several brands, which makes them a suitable purchase point for patients. However, hospital pharmacists operate in a more clinic-oriented manner by having significant contact with doctors and nurses, and they manage their inventories with only specific brands.
By 2027, players in the atherosclerosis drugs market can look at sales through retail pharmacies to a value tantamount to ~US$ 24 Bn.
Analysts’ Take on Atherosclerosis Drugs Market
Analyzing the impact of the drivers and restraints influencing the future of the atherosclerosis drugs market, analysts of the TMR study anticipate slow, yet, steady growth during the forecast period. While favorable government policies and impressive strides of the healthcare industry are projected to foster the leaps of the North American atherosclerosis drugs market, Asia Pacific will grow at an accelerated pace during the forecast period.
An investment made towards the development of novel drugs with a keen eye on their effectiveness will help in developing a weighted product portfolio. In addition, the convergence of e-Commerce and the healthcare sector will create high sales opportunities through online pharmacies for players operating in the atherosclerosis drugs market during the forecast period.
Atherosclerosis Drugs Market: Overview
Increase in Prevalence of Atherosclerosis & Cardiovascular Diseases and Awareness About Cardiovascular Diseases: Key Drivers
Atherosclerosis Drugs Market: Development of New Treatments
Availability of Generic Drugs Hampers Atherosclerosis Drugs Market
Global Atherosclerosis Drugs Market: Competition Landscape
Global Atherosclerosis Drugs Market: Key Developments
Key players in the global atherosclerosis drugs market are engaged in the development of new products and approvals, mergers & acquisitions, and collaborations. Major developments by key players are likely to fuel the expansion of the global atherosclerosis drugs market. Some of the growth strategies adopted by players in the atherosclerosis drugs market as follows:
In January 2017, Novartis AG signed a collaborative deal with its subsidiary, Akcea Therapeutics and Ionis Pharmaceuticals, for cardiovascular products
The global atherosclerosis drugs market was worth US$ 45.7 Bn and is projected to reach a value of US$ 57.4 Bn by the end of 2027
Atherosclerosis drugs market is anticipated to grow at a CAGR of 2.5% during the forecast period
North America and Western Europe accounted for a major share of the global atherosclerosis drugs market
Atherosclerosis drugs market is driven by rising prevalence of atherosclerosis and cardiovascular disease, and development of new treatments are anticipated to drive the global market
Key players in the global atherosclerosis drugs market include GlaxoSmithKline Plc, Sanofi, F. Hoffmann-La Roche Ltd, Bayer AG, Novartis AG, Merck & Co., Inc. (Merck Sharp & Dohme Corp), Janssen Pharmaceuticals, Inc. (Johnson & Johnson), Mylan N.V., Amgen Inc., Pfizer, Inc.
1. Preface
1.1. Market Definition and Scope
1.2. Market Segmentation
1.3. Key Research Objectives
1.4. Research Highlights
2. Assumptions and Research Methodology
3. Executive Summary : Global Atherosclerosis Drugs Market
4. Market Overview
4.1. Introduction
4.1.1. Drug Type Definition
4.1.2. Industry Evolution / Developments
4.2. Overview
4.3. Market Dynamics
4.3.1. Drivers
4.3.1.1. Increase in Prevalence of Atherosclerosis & Cardiovascular Diseases
4.3.1.2. Development of New Treatments
4.3.1.3. Rising Awareness about Cardiovascular Diseases
4.3.2. Restraints
4.3.2.1. Availability of Generic Products
4.3.2.2. Low Diagnostic Rate
4.3.3. Opportunities
4.4. Global Atherosclerosis Drugs Market Analysis and Forecast, 2017–2027
5. Market Outlook
5.1. Clinical Trial Pipeline Analysis
5.2. Disease Prevalence & Incidence Rate globally with key countries
5.3. Brand Analysis
6. Global Atherosclerosis Drugs Market Analysis and Forecast, By Drug Class
6.1. Introduction & Definition
6.1.1. Key Findings / Developments
6.2. Global Atherosclerosis Drugs Market Revenue (US$ Mn) Forecast, by Drug Class, 2017–2027
6.2.1. Anti-platelet Medications
6.2.2. Cholesterol Lowering Medications
6.2.3. Fibric Acid and Omega-3 Fatty Acid Derivatives
6.2.4. Beta Blockers
6.2.5. Angiotensin-Converting Enzyme (ACE) Inhibitors
6.2.6. Calcium Channel Blockers
6.2.7. Diuretics
6.2.8. Others
6.3. Global Atherosclerosis Drugs Market Attractiveness, by Drug Class
7. Global Atherosclerosis Drugs Market Analysis and Forecast, By Distribution Channel
7.1. Introduction & Definition
7.1.1. Key Findings / Developments
7.2. Global Atherosclerosis Drugs Market Revenue (US$ Mn) Forecast, by Distribution Channel, 2017–2027
7.2.1. Retail Pharmacies
7.2.2. Hospital Pharmacies
7.2.3. Online Pharmacies
7.3. Global Atherosclerosis Drugs Market Attractiveness, by Distribution Channel
8. Global Atherosclerosis Drugs Market Analysis and Forecast, By Region
8.1. Key Findings
8.2. Global Atherosclerosis Drugs Market Revenue (US$ Mn) Forecast, by Region
8.2.1. North America
8.2.2. Europe
8.2.3. Asia Pacific
8.2.4. Latin America
8.2.5. Middle East & Africa
8.3. Global Atherosclerosis Drugs Market Attractiveness, by region
9. North America Atherosclerosis Drugs Market Analysis and Forecast
9.1. Introduction
9.1.1. Key Findings
9.2. North America Atherosclerosis Drugs Market Revenue (US$ Mn) Forecast, by Drug Class, 2017–2027
9.2.1. Anti-platelet Medications
9.2.2. Cholesterol Lowering Medications
9.2.3. Fibric Acid and Omega-3 Fatty Acid Derivatives
9.2.4. Beta Blockers
9.2.5. Angiotensin-Converting Enzyme (ACE) Inhibitors
9.2.6. Calcium Channel Blockers
9.2.7. Diuretics
9.2.8. Others
9.3. North America Atherosclerosis Drugs Market Revenue (US$ Mn) Forecast, by Distribution Channel, 2017–2027
9.3.1. Retail Pharmacies
9.3.2. Hospital Pharmacies
9.3.3. Online Pharmacies
9.4. North America Atherosclerosis Drugs Market Revenue (US$ Mn) Forecast, by Country, 2017–2027
9.4.1. U.S.
9.4.2. Canada
9.5. North America Atherosclerosis Drugs Market Attractiveness
9.5.1. By Drug Type
9.5.2. By Distribution Channel
9.5.3. By Country
10. Europe Atherosclerosis Drugs Market Analysis and Forecast
10.1. Introduction
10.1.1. Key Findings
10.2. Europe Atherosclerosis Drugs Market Revenue (US$ Mn) Forecast, by Drug Class, 2017–2027
10.2.1. Anti-platelet Medications
10.2.2. Cholesterol Lowering Medications
10.2.3. Fibric Acid and Omega-3 Fatty Acid Derivatives
10.2.4. Beta Blockers
10.2.5. Angiotensin-Converting Enzyme (ACE) Inhibitors
10.2.6. Calcium Channel Blockers
10.2.7. Diuretics
10.2.8. Others
10.3. Europe Atherosclerosis Drugs Market Revenue (US$ Mn) Forecast, by Distribution Channel, 2017–2027
10.3.1. Retail Pharmacies
10.3.2. Hospital Pharmacies
10.3.3. Online Pharmacies
10.4. Europe Atherosclerosis Drugs Market Revenue (US$ Mn) Forecast, by Country Sub/region, 2017–2027
10.4.1. Germany
10.4.2. U.K.
10.4.3. France
10.4.4. Spain
10.4.5. Italy
10.4.6. Rest of Europe
10.5. Europe Atherosclerosis Drugs Market Attractiveness
10.5.1. By Drug Type
10.5.2. By Distribution Channel
10.5.3. By Country/Sub-region
11. Asia Pacific Atherosclerosis Drugs Market Analysis and Forecast
11.1. Introduction
11.1.1. Key Findings
11.2. Asia Pacific Atherosclerosis Drugs Market Revenue (US$ Mn) Forecast, by Drug Class, 2017–2027
11.2.1. Anti-platelet Medications
11.2.2. Cholesterol lowering medications
11.2.3. Fibric Acid and Omega-3 Fatty Acid Derivatives
11.2.4. Beta blockers
11.2.5. Angiotensin-Converting Enzyme (ACE) Inhibitors
11.2.6. Calcium Channel Blockers
11.2.7. Diuretics
11.2.8. Others
11.3. Asia Pacific Atherosclerosis Drugs Market Revenue (US$ Mn) Forecast, by Distribution Channel, 2017–2027
11.3.1. Retail Pharmacies
11.3.2. Hospital Pharmacies
11.3.3. Online Pharmacies
11.4. Asia Pacific Atherosclerosis Drugs Market Revenue (US$ Mn) Forecast, by Country/Sub-region, 2017–2027
11.4.1. China
11.4.2. Japan
11.4.3. India
11.4.4. Australia & New Zealand
11.4.5. Rest of Asia Pacific
11.5. Asia Pacific Atherosclerosis Drugs Market Attractiveness
11.5.1. By Drug Type
11.5.2. By Distribution Channel
11.5.3. By Country/Sub-region
12. Latin America Atherosclerosis Drugs Market Analysis and Forecast
12.1. Introduction
12.1.1. Key Findings
12.2. Latin America Atherosclerosis Drugs Market Revenue (US$ Mn) Forecast, by Drug Class, 2017–2027
12.2.1. Anti-platelet Medications
12.2.2. Cholesterol Lowering Medications
12.2.3. Fibric Acid and Omega-3 Fatty Acid Derivatives
12.2.4. Beta blockers
12.2.5. Angiotensin-Converting Enzyme (ACE) Inhibitors
12.2.6. Calcium Channel Blockers
12.2.7. Diuretics
12.2.8. Others
12.3. Latin America Atherosclerosis Drugs Market Revenue (US$ Mn) Forecast, by Distribution Channel, 2017–2027
12.3.1. Retail Pharmacies
12.3.2. Hospital Pharmacies
12.3.3. Online Pharmacies
12.4. Latin America Atherosclerosis Drugs Market Revenue (US$ Mn) Forecast, by Country/Sub-region, 2017–2027
12.4.1. Brazil
12.4.2. Mexico
12.4.3. Rest of Latin America
12.5. Latin America Atherosclerosis Drugs Market Attractiveness
12.5.1. By Drug Type
12.5.2. By Distribution Channel
12.5.3. By Country/Sub-region
13. Middle East & Africa Atherosclerosis Drugs Market Analysis and Forecast
13.1. Introduction
13.1.1. Key Findings
13.2. Middle East & Africa Atherosclerosis Drugs Market Revenue (US$ Mn) Forecast, by Drug Class, 2017–2027
13.2.1. Anti-platelet medications
13.2.2. Cholesterol Lowering Medications
13.2.3. Fibric Acid and Omega-3 Fatty Acid Derivatives
13.2.4. Beta blockers
13.2.5. Angiotensin-Converting Enzyme (ACE) Inhibitors
13.2.6. Calcium Channel Blockers
13.2.7. Diuretics
13.2.8. Others
13.3. Middle East & Africa Atherosclerosis Drugs Market Revenue (US$ Mn) Forecast, by Distribution Channel, 2017–2027
13.3.1. Retail Pharmacies
13.3.2. Hospital Pharmacies
13.3.3. Online Pharmacies
13.4. Middle East & Africa Atherosclerosis Drugs Market Revenue (US$ Mn) Forecast, by Country/Sub-region, 2017–2027
13.4.1. GCC
13.4.2. South Africa
13.4.3. Rest of Middle East & Africa
13.5. Middle East & Africa Atherosclerosis Drugs Market Attractiveness
13.5.1. By Drug Type
13.5.2. By Distribution Channel
13.5.3. By Country/Sub-region
14. Competition Landscape
14.1. Market Player – Competition Matrix (By Tier and Size of companies)
14.2. Key Company’s Market Ranking Analysis
14.3. Company Profiles
14.3.1. GlaxoSmithKline Plc
14.3.1.1. Company Overview
14.3.1.2. Company Financials
14.3.1.3. Growth Strategies
14.3.1.4. SWOT Analysis
14.3.2. Sanofi
14.3.2.1. Company Overview
14.3.2.2. Company Financials
14.3.2.3. Growth Strategies
14.3.2.4. SWOT Analysis
14.3.3. Hoffmann-La Roche Ltd
14.3.3.1. Company Overview
14.3.3.2. Company Financials
14.3.3.3. Growth Strategies
14.3.3.4. SWOT Analysis
14.3.4. Bayer AG
14.3.4.1. Company Overview
14.3.4.2. Company Financials
14.3.4.3. Growth Strategies
14.3.4.4. SWOT Analysis
14.3.5. Novartis AG
14.3.5.1. Company Overview
14.3.5.2. Company Financials
14.3.5.3. Growth Strategies
14.3.5.4. SWOT Analysis
14.3.6. Merck & Co., Inc. (Merck Sharp & Dohme Corp)
14.3.6.1. Company Overview
14.3.6.2. Company Financials
14.3.6.3. Growth Strategies
14.3.6.4. SWOT Analysis
14.3.7. Janssen Pharmaceuticals, Inc. (Johnson & Johnson)
14.3.7.1. Company Overview
14.3.7.2. Company Financials
14.3.7.3. Growth Strategies
14.3.7.4. SWOT Analysis
14.3.8. Mylan N.V.
14.3.8.1. Company Overview
14.3.8.2. Company Financials
14.3.8.3. Growth Strategies
14.3.8.4. SWOT Analysis
14.3.9. Amgen Inc.
14.3.9.1. Company Overview
14.3.9.2. Company Financials
14.3.9.3. Growth Strategies
14.3.9.4. SWOT Analysis
14.3.10. Pfizer, Inc.
14.3.10.1. Company Overview
14.3.10.2. Company Financials
14.3.10.3. Growth Strategies
14.3.10.4. SWOT Analysis
List of Tables
Table 01: Atherosclerosis Pipeline Analysis
Table 02: Atherosclerosis Pipeline Analysis
Table 03: Global Atherosclerosis Drugs Market Revenue (US$ Mn) Forecast, by Drug Class, 2017–2027
Table 04: Global Atherosclerosis Drugs Market Revenue (US$ Mn) Forecast, by Distribution Channel, 2017–2027
Table 05: Global Atherosclerosis Drugs Market Revenue (US$ Mn) Forecast, by Region, 2017–2027
Table 06: North America Atherosclerosis Drugs Market Revenue (US$ Mn) Forecast, by Drug Class 2017–2027
Table 07: North America Atherosclerosis Drugs Market Revenue (US$ Mn) Forecast, by Distribution Channel, 2017–2027
Table 08: North America Atherosclerosis Drugs Market Revenue (US$ Mn) Forecast, by Country, 2017–2027
Table 09: Europe Atherosclerosis Drugs Market Revenue (US$ Mn) Forecast, by Drug Class, 2017–2027
Table 10: Europe Atherosclerosis Drugs Market Revenue (US$ Mn) Forecast, by Distribution Channel, 2017–2027
Table 11: Europe Atherosclerosis Drugs Market Revenue (US$ Mn) Forecast, by Country/Sub-region, 2017–2027
Table 12: Asia Pacific Atherosclerosis Drugs Market Revenue (US$ Mn) Forecast, by Drug Class, 2017–2027
Table 13: Asia Pacific Atherosclerosis Drugs Market Revenue (US$ Mn) Forecast, by Distribution Channel, 2017–2027
Table 14: Asia Pacific Atherosclerosis Drugs Market Revenue (US$ Mn) Forecast, by Country/Sub-region, 2017–2027
Table 15: Latin America Atherosclerosis Drugs Market Revenue (US$ Mn) Forecast, by Drug Class 2017–2027
Table 16: Latin America Atherosclerosis Drugs Market Revenue (US$ Mn) Forecast, by Distribution Channel, 2017–2027
Table 17: Latin America Atherosclerosis Drugs Market Revenue (US$ Mn) Forecast, by Country / Sub-region, 2017–2027
Table 18: Middle East & Africa Atherosclerosis Drugs Market Revenue (US$ Mn) Forecast, by Drug Class, 2017–2027
Table 19: Middle East & Africa Atherosclerosis Drugs Market Revenue (US$ Mn) Forecast, by Distribution Channel, 2017–2027
Table 20: Middle East & Africa Atherosclerosis Drugs Market Revenue (US$ Mn) Forecast, by Country/Sub-region, 2017–2027
List of Figures
Figure 01: Global Atherosclerosis Drugs Market Revenue (US$ Mn) and Distribution (%), by Region, 2018 and 2027
Figure 02: Global Atherosclerosis Drugs Market Revenue (US$ Mn), by Drug Class, 2018
Figure 03: Global Atherosclerosis Drugs Market Revenue Share Analysis, by Drug Class, 2018
Figure 04: Market Overview
Figure 05: Global Atherosclerosis Drugs Market Revenue Share, by Drug Class, 2018
Figure 06: Global Atherosclerosis Drugs Market Revenue Share, by Distribution Channel, 2018
Figure 07: Global Atherosclerosis Drugs Market Revenue Share, by Region, 2018
Figure 08: Global Atherosclerosis Drugs Market Revenue (US$ Mn) Forecast, 2017–2027
Figure 09: Global Atherosclerosis Drugs Market Revenue Share Analysis, by Drug Class, 2018 and 2027
Figure 10: Global Atherosclerosis Drugs Market Revenue (US$ Mn) Forecast and Y-o-Y Growth (%) Projection, by Anti-platelet Medications, 2017–2027
Figure 11: Global Atherosclerosis Drugs Market Revenue (US$ Mn) Forecast and Y-o-Y Growth (%) Projection, by Cholesterol Lowering Medications, 2017–2027
Figure 12: Global Atherosclerosis Drugs Market Revenue (US$ Mn) Forecast and Y-o-Y Growth (%) Projection, by Fibric Acid and Omega-3 Fatty Acid Derivatives, 2017–2027
Figure 13: Global Atherosclerosis Drugs Market Revenue (US$ Mn) Forecast and Y-o-Y Growth (%) Projection, by Beta Blockers, 2017–2027
Figure 14: Global Atherosclerosis Drugs Market Revenue (US$ Mn) Forecast and Y-o-Y Growth (%) Projection, by Angiotensin-converting Enzyme (ACE) Inhibitors, 2017–2027
Figure 15: Global Atherosclerosis Drugs Market Revenue (US$ Mn) Forecast and Y-o-Y Growth (%) Projection, by Calcium Channel Blockers, 2017–2027
Figure 16: Global Atherosclerosis Drugs Market Revenue (US$ Mn) Forecast and Y-o-Y Growth (%) Projection, by Diuretics, 2017–2027
Figure 17: Global Atherosclerosis Drugs Market Revenue (US$ Mn) Forecast and Y-o-Y Growth (%) Projection, by Others, 2017–2027
Figure 18: Global Atherosclerosis Drugs Market Attractiveness Analysis, by Drug Class, 2018–2027
Figure 19: Global Atherosclerosis Drugs Market Revenue Share Analysis, by Distribution Channel, 2018 and 2027
Figure 20: Global Atherosclerosis Drugs Market Revenue (US$ Mn) Forecast and Y-o-Y Growth(%) Projection, by Retail Pharmacies, 2017–2027
Figure 21: Global Atherosclerosis Drugs Market Revenue (US$ Mn) Forecast and Y-o-Y Growth (%) Projection, by Hospital Pharmacies, 2017–2027
Figure 22: Global Atherosclerosis Drugs Market Revenue (US$ Mn) Forecast and Y-o-Y Growth (%) Projection, by Online Pharmacies, 2017–2027
Figure 23: Global Atherosclerosis Drugs Market Attractiveness Analysis, by Distribution Channel, 2019–2027
Figure 24: Global Atherosclerosis Drugs Market Revenue Share Analysis, by Region, 2018 and 2027
Figure 25: Global Atherosclerosis Drugs Market Attractiveness Analysis, by Region, 2019–2027
Figure 26: North America Atherosclerosis Drugs Market Revenue (US$ Mn) Forecast and Y-o-Y Growth (%) Projection, 2017–2027
Figure 27: North America Atherosclerosis Drugs Market Revenue Share Analysis, by Drug Class, 2018 and 2027
Figure 28: North America Atherosclerosis Drugs Market Attractiveness Analysis, by Drug Class, 2019–2027
Figure 29: North America Atherosclerosis Drugs Market Revenue Share Analysis, by Distribution Channel, 2018 and 2027
Figure 30: North America Atherosclerosis Drugs Market Attractiveness Analysis, by Distribution Channel, 2019 -2027
Figure 31: North America Atherosclerosis Drugs Market Revenue Share Analysis, by Country/Sub-region, 2018 and 2027
Figure 32: North America Atherosclerosis Drugs Market Attractiveness Analysis, by Country/Sub-region, 2019–2027
Figure 33: Europe Atherosclerosis Drugs Market Revenue (US$ Mn) Forecast and Y-o-Y Growth (%) Projection, 2017–2027
Figure 34: Europe Atherosclerosis Drugs Market Revenue Share Analysis, by Drug Class, 2018 and 2027
Figure 35: Europe Atherosclerosis Drugs Market Attractiveness Analysis, by Drug Class, 2019–2027
Figure 36: Europe Atherosclerosis Drugs Market Revenue Share Analysis, by Distribution Channel, 2018 and 2027
Figure 37: Europe Atherosclerosis Drugs Market Attractiveness Analysis, by Distribution Channel, 2019–2027
Figure 38: Europe Atherosclerosis Drugs Market Revenue Share Analysis, by Country/Sub-region, 2018 and 2027
Figure 39: Europe Atherosclerosis Drugs Market Attractiveness Analysis, by Country/Sub-region, 2019–2027
Figure 40: Asia Pacific Atherosclerosis Drugs Market Revenue (US$ Mn) Forecast and Y-o-Y Growth (%) Projection, 2017–2027
Figure 41: Asia Pacific Atherosclerosis Drugs Market Revenue Share Analysis, by Drug Class, 2018 and 2027
Figure 42: Asia Pacific Atherosclerosis Drugs Market Attractiveness Analysis, by Drug Class, 2019–2027
Figure 43: Asia Pacific Atherosclerosis Drugs Market Revenue Share Analysis, by Distribution Channel, 2018 and 2027
Figure 44: Asia Pacific Atherosclerosis Drugs Market Attractiveness Analysis, by Distribution Channel, 2019 -2027
Figure 45: Asia Pacific Atherosclerosis Drugs Market Revenue Share Analysis, by Country/Sub-region, 2018 and 2027
Figure 46: Asia Pacific Atherosclerosis Drugs Market Attractiveness Analysis, by Country/Sub-region, 2019–2027
Figure 47: Latin America Atherosclerosis Drugs Market Revenue (US$ Mn) Forecast and Y-o-Y Growth (%) Projection, 2017–2027
Figure 48: Latin America Atherosclerosis Drugs Market Revenue Share Analysis, by Drug Class, 2018 and 2027
Figure 49: Latin America Atherosclerosis Drugs Market Attractiveness Analysis, by Drug Class, 2019–2027
Figure 50: Latin America Atherosclerosis Drugs Market Revenue Share Analysis, by Distribution Channel, 2018 and 2027
Figure 51: Latin America Atherosclerosis Drugs Market Attractiveness Analysis, by Distribution Channel, 2019 -2027
Figure 52: Latin America Atherosclerosis Drugs Market Revenue Share Analysis, by Country/Sub-region, 2018 and 2027
Figure 53: Latin America Atherosclerosis Drugs Market Attractiveness Analysis, by Country/Sub-region, 2019–2027
Figure 54: Middle East & Africa Atherosclerosis Drugs Market Revenue (US$ Mn) Forecast and Y-o-Y Growth (%) Projection, 2017–2027
Figure 55: Middle East & Africa Atherosclerosis Drugs Market Revenue Share Analysis, by Drug Class, 2018 and 2027
Figure 56: Middle East & Africa Atherosclerosis Drugs Market Attractiveness Analysis, by Drug Class, 2019–2027
Figure 57: Middle East & Africa Atherosclerosis Drugs Market Revenue Share Analysis, by Distribution Channel, 2018 and 2027
Figure 58: Middle East & Africa Atherosclerosis Drugs Market Attractiveness Analysis, by Distribution Channel, 2019 -2027
Figure 59: Middle East & Africa Atherosclerosis Drugs Market Revenue Share Analysis, by Country/Sub-region, 2018 and 2027
Figure 60: Middle East & Africa Atherosclerosis Drugs Market Attractiveness Analysis, by Country/Sub-region, 2019–2027
Figure 61: Market Position Analysis, 2018, by Tier and Size of the Company
Figure 62: GlaxoSmithKline plc (US$ Mn) and Y-o-Y Growth (%), 2015–2018
Figure 63: GlaxoSmithKline plc Breakdown of Net Sales (%), by Region/Country, 2018
Figure 64: GlaxoSmithKline plc Revenue Breakdown of Net Sales (%), by Business segment, 2018
Figure 65: GlaxoSmithKline plc R&D Expenses (US$ Mn) and Y-o-Y Growth (%), 2015–2018
Figure 66: Sanofi (US$ Mn) and Y-o-Y Growth (%), 2015–2018
Figure 65: GlaxoSmithKline plc R&D Expenses (US$ Mn) and Y-o-Y Growth (%), 2015–2018
Figure 68: Sanofi Revenue Breakdown of Net Sales (%), by Pharmaceutical Business segment, 2018
Figure 69: Sanofi R&D Expenses (US$ Mn) and Y-o-Y Growth (%), 2016–2018
Figure 70: F. Hoffmann-La Roche Ltd Revenue (US$ Mn) and Y-o-Y Growth (%), 2015–2018
Figure 71: F. Hoffmann-La Roche Ltd Breakdown of Net Sales (%), by Region, 2018
Figure 72: F. Hoffmann-La Roche Ltd Breakdown of Net Sales (%), by Pharmaceutical Division, 2018
Figure 73: F. Hoffmann-La Roche Ltd R&D Expenses (US$ Mn) and Y-o-Y Growth (%), 2015–2018
Figure 74: Bayer AG, Pharmaceutical Revenue (US$ Mn) and Y-o-Y Growth (%), 2016–2018
Figure 75: Bayer AG Breakdown of Net Sales (%), by Region, 2018
Figure 76: Bayer AG Revenue Breakdown of Net Sales (%), by Business segment, 2018
Figure 77: Bayer AG, pharmaceutical segment R&D Expenses (US$ Mn) and Y-o-Y Growth (%), 2015–2018
Figure 78: Novartis AG Revenue (US$ Mn) and Y-o-Y Growth (%), 2015–2018
Figure 79: Novartis AG Breakdown of Net Sales (%) of Innovative Medicines Business Segment, by Region/Country, 2018
Figure 80: Novartis AG Revenue Breakdown of Net Sales (%), by Innovative Medicines Segment, 2018
Figure 81: Novartis AG R&D Expenses (US$ Mn) and Y-o-Y Growth (%), 2015–2018
Figure 82: Merck & Co., Inc. Revenue (US$ Mn) and Y-o-Y Growth (%), 2015–2018
Figure 83: Merck & Co., Inc. Breakdown of Net Sales (%), by Region/Country, 2018
Figure 84: Merck & Co., Inc. Revenue Breakdown of Net Sales (%), by Segment, 2018
Figure 85: Merck & Co., Inc. R&D Expenses (US$ Mn) and Y-o-Y Growth (%), 2015–2018
Figure 86: Johnson & Johnson Pharmaceutical Segment Revenue (US$ Mn) and Y-o-Y Growth (%), 2016–2018
Figure 87: Johnson & Johnson Breakdown of Net Sales (%), of Pharmaceutical Segment by Region/Country, 2018
Figure 88: Johnson & Johnson Revenue Breakdown of Net Sales (%), by Pharmaceutical Segment, 2018
Figure 89: Johnson & Johnson, Pharmaceutical Segment R&D Expenses (US$ Mn) and Y-o-Y Growth (%), 2016–2018
Figure 90: Mylan N.V. Revenue (US$ Mn) and Y-o-Y Growth (%), 2015–2018
Figure 91: Mylan N.V. R&D Expenses (US$ Mn), 2017–2018
Figure 92: Mylan N.V. Breakdown of Net Sales, by Region, 2018
Figure 93: Amgen, Inc. Revenue (US$ Mn) and Y-o-Y Growth (%), 2015–2018
Figure 94: Amgen, Inc. Breakdown of Net Sales (%), by Region/Country, 2017
Figure 95: Amgen Inc. R&D Expenses (US$ Mn) and Y-o-Y Growth (%), by Segment 2014–2017
Figure 96: Pfizer, Inc. Revenue (US$ Mn) and Y-o-Y Growth (%), 2015–2018
Figure 97: Pfizer, Inc. Breakdown of Net Sales, by Geography, 2018
Figure 98: Pfizer, Inc. Breakdown of Net Sales, by Business Segment (%), 2018
Figure 99: Pfizer, Inc. R&D Expenses (US$ Mn) and Y-o-Y Growth (%), 2015–2018
Copyright © Transparency Market Research, Inc. All Rights reserved
Trust Online

Atherosclerosis Drugs Market