
Reports
Reports
The arthritis therapeutics market, characterized by healthy growth, is witnessing numerous promising pipeline projects and new product launches in parallel to increasing awareness campaigns run by public and private organizations. The patent expiration of blockbuster drugs is putting more pressure on manufacturers to develop effective versions of these drugs, which is projected to pave the way for the advancements of biosimilar products.
According to the Centers for Disease Control and Prevention (CDC) data published in 2018, ~54 Mn adults in the U.S. have been diagnosed with arthritis, and the number will grow to ~78 Mn by 2040. In this fast-paced era, individuals can’t afford to reduce their range of motion, which pertinently entails that those residing in developed countries are massively partaking in the diagnosis and treatment of arthritis as compared to those in developing countries. In the future, as the success of health awareness campaigns increases in developing countries, manufacturers in the arthritis therapeutics market will scramble towards these countries to leverage the first mover’s advantage.
Despite the stronghold of disease-modifying antirheumatic drugs (DMARDs) in the arthritis therapeutics market, next gen antibody therapeutics are found to gain ground in recent times, on account of their higher efficiency. However, the efficiency of these drugs comes at a price, indeed a high one, ranging from US$ 1,000 to US$ 3,000 per month, which could hold back the sales potential of these drugs.
The price of Humira - a default drug for the treatment of arthritis - saw a steep increase in its price by 68.7% over the last five years, which equals to US$ 3,700 for a month-long supply. Also, the wholesale cost of the drug Enbrel has risen by 80.3% in the same time period, as found by Alliance of Community Health Plans. What’s more of an adoption concern for patients is the lack of discounts and deals, and the retail price further rises when they are distributed to retailers and pharmacies. Given the recommendation for a long-term course of arthritis treatment, high cost can affect the monthly budgets of patients, which could negatively impact sales in the arthritis therapeutics market space.
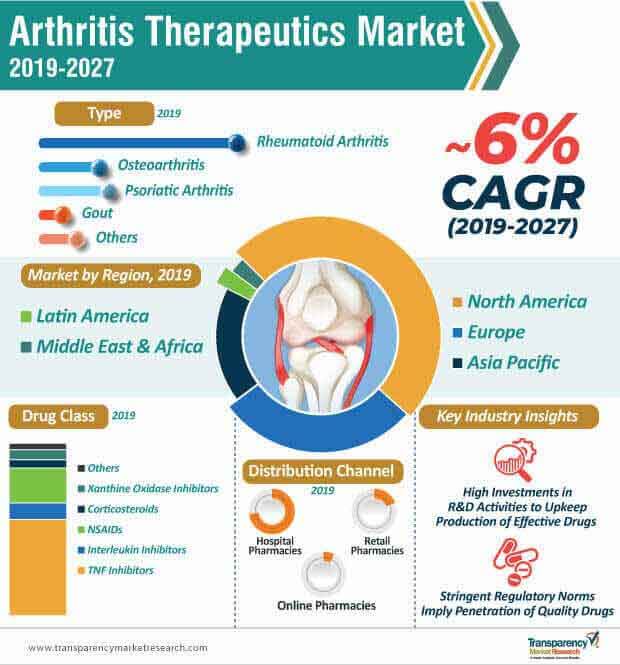
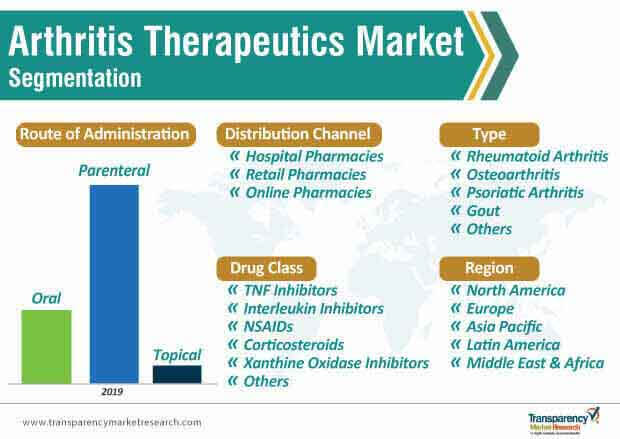
As per the report, in 2019, the parenteral route of drug administration is projected to be used for ~83% cases for arthritis treatment, while in the remaining ~17% cases, the oral and topical route will be preferred. To put this data into perspective, parenteral administration possesses better control over the dose and frequency, thereby ensuring an improved treatment outcome as compared to oral therapeutics. These routes of drug administration, in turn, are also found to offer better bioavailability and metabolism avoidance. On the contrary, patients are liable to maintain a course of oral drugs on their own, and in cases where they miss out on popping a pill, recovery can take a longer time.
Analysts’ Opinion on Arthritis Therapeutics Market
Analysts of the report opine that, the arthritis therapeutics market will record 8.5% more sales in 2019 over 2018, and continue to advance at a CAGR of ~6% during 2019-2027. The high prevalence of arthritis that primarily weakens the joints and degrades the quality of life of patients, is projected to encourage more patients to avail proper treatment options. Given the growing demand, head-to-head trails to boost the efficacy profiles of drugs intensify the competition in the arthritis therapeutics market, and strategic partnership to target new markets backed by innovative product-level approaches will form a profitable deal for manufacturers.
It is worth noting that, retail pharmacies will take over ~78% sales of these therapeutics in the year 2019, which implies the need for market players to strengthen distribution partnerships with retailers of all scales.
Global Arthritis Therapeutics Market: Overview
Global Arthritis Therapeutics Market: Key Segment
Global Arthritis Therapeutics Market: Major Players
Arthritis therapeutics market to reach ~US$ 72.6 Bn by 2027
Arthritis therapeutics market is projected to expand at a CAGR of ~6% from 2019 to 2027
Arthritis therapeutics market is driven by increasing incidence of arthritis, including rheumatoid arthritis, osteoarthritis, psoriatic arthritis, gout, and other types of arthritis across the globe
The rheumatoid arthritis segment is the largest, and is expected to dominate the market during the forecast period
Key players in the global arthritis therapeutics market include Novartis AG, Eli Lilly and Company, Amgen Inc., Merck & Co., Inc., Bristol-Myers Squibb Company
1. Preface
1.1. Market Definition and Scope
1.2. Market Segmentation
1.3. Key Research Objectives
1.4. Research Highlights
2. Assumptions and Research Methodology
3. Executive Summary: Global Arthritis Therapeutics Market
4. Market Overview
4.1. Introduction
4.1.1. Market Definition
4.1.2. Industry Evolution / Developments
4.2. Overview
4.3. Market Dynamics
4.3.1. Drivers
4.3.2. Restraints
4.3.3. Opportunities
4.4. Global Arthritis Therapeutics Market Analysis and Forecast, 2017–2027
4.4.1. Market Revenue Projections (US$ Mn)
5. Key Insights
5.1. Key product/brand Analysis
5.2. Pipeline Analysis
5.3. Disease Prevalence & Incidence Rate globally with key countries
5.4. Regulatory Scenario by Region/globally
6. Global Arthritis Therapeutics Market Analysis and Forecast, By Type
6.1. Introduction & Definition
6.2. Key Findings / Developments
6.3. Arthritis Therapeutics Market Value (US$ Mn) Forecast, by Type, 2017–2027
6.3.1. Rheumatoid Arthritis
6.3.2. Osteoarthritis
6.3.3. Psoriatic Arthritis
6.3.4. Gout
6.3.5. Others
6.4. Market Attractiveness By Type
7. Global Arthritis Therapeutics Market Analysis and Forecast, By Drug Class
7.1. Introduction & Definition
7.2. Key Findings / Developments
7.3. Arthritis Therapeutics Market Value (US$ Mn) Forecast, by Drug Class, 2017–2027
7.3.1. TNF Inhibitors
7.3.2. Interleukin Inhibitors
7.3.3. NSAIDs
7.3.4. Corticosteroids
7.3.5. Xanthine Oxidase Inhibitors
7.3.6. Others
7.4. Market Attractiveness By Drug Class
8. Global Arthritis Therapeutics Market Analysis and Forecast, By Route of Administration
8.1. Introduction & Definition
8.2. Key Findings / Developments
8.3. Arthritis Therapeutics Market Value (US$ Mn) Forecast, by Route of Administration, 2017–2027
8.3.1. Oral
8.3.2. Parenteral
8.3.3. Topical
8.4. Market Attractiveness By Route of Administration
9. Global Arthritis Therapeutics Market Analysis and Forecast, By Distribution Channel
9.1. Introduction & Definition
9.2. Key Findings / Developments
9.3. Arthritis Therapeutics Market Value (US$ Mn) Forecast, by Distribution Channel, 2017–2027
9.3.1. Hospital Pharmacies
9.3.2. Retail Pharmacies
9.3.3. Online Pharmacies
9.4. Market Attractiveness By Distribution Channel
10. Global Arthritis Therapeutics Market Analysis and Forecast, By Region
10.1. Key Findings
10.2. Arthritis Therapeutics Market Value (US$ Mn) Forecast, by Region
10.2.1. North America
10.2.2. Europe
10.2.3. Asia Pacific
10.2.4. Latin America
10.2.5. Middle East & Africa
10.3. Market Attractiveness By Country/Sub-region /Region
11. North America Arthritis Therapeutics Market Analysis and Forecast
11.1. Introduction
11.1.1. Key Findings
11.2. North America Arthritis Therapeutics Market Value (US$ Mn) Forecast, by Type, 2017–2027
11.2.1. Rheumatoid Arthritis
11.2.2. Osteoarthritis
11.2.3. Psoriatic Arthritis
11.2.4. Gout
11.2.5. Others
11.3. North America Arthritis Therapeutics Market Value (US$ Mn) Forecast, by Drug Class, 2017–2027
11.3.1. TNF Inhibitors
11.3.2. Interleukin Inhibitors
11.3.3. NSAIDs
11.3.4. Corticosteroids
11.3.5. Xanthine Oxidase Inhibitors
11.3.6. Others
11.4. North America Arthritis Therapeutics Market Value (US$ Mn) Forecast, by Route of Administration, 2017–2027
11.4.1. Oral
11.4.2. Parenteral
11.4.3. Topical
11.5. North America Arthritis Therapeutics Market Value (US$ Mn) Forecast, by Distribution Channel, 2017–2027
11.5.1. Hospital Pharmacies
11.5.2. Retail Pharmacies
11.5.3. Online Pharmacies
11.6. North America Arthritis Therapeutics Market Value (US$ Mn) Forecast, by Country/Sub-region, 2017–2027
11.6.1. U.S.
11.6.2. Canada
11.7. North America Market Attractiveness Analysis
11.7.1. By Type
11.7.2. By Drug Class
11.7.3. By Route of Administration
11.7.4. By Distribution Channel
11.7.5. By Country/Sub-region
12. Europe Arthritis Therapeutics Market Analysis and Forecast
12.1. Introduction
12.1.1. Key Findings
12.2. Europe Arthritis Therapeutics Market Value (US$ Mn) Forecast, by Type, 2017–2027
12.2.1. Rheumatoid Arthritis
12.2.2. Osteoarthritis
12.2.3. Psoriatic Arthritis
12.2.4. Gout
12.2.5. Others
12.3. Europe Arthritis Therapeutics Market Value (US$ Mn) Forecast, by Drug Class, 2017–2027
12.3.1. TNF Inhibitors
12.3.2. Interleukin Inhibitors
12.3.3. NSAIDs
12.3.4. Corticosteroids
12.3.5. Xanthine Oxidase Inhibitors
12.3.6. Others
12.4. Europe Arthritis Therapeutics Market Value (US$ Mn) Forecast, by Route of Administration, 2017–2027
12.4.1. Oral
12.4.2. Parenteral
12.4.3. Topical
12.5. Europe Arthritis Therapeutics Market Value (US$ Mn) Forecast, by Distribution Channel, 2017–2027
12.5.1. Hospital Pharmacies
12.5.2. Retail Pharmacies
12.5.3. Online Pharmacies
12.6. Europe Arthritis Therapeutics Market Value (US$ Mn) Forecast, by Country/Sub-region, 2017–2027
12.6.1. Germany
12.6.2. U.K.
12.6.3. France
12.6.4. Spain
12.6.5. Italy
12.6.6. Rest of Europe
12.7. Europe Market Attractiveness Analysis
12.7.1. By Type
12.7.2. By Drug Class
12.7.3. By Route of Administration
12.7.4. By Distribution Channel
12.7.5. By Country/Sub-region
13. Asia Pacific Arthritis Therapeutics Market Analysis and Forecast
13.1. Introduction
13.1.1. Key Findings
13.2. Asia Pacific Arthritis Therapeutics Market Value (US$ Mn) Forecast, by Type, 2017–2027
13.2.1. Rheumatoid Arthritis
13.2.2. Osteoarthritis
13.2.3. Psoriatic Arthritis
13.2.4. Gout
13.2.5. Others
13.3. Asia Pacific Arthritis Therapeutics Market Value (US$ Mn) Forecast, by Drug Class, 2017–2027
13.3.1. TNF Inhibitors
13.3.2. Interleukin Inhibitors
13.3.3. NSAIDs
13.3.4. Corticosteroids
13.3.5. Xanthine Oxidase Inhibitors
13.3.6. Others
13.4. Asia Pacific Arthritis Therapeutics Market Value (US$ Mn) Forecast, by Route of Administration, 2017–2027
13.4.1. Oral
13.4.2. Parenteral
13.4.3. Topical
13.5. Asia Pacific Arthritis Therapeutics Market Value (US$ Mn) Forecast, by Distribution Channel, 2017–2027
13.5.1. Hospital Pharmacies
13.5.2. Retail Pharmacies
13.5.3. Online Pharmacies
13.6. Asia Pacific Arthritis Therapeutics Market Value (US$ Mn) Forecast, By Country/Sub-region /Sub-region, 2017–2027
13.6.1. China
13.6.2. Japan
13.6.3. India
13.6.4. Australia & New Zealand
13.6.5. Rest of Asia Pacific
13.7. Asia Pacific Market Attractiveness Analysis
13.7.1. By Type
13.7.2. By Drug Class
13.7.3. By Route of Administration
13.7.4. By Distribution Channel
13.7.5. By Country/Sub-region
14. Latin America Arthritis Therapeutics Market Analysis and Forecast
14.1. Introduction
14.1.1. Key Findings
14.2. Latin America Arthritis Therapeutics Market Value (US$ Mn) Forecast, by Type, 2017–2027
14.2.1. Rheumatoid Arthritis
14.2.2. Osteoarthritis
14.2.3. Psoriatic Arthritis
14.2.4. Gout
14.2.5. Others
14.3. Latin America Arthritis Therapeutics Market Value (US$ Mn) Forecast, by Drug Class, 2017–2027
14.3.1. TNF Inhibitors
14.3.2. Interleukin Inhibitors
14.3.3. NSAIDs
14.3.4. Corticosteroids
14.3.5. Xanthine Oxidase Inhibitors
14.3.6. Others
14.4. Latin America Arthritis Therapeutics Market Value (US$ Mn) Forecast, by Route of Administration, 2017–2027
14.4.1. Oral
14.4.2. Parenteral
14.4.3. Topical
14.5. Latin America Arthritis Therapeutics Market Value (US$ Mn) Forecast, by Distribution Channel, 2017–2027
14.5.1. Hospital Pharmacies
14.5.2. Retail Pharmacies
14.5.3. Online Pharmacies
14.6. Latin America Arthritis Therapeutics Market Value (US$ Mn) Forecast, By Country/Sub-region /Sub-region, 2017–2027
14.6.1. Brazil
14.6.2. Mexico
14.6.3. Rest of Latin America
14.7. Latin America Market Attractiveness Analysis
14.7.1. By Type
14.7.2. By Drug Class
14.7.3. By Route of Administration
14.7.4. By Distribution Channel
14.7.5. By Country/Sub-region
15. Middle East & Africa Arthritis Therapeutics Market Analysis and Forecast
15.1. Introduction
15.1.1. Key Findings
15.2. Middle East & Africa Arthritis Therapeutics Market Value (US$ Mn) Forecast, by Type, 2017–2027
15.2.1. Rheumatoid Arthritis
15.2.2. Osteoarthritis
15.2.3. Psoriatic Arthritis
15.2.4. Gout
15.2.5. Others
15.3. Middle East & Africa Arthritis Therapeutics Market Value (US$ Mn) Forecast, by Drug Class, 2017–2027
15.3.1. TNF Inhibitors
15.3.2. Interleukin Inhibitors
15.3.3. NSAIDs
15.3.4. Corticosteroids
15.3.5. Xanthine Oxidase Inhibitors
15.3.6. Others
15.4. Middle East & Africa Arthritis Therapeutics Market Value (US$ Mn) Forecast, by Route of Administration, 2017–2027
15.4.1. Oral
15.4.2. Parenteral
15.4.3. Topical
15.5. Middle East & Africa Arthritis Therapeutics Market Value (US$ Mn) Forecast, by Distribution Channel, 2017–2027
15.5.1. Hospital Pharmacies
15.5.2. Retail Pharmacies
15.5.3. Online Pharmacies
15.6. Middle East & Africa Arthritis Therapeutics Market Value (US$ Mn) Forecast, By Country/Sub-region , 2017–2027
15.6.1. GCC Countries
15.6.2. South Africa
15.6.3. Rest of Middle East & Africa
15.7. Middle East & Africa Market Attractiveness Analysis
15.7.1. By Type
15.7.2. By Drug Class
15.7.3. By Route of Administration
15.7.4. By Distribution Channel
15.7.5. By Country/Sub-region
16. Competition Landscape
16.1. Market Share Analysis By Company (2018)
16.2. Company Profiles
16.2.1. Novartis AG
16.2.1.1. Company Overview (HQ, Business Segments, Employee Strength)
16.2.1.2. Financial Overview
16.2.1.3. Product Portfolio
16.2.1.4. Strategic Overview
16.2.1.5. SWOT Analysis
16.2.2. Eli Lilly and Company
16.2.2.1. Company Overview (HQ, Business Segments, Employee Strength)
16.2.2.2. Financial Overview
16.2.2.3. Product Portfolio
16.2.2.4. Strategic Overview
16.2.2.5. SWOT Analysis
16.2.3. Amgen, Inc.
16.2.3.1. Company Overview (HQ, Business Segments, Employee Strength)
16.2.3.2. Financial Overview
16.2.3.3. Product Portfolio
16.2.3.4. Strategic Overview
16.2.3.5. SWOT Analysis
16.2.4. Merck & Co., Inc.
16.2.4.1. Company Overview (HQ, Business Segments, Employee Strength)
16.2.4.2. Financial Overview
16.2.4.3. Product Portfolio
16.2.4.4. Strategic Overview
16.2.4.5. SWOT Analysis
16.2.5. Bristol-Myers Squibb Company
16.2.5.1. Company Overview (HQ, Business Segments, Employee Strength)
16.2.5.2. Financial Overview
16.2.5.3. Product Portfolio
16.2.5.4. Strategic Overview
16.2.5.5. SWOT Analysis
16.2.6. Pfizer, Inc.
16.2.6.1. Company Overview (HQ, Business Segments, Employee Strength)
16.2.6.2. Financial Overview
16.2.6.3. Product Portfolio
16.2.6.4. Strategic Overview
16.2.6.5. SWOT Analysis
16.2.7. AbbVie, Inc.
16.2.7.1. Company Overview (HQ, Business Segments, Employee Strength)
16.2.7.2. Financial Overview
16.2.7.3. Product Portfolio
16.2.7.4. Strategic Overview
16.2.7.5. SWOT Analysis
16.2.8. Janssen Global Services, LLC (Johnson & Johnson)
16.2.8.1. Company Overview (HQ, Business Segments, Employee Strength)
16.2.8.2. Financial Overview
16.2.8.3. Product Portfolio
16.2.8.4. Strategic Overview
16.2.8.5. SWOT Analysis
16.2.9. F. Hoffmann-La Roche Ltd
16.2.9.1. Company Overview (HQ, Business Segments, Employee Strength)
16.2.9.2. Financial Overview
16.2.9.3. Product Portfolio
16.2.9.4. Strategic Overview
16.2.9.5. SWOT Analysis
16.2.10. Sanofi
16.2.10.1. Company Overview (HQ, Business Segments, Employee Strength)
16.2.10.2. Financial Overview
16.2.10.3. Product Portfolio
16.2.10.4. Strategic Overview
16.2.10.5. SWOT Analysis
List of Tables
Table 01: Global Arthritis Therapeutics Market Value (US$ Mn) Forecast, by Type, 2017–2027
Table 02: Global Arthritis Therapeutics Market Value (US$ Mn) Forecast, by Drug Class, 2017–2027
Table 03: Global Arthritis Therapeutics Market Value (US$ Mn) Forecast, by Route of Administration, 2017–2027
Table 04: Global Arthritis Therapeutics Market Value (US$ Mn) Forecast, by Distribution Channel, 2017–2027
Table 05: Global Arthritis Therapeutics Market Value (US$ Mn) Forecast, by Region, 2017–2027
Table 06: North America Arthritis Therapeutics Value (US$ Mn) Forecast, by Type, 2017–2027
Table 07: North America Arthritis Therapeutics Value (US$ Mn) Forecast, by Drug Class, 2017–2027
Table 08: North America Arthritis Therapeutics Value (US$ Mn) Forecast, by Route of Administration,
Table 09: North America Arthritis Therapeutics Market Value (US$ Mn) Forecast, by Distribution Channel, 2017–2027
Table 10: North America Arthritis Therapeutics Market Value (US$ Mn) Forecast, By Country/Sub-region , 2017–2027
Table 11: Europe Arthritis Therapeutics Value (US$ Mn) Forecast, by Type, 2017–2027
Table 12: Europe Arthritis Therapeutics Value (US$ Mn) Forecast, by Drug Class, 2017–2027
Table 13: Europe Arthritis Therapeutics Value (US$ Mn) Forecast, by Route of Administration, 2017–2027
Table 14: Europe Arthritis Therapeutics Market Value (US$ Mn) Forecast, by Distribution Channel, 2017–2027
Table 15: Europe Arthritis Therapeutics Market Value (US$ Mn) Forecast, By Country/Sub-region, 2017–2027
Table 16: Asia Pacific Arthritis Therapeutics Market Value (US$ Mn) Forecast, by Type, 2017–2027
Table 17: Asia Pacific Arthritis Therapeutics Market Value (US$ Mn) Forecast, by Drug Class, 2017–2027
Table 18: Asia Pacific Arthritis Therapeutics Market Value (US$ Mn) Forecast, by Route of Administration, 2017–2027
Table 19: Asia Pacific Arthritis Therapeutics Market Value (US$ Mn) Forecast, by Distribution Channel, 2017–2027
Table 20: Asia Pacific Arthritis Therapeutics Market Value (US$ Mn) Forecast, By Country/Sub-region, 2017–2027
Table 21: Latin America Arthritis Therapeutics Value (US$ Mn) Forecast, by Type, 2017–2027
Table 22: Latin America Arthritis Therapeutics Value (US$ Mn) Forecast, by Drug Class, 2017–2027
Table 23: Latin America Arthritis Therapeutics Value (US$ Mn) Forecast, by Route of Administration, 2017–2027
Table 24: Latin America Arthritis Therapeutics Market Value (US$ Mn) Forecast, by Distribution Channel, 2017–2027
Table 25: Latin America Arthritis Therapeutics Market Value (US$ Mn) Forecast, By Country/Sub-region, 2017–2027
Table 26: Middle East & Africa Arthritis Therapeutics Value (US$ Mn) Forecast, by Type, 2017–2027
Table 27: Middle East & Africa Arthritis Therapeutics Value (US$ Mn) Forecast, by Drug Class, 2017–2027
Table 28: Middle East & Africa Arthritis Therapeutics Value (US$ Mn) Forecast, by Route of Administration, 2017–2027
Table 29: Middle East & Africa Arthritis Therapeutics Market Value (US$ Mn) Forecast, by Distribution Channel, 2017–2027
Table 30: Middle East & Africa Arthritis Therapeutics Market Value (US$ Mn) Forecast, By Country/Sub-region, 2017–2027
List of Figures
Figure 01: Global Arthritis Therapeutics Market Snapshot
Figure 02: Global Arthritis Therapeutics Market Value (US$ Mn) and Distribution, by Region, 2018 and 2027
Figure 03: Global Arthritis Therapeutics Market Value (US$ Mn) Forecast, 2017?2027
Figure 04: Global Arthritis Therapeutics Market Value Share (%), by Type (2018)
Figure 05: Global Arthritis Therapeutics Market Value Share (%), by Route of Administration (2018)
Figure 06: Global Arthritis Therapeutics Market Value Share (%), by Drug Class (2018)
Figure 07: Global Arthritis Therapeutics Market Value Share (%), by Distribution Channel (2018)
Figure 08: Global Arthritis Therapeutics Market Value Share (%), by Region (2018)
Figure 09: Global Arthritis Therapeutics Market Value Share Analysis, by Type, 2018 and 2027
Figure 10: Global Arthritis Therapeutics Market Attractiveness, by Type, 2019–2027
Figure 11: Global Arthritis Therapeutics Market Value (US$ Mn) Forecast and Y-o-Y Growth (%) Projection, by Rheumatoid Arthritis, 2017–2027
Figure 12: Global Arthritis Therapeutics Market Value (US$ Mn) Forecast and Y-o-Y Growth (%) Projection, by Osteoarthritis, 2017–2027
Figure 13: Global Arthritis Therapeutics Market Value (US$ Mn) Forecast and Y-o-Y Growth (%) Projection, by Psoriatic Arthritis, 2017–2027
Figure 14: Global Arthritis Therapeutics Market Value (US$ Mn) Forecast and Y-o-Y Growth (%) Projection, by Gout, 2017–2027
Figure 15: Global Arthritis Therapeutics Market Value (US$ Mn) Forecast and Y-o-Y Growth (%) Projection, by Others, 2017–2027
Figure 16: Global Arthritis Therapeutics Market Value Share Analysis, by Drug Class, 2018 and 2027
Figure 17: Global Arthritis Therapeutics Market Attractiveness, by Drug Class, 2019–2027
Figure 18: Global Arthritis Therapeutics Market Value (US$ Mn) Forecast and Y-o-Y Growth (%) Projection, by TNF Inhibitors, 2017–2027
Figure 19: Global Arthritis Therapeutics Market Value (US$ Mn) Forecast and Y-o-Y Growth (%) Projection, by Interleukin Inhibitors, 2017–2027
Figure 20: Global Arthritis Therapeutics Market Value (US$ Mn) Forecast and Y-o-Y Growth (%) Projection, by NSAIDs, 2017–2027
Figure 21: Global Arthritis Therapeutics Market Value (US$ Mn) Forecast and Y-o-Y Growth (%) Projection, by Corticosteroids, 2017–2027
Figure 22: Global Arthritis Therapeutics Market Value (US$ Mn) Forecast and Y-o-Y Growth (%) Projection, by Xanthine Oxidase Inhibitors, 2017–2027
Figure 23: Global Arthritis Therapeutics Market Value (US$ Mn) Forecast and Y-o-Y Growth (%) Projection, by Others, 2017–2027
Figure 24: Global Arthritis Therapeutics Market Value Share(%), by Route of Administration, 2018 and 2027
Figure 25: Global Arthritis Therapeutics Market Revenue (US$ Mn) Forecast and Y-o-Y Growth (%) Projection, by Oral, 2017–2027
Figure 26: Global Arthritis Therapeutics Market Revenue (US$ Mn) Forecast and Y-o-Y Growth (%) Projection, by Parenteral, 2017–2027
Figure 27: Global Arthritis Therapeutics Market Revenue (US$ Mn) Forecast and Y-o-Y Growth (%) Projection, by Topical, 2017–2027
Figure 28: Global Arthritis Therapeutics Market Attractiveness, by Route of Administration, 2019–2027
Figure 29: Global Arthritis Therapeutics Market Value Share (%), by Distribution Channel, 2018 and 2027
Figure 30: Global Arthritis Therapeutics Market Revenue (US$ Mn) Forecast and Y-o-Y Growth (%) Projection, by Hospital Pharmacies, 2017–2027
Figure 31: Global Arthritis Therapeutics Market Revenue (US$ Mn) Forecast and Y-o-Y Growth (%) Projection, by Retail Pharmacies, 2017–2027
Figure 32: Global Arthritis Therapeutics Market Revenue (US$ Mn) Forecast and Y-o-Y Growth (%) Projection, by Online Pharmacies, 2017–2027
Figure 33: Global Arthritis Therapeutics Market Attractiveness, by Distribution Channel, 2019–2027
Figure 34: Global Arthritis Therapeutics Market Value Share Analysis, by Region 2018 and 2027
Figure 35: Global Arthritis Therapeutics Market Attractiveness, by Region, 2019–2027
Figure 36: North America Arthritis Therapeutics Market Value (US$ Mn) and Y-o-Y Growth (%) Forecast, 2017–2027
Figure 37: North America Arthritis Therapeutics Market Value Share (%), by Type, 2018 and 2027
Figure 38: North America Arthritis Therapeutics Market Attractiveness, by Type, 2019–2027
Figure 39: North America Arthritis Therapeutics Market Value Share (%), by Drug Class, 2018 and 2027
Figure 40: North America Arthritis Therapeutics Market Attractiveness, by Drug Class, 2019–2027
Figure 41: North America Arthritis Therapeutics Market Value Share (%), by Route of Administration, 2018 and 2027
Figure 42: North America Arthritis Therapeutics Market Attractiveness, by Route of Administration, 2019–2027
Figure 43: North America Arthritis Therapeutics Market Value Share (%), by Distribution Channel, 2018 and 2027
Figure 44: North America Arthritis Therapeutics Market Attractiveness, by Distribution Channel, 2019–2027
Figure 45 : North America Arthritis Therapeutics Market Value Share (%), By Country/Sub-region , 2018 and 2027
Figure 46: North America Arthritis Therapeutics Market Attractiveness, By Country/Sub-region , 2019–2027
Figure 47: Europe Arthritis Therapeutics Market Value (US$ Mn) and Y-o-Y Growth (%) Forecast, 2017–2027
Figure 48: Europe Arthritis Therapeutics Market Value Share (%), by Type, 2018 and 2027
Figure 49: Europe Arthritis Therapeutics Market Attractiveness, by Type, 2019–2027
Figure 50: Europe Arthritis Therapeutics Market Value Share (%), by Drug Class, 2018 and 2027
Figure 51: Europe Arthritis Therapeutics Market Attractiveness, by Drug Class, 2019–2027
Figure 52: Europe Arthritis Therapeutics Market Value Share (%), by Route of Administration, 2018 and 2027
Figure 53: Europe Arthritis Therapeutics Market Attractiveness, by Route of Administration, 2019–2027
Figure 54: Europe Arthritis Therapeutics Market Value Share (%), by Distribution Channel, 2018 and 2027
Figure 55: Europe Arthritis Therapeutics Market Attractiveness, by Distribution Channel, 2019–2027
Figure 56: Europe Arthritis Therapeutics Market Value Share (%), By Country/Sub-region /Sub-region, 2018 and 2027
Figure 57: Europe Arthritis Therapeutics Market Attractiveness, By Country/Sub-region /Sub-region, 2019–2027
Figure 58: Asia Pacific Arthritis Therapeutics Market Value (US$ Mn) and Y-o-Y Growth (%) Forecast, 2017–2027
Figure 59: Asia Pacific Arthritis Therapeutics Market Value Share (%), by Type, 2018 and 2027
Figure 60: Asia Pacific Arthritis Therapeutics Market Attractiveness, by Type, 2019–2027
Figure 61: Asia Pacific Arthritis Therapeutics Market Value Share (%), by Drug Class, 2018 and 2027
Figure 62: Asia Pacific Arthritis Therapeutics Market Attractiveness, by Drug Class, 2019–2027
Figure 63: Asia Pacific Arthritis Therapeutics Market Value Share (%), by Route of Administration, 2018 and 2027
Figure 64: Asia Pacific Arthritis Therapeutics Market Attractiveness, by Route of Administration, 2019–2027
Figure 65: Asia Pacific Arthritis Therapeutics Market Value Share (%), by Distribution Channel, 2018 and 2027
Figure 66: Asia Pacific Arthritis Therapeutics Market Attractiveness, by Distribution Channel, 2019–2027
Figure 67 : Asia Pacific Arthritis Therapeutics Market Value Share (%), By Country/Sub-region /Sub-region, 2018 and 2027
Figure 68: Asia Pacific Arthritis Therapeutics Market Attractiveness, By Country/Sub-region /Sub-region, 2019–2027
Figure 69: Latin America Arthritis Therapeutics Market Value (US$ Mn) Forecast and Y-o-Y Growth (%) Projection, 2017–2027
Figure 70: Latin America Arthritis Therapeutics Market Value Share (%), by Type, 2018 and 2027
Figure 71: Latin America Arthritis Therapeutics Market Attractiveness, by Type, 2019–2027
Figure 72: Latin America Arthritis Therapeutics Market Value Share (%), by Drug Class, 2018 and 2027
Figure 73: Latin America Arthritis Therapeutics Market Attractiveness, by Drug Class, 2019–2027
Figure 74: Latin America Arthritis Therapeutics Market Value Share (%), by Route of Administration, 2018 and 2027
Figure 75: Latin America Arthritis Therapeutics Market Attractiveness, by Route of Administration, 2019–2027
Figure 76: Latin America Arthritis Therapeutics Market Value Share (%), by Distribution Channel, 2018 and 2027
Figure 77: Latin America Arthritis Therapeutics Market Attractiveness, by Distribution Channel, 2019–2027
Figure 78 : Latin America Arthritis Therapeutics Market Value Share (%), By Country/Sub-region /Sub-region, 2018 and 2027
Figure 79: Latin America Arthritis Therapeutics Market Attractiveness, By Country/Sub-region /Sub-region, 2019–2027
Figure 80: Middle East & Africa Arthritis Therapeutics Market Value (US$ Mn) and Y-o-Y Growth (%) Forecast, 2017–2027
Figure 81: Middle East & Africa Arthritis Therapeutics Market Value Share (%), by Type, 2018 and 2027
Figure 82: Middle East & Africa Arthritis Therapeutics Market Attractiveness, by Type, 2019–2027
Figure 83: Middle East & Africa Arthritis Therapeutics Market Value Share (%), by Drug Class, 2018 and 2027
Figure 84: Middle East & Africa Arthritis Therapeutics Market Attractiveness, by Drug Class, 2019–2027
Figure 85: Middle East & Africa Arthritis Therapeutics Market Value Share (%), by Route of Administration, 2018 and 2027
Figure 86: Middle East & Africa Arthritis Therapeutics Market Attractiveness, by Route of Administration, 2019–2027
Figure 87: Middle East & Africa Arthritis Therapeutics Market Value Share (%), by Distribution Channel, 2018 and 2027
Figure 88: Middle East & Africa Arthritis Therapeutics Market Attractiveness, by Distribution Channel, 2019–2027
Figure 89: Middle East & Africa Arthritis Therapeutics Market Value Share (%), By Country/Sub-region /Sub-region, 2018 and 2027
Copyright © Transparency Market Research, Inc. All Rights reserved
Trust Online

Arthritis Therapeutics Market