
Reports
Reports
The rise in global occurrence of autoimmune illnesses such as Psoriasis, Inflammatory Bowel Disorder, Rheumatoid Arthritis (RA), and Crohn's disease, as well as the rise in the elderly populace, are the primary reasons likely to drive the expansion of the global TNF inhibitors market.
Golimumab, Etanercept, Certolizumab, Infliximab, and Adalimumab are TNF inhibitors utilized to address inflammatory illnesses such as inflammatory bowel disease and psoriasis. Manufacturers in the global TNF inhibitors market are likely to provide a wide range of medications to treat a variety of inflammatory illnesses. During the COVID-19 pandemic, however, a research found that if a patient was completely vaccinated with the Pfizer vaccine and was taking a TNF inhibitor, the patient's antibody response to the virus that caused COVID-19 was diminished. A third injection of the vaccine, according to the study, is likely to boost antibody levels in the body.
The global TNF inhibitors market is relatively competitive, with many prominent competitors. In terms of market share, a few major competitors currently dominate the industry. Some major players are purchasing other businesses in order to strengthen their global market positions, whilst others are developing new items. With the clearance of the US Food and Drug Administration (FDA) in December 2019, Amgen added another blockbuster medicine, AVSOLA (infliximab-axxq), to its current portfolio of biosimilar drugs. As of the reference product, Remicade (infliximab), the AVSOLA has been authorized for all indications of chronic inflammatory diseases, which is projected to boost the global TNF inhibitors market in the years to come.
The world's population is aging rapidly, particularly in developed countries, such as the U.S., Japan, and Western Europe. In comparison to developing countries, developed countries have higher rate of aging. This can be linked to these nations' steadily growing health infrastructure, reimbursement systems, and advancements in health-care facilities. In addition to that, availability to numerous TNF inhibitors has increased, particularly in developed nations. As a result, the people's life expectancy has grown. The senior population is a big fan of TNF inhibitors since they help them live longer and better lives. An increase in the number of aged individuals leads to a higher risk of illness, which is anticipated to drive up demand in the global TNF inhibitors in the years to come.
The US Food and Drug Administration authorized adalimumab, often known as Humira, as the first and only entirely human monoclonal antibody for the treatment of rheumatoid arthritis. Humira, AbbVie's largest medication, was released in 2003 and has consistently generated the most revenue for the firm, which is likely to fuel expansion of the global TNF inhibitors market in the years to come.
Due to its widespread prevalence, rheumatoid arthritis is likely to account for substantial chunk of the global TNF inhibitors market. Furthermore, rheumatoid arthritis is more common in women than in men, is predicted to account for around two-thirds of the entire patient population with arthritis, and it worsens with age, all of which are expected to move the global TNF inhibitors market forward.
Hospital pharmacies are predicted to acquire one of the leading market shares by owing to the availability of physicians and treatment in one single location. Additionally, biosimilars producers want to control the availability of their goods to as many hospitals and patients as possible in order to fulfill their increasing requirements, which is expected to fuel the segment's growth and contribute to its part of global market revenue.
Most of the major TNF inhibitors, such as remicade, Enbrel, and humira, have lost their patents in the recent years, and more TNF inhibitors are anticipated to lose their patents soon. As a result of patient affordability in low-income countries and increasing patient awareness, TNF inhibitor biosimilars are expected to acquire market share throughout the projection period. In 2016, the patent on humira (adalimumab), the world's most popular medication, expired. In 2014, Johnson & Johnson's remicade lost its patent. TNF inhibitor biosimilars are projected to open up profitable potential in low-income nations by making TNF inhibitors more accessible and inexpensive, which will likely increase TNF inhibitor usage. This, in turn, is expected to fuel the demand for TNF inhibitors. Furthermore, a robust clinical pipeline of TNF inhibitors biosimilars is anticipated to bolster growth of the global TNF inhibitors market.
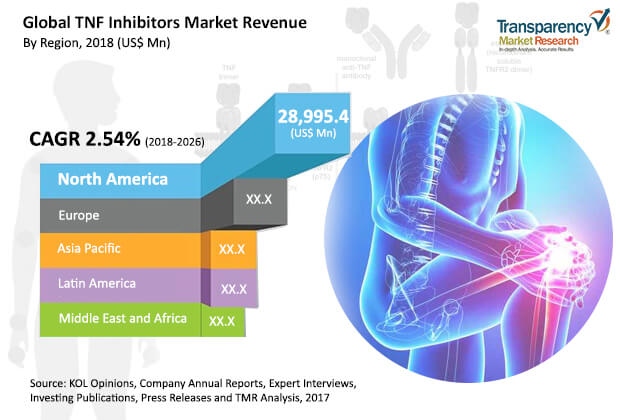
North America is likely to lead the global TNF inhibitors market during the forecast period. The region's prominence is attributed to a number of factors, including well-established direct reimbursement regulations and the presence of superior healthcare infrastructure. Due to the USFDA's fast medication approval effort, which supported market expansion in this region, the US is likely to account for a substantial chunk of the market in the years to come.
Following North America, Europe is likely to account for the second-largest market for TNF inhibitors, driven by growing demand from the regional aging population and rising healthcare costs. Huge expenditures by leading players, as well as continued expansion in R&D efforts in the area, are likely to contribute significantly to market revenue during the forecast period.
Asia Pacific is expected to expand at a rapid growth rate, owing to the large patient populations in China and India for disorders including Crohn's disease, IBD, and psoriasis. Furthermore, an expansion in the role of the government in assisting the healthcare industry, as well as continuous research activities in the region, is likely to boost market growth in the region.
TNF inhibitors market to reach around US$ 53,745.37 Mn by 2026
TNF inhibitors market is anticipated to expand at a stable CAGR of 2.54% during the forecast period of 2018 to 2026
TNF inhibitors market is driven by strong research & development and increasing awareness regarding usage of TNF inhibitors for the treatment of various rheumatic conditions
North America is estimated to hold a leading share of the global TNF inhibitors market during the forecast period
Key players in the TNF inhibitors market include AbbVie, Inc., Janssen Biotech, Inc., UCB, Amgen, Inc., Pfizer, Inc., Samsung Bioepis, Biogen, Merck & Co., and Takeda Pharmaceutical Company
1. Preface
1.1. Report Scope and Market Segmentation
1.2. Research Highlights
2. Assumptions and Research Methodology
2.1. Assumptions and Acronyms Used
2.2. Research Methodology
3. Executive Summary
3.1. Global TNF Inhibitors Market: Market Snapshot
4. Market Overview
4.1. Global TNF Inhibitors Market: Overview
4.2. Global TNF Inhibitors Market: Key Industry Developments
4.3. Market Dynamics
4.3.1. Drivers
4.3.2. Restraints
4.3.3. Opportunities
4.3.4. Trends
4.4. Global TNF Inhibitors Market Size (US$ Mn) Forecast, 2016–2026
4.5. Global TNF Inhibitors Market Outlook
4.6. Porter’s Five Forces Analysis
4.7. Clinical trials pipeline analysis-TNF Inhibitors
4.8. Overview of Regulatory Framework for Development and Approval of Biosimilars
5. Global TNF Inhibitors Market Analysis, by Drug
5.1. Key Findings
5.2. Introduction
5.3. Global TNF Inhibitors Market Value Share and Attractiveness Analysis, by Drug
5.4. Global TNF Inhibitors Market Value Forecast, by Drug
5.4.1. Adalimumab
5.4.2. Certolizumab
5.4.3. Etanercept
5.4.4. Golimumab
5.4.5. Infliximab
5.5. Global TNF Inhibitors Market Analysis, by Drug
6. Global TNF Inhibitors Market Analysis, by Application
6.1. Key Findings
6.2. Introduction
6.3. Global TNF Inhibitors Market Value Share and Attractiveness Analysis, by Application
6.4. Global TNF Inhibitors Market Value Forecast, by Application
6.4.1. Rheumatoid Arthritis
6.4.2. Psoriasis
6.4.3. Inflammatory Bowel Disease
6.4.4. Ankylosing Spondylitis
6.4.5. Others
6.5. Global TNF Inhibitors Market Analysis, by Application
7. Global TNF Inhibitors Market Analysis, by Distribution channel
7.1. Key Findings
7.2. Introduction
7.3. Global TNF Inhibitors Market Value Share and Attractiveness Analysis, by Distribution Channel
7.4. Global TNF Inhibitors Market Value Forecast, by Distribution channel
7.4.1. Hospital Pharmacy
7.4.2. Retail Pharmacy
7.4.3. Online Pharmacy
7.5. Global TNF Inhibitors Market Analysis, by Distribution Channel
8. Global TNF Inhibitors Market Analysis, by Region
8.1. Global TNF Inhibitors Market Scenario, by Country
8.2. Global TNF Inhibitors Market Value Share and Attractiveness Analysis, by Region
8.3. Global TNF Inhibitors Market Value Forecast, by Region
8.3.1. North America
8.3.2. Europe
8.3.3. Asia Pacific
8.3.4. Latin America
8.3.5. Middle East & Africa
9. North America TNF Inhibitors Market Analysis and Forecast
9.1. Key Findings
9.2. North America TNF Inhibitors Market Overview
9.3. North America TNF Inhibitors Market Value Share and Attractiveness Analysis, by Country
9.4. North America TNF Inhibitors Market Forecast, by Country
9.4.1. U.S.
9.4.2. Canada
9.5. North America TNF Inhibitors Market Value Share Analysis, by Drug
9.6. North America TNF Inhibitors Market Forecast, by Drug
9.6.1. Adalimumab
9.6.2. Certolizumab
9.6.3. Etanercept
9.6.4. Golimumab
9.6.5. Infliximab
9.7. North America TNF Inhibitors Market Value Share Analysis, by Application
9.8. North America TNF Inhibitors Market Forecast, by Application
9.8.1. Rheumatoid Arthritis
9.8.2. Psoriasis
9.8.3. Inflammatory Bowel Disease
9.8.4. Ankylosing Spondylitis
9.8.5. Others
9.9. North America TNF Inhibitors Market Value Share Analysis, by Distribution channel
9.10. North America TNF Inhibitors Market Forecast, by Distribution channel
9.10.1. Hospital Pharmacy
9.10.2. Retail Pharmacy
9.10.3. Online Pharmacy
9.11. North America TNF Inhibitors Market Attractiveness Analysis
10. Europe TNF Inhibitors Market Analysis
10.1. Key Findings
10.2. Europe TNF Inhibitors Market Overview
10.3. Europe TNF Inhibitors Market Value Share and Attractiveness Analysis, by Country
10.4. Europe TNF Inhibitors Market Forecast, by Country
10.4.1. Germany
10.4.2. U.K.
10.4.3. France
10.4.4. Italy
10.4.5. Spain
10.4.6. Rest of Europe
10.5. Europe TNF Inhibitors Market Value Share Analysis, by Drug
10.6. Europe TNF Inhibitors Market Forecast, by Drug
10.6.1. Adalimumab
10.6.2. Certolizumab
10.6.3. Etanercept
10.6.4. Golimumab
10.6.5. Infliximab
10.7. Europe TNF Inhibitors Market Value Share Analysis, by Application
10.8. Europe TNF Inhibitors Market Forecast, by Application
10.8.1. Rheumatoid Arthritis
10.8.2. Psoriasis
10.8.3. Inflammatory Bowel Disease
10.8.4. Ankylosing Spondylitis
10.8.5. Others
10.9. Europe TNF Inhibitors Market Value Share Analysis, by Distribution channel
10.10. Europe TNF Inhibitors Market Forecast, by Distribution channel
10.10.1. Hospital Pharmacy
10.10.2. Retail Pharmacy
10.10.3. Online Pharmacy
10.11. Europe TNF Inhibitors Market Attractiveness Analysis
11. Asia Pacific TNF Inhibitors Market Analysis
11.1. Key Findings
11.2. Asia Pacific TNF Inhibitors Market Overview
11.3. Asia Pacific TNF Inhibitors Market Value Share and Attractiveness Analysis, by Country
11.4. Asia Pacific TNF Inhibitors Market Forecast, by Country
11.4.1. China
11.4.2. India
11.4.3. Japan
11.4.4. Australia & New Zealand
11.4.5. Rest of Asia Pacific
11.5. Asia Pacific TNF Inhibitors Market Value Share Analysis, by Drug
11.6. Asia Pacific TNF Inhibitors Market Forecast, by Drug
11.6.1. Adalimumab
11.6.2. Certolizumab
11.6.3. Etanercept
11.6.4. Golimumab
11.6.5. Infliximab
11.7. Asia Pacific TNF Inhibitors Market Value Share Analysis, by Application
11.8. Asia Pacific TNF Inhibitors Market Forecast, by Application
11.8.1. Rheumatoid Arthritis
11.8.2. Psoriasis
11.8.3. Inflammatory Bowel Disease
11.8.4. Ankylosing Spondylitis
11.8.5. Others
11.9. Asia Pacific TNF Inhibitors Market Value Share Analysis, by Distribution channel
11.10. Asia Pacific TNF Inhibitors Market Forecast, by Distribution channel
11.10.1. Hospital Pharmacy
11.10.2. Retail Pharmacy
11.10.3. Online Pharmacy
11.11. Asia Pacific TNF Inhibitors Market Attractiveness Analysis
12. Latin America TNF Inhibitors Market Analysis
12.1. Key Findings
12.2. Latin America TNF Inhibitors Market Overview
12.3. Latin America TNF Inhibitors Market Value Share and Attractiveness Analysis, by Country
12.4. Latin America TNF Inhibitors Market Forecast, by Country
12.4.1. Brazil
12.4.2. Mexico
12.4.3. Rest of Latin America
12.5. Latin America TNF Inhibitors Market Value Share Analysis, by Drug
12.6. Latin America TNF Inhibitors Market Forecast, by Drug
12.6.1. Adalimumab
12.6.2. Certolizumab
12.6.3. Etanercept
12.6.4. Golimumab
12.6.5. Infliximab
12.7. Latin America TNF Inhibitors Market Value Share Analysis, by Application
12.8. Latin America TNF Inhibitors Market Forecast, by Application
12.8.1. Rheumatoid Arthritis
12.8.2. Psoriasis
12.8.3. Inflammatory Bowel Disease
12.8.4. Ankylosing Spondylitis
12.8.5. Others
12.9. Latin America TNF Inhibitors Market Value Share Analysis, by Distribution channel
12.10. Latin America TNF Inhibitors Market Forecast, by Distribution channel
12.10.1. Hospital Pharmacy
12.10.2. Retail Pharmacy
12.10.3. Online Pharmacy
12.11. Latin America TNF Inhibitors Market Attractiveness Analysis
13. Middle East & Africa TNF Inhibitors Market Analysis
13.1. Key Findings
13.2. Middle East & Africa TNF Inhibitors Market Overview
13.3. Middle East & Africa TNF Inhibitors Market Value Share and Attractiveness Analysis, by Country
13.4. Middle East & Africa TNF Inhibitors Market Forecast, by Country
13.4.1. South Africa
13.4.2. UAE
13.4.3. Saudi Arabia
13.4.4. Rest of Middle East and Africa
13.5. Middle East & Africa TNF Inhibitors Market Value Share Analysis, by Drug
13.6. Middle East & Africa TNF Inhibitors Market Forecast, by Drug
13.6.1. Adalimumab
13.6.2. Certolizumab
13.6.3. Etanercept
13.6.4. Golimumab
13.6.5. Infliximab
13.7. Middle East & Africa TNF Inhibitors Market Value Share Analysis, by Application
13.8. Middle East & Africa TNF Inhibitors Market Forecast, by Application
13.8.1. Rheumatoid Arthritis
13.8.2. Psoriasis
13.8.3. Inflammatory Bowel Disease
13.8.4. Ankylosing Spondylitis
13.8.5. Others
13.9. Middle East & Africa TNF Inhibitors Market Value Share Analysis, by Distribution channel
13.10. Middle East & Africa TNF Inhibitors Market Forecast, by Distribution channel
13.10.1. Hospital Pharmacy
13.10.2. Retail Pharmacy
13.10.3. Online Pharmacy
13.11. Middle East & Africa TNF Inhibitors Market Attractiveness Analysis
14. Competitive Landscape
14.1. Company Profiles
14.1.1. AbbVie, Inc.
14.1.1.1.1. Company Details
14.1.1.1.2. Business Overview
14.1.1.1.3. Financial Overview
14.1.1.1.4. Strategic Overview
14.1.1.1.5. SWOT Analysis
14.1.2. Janssen Biotech, Inc.
14.1.2.1.1. Company Details
14.1.2.1.2. Business Overview
14.1.2.1.3. Financial Overview
14.1.2.1.4. Strategic Overview
14.1.2.1.5. SWOT Analysis
14.1.3. Amgen, Inc.
14.1.3.1.1. Company Details
14.1.3.1.2. Business Overview
14.1.3.1.3. Financial Overview
14.1.3.1.4. Strategic Overview
14.1.3.1.5. SWOT Analysis
14.1.4. UCB Inc.
14.1.4.1.1. Company Details
14.1.4.1.2. Business Overview
14.1.4.1.3. Financial Overview
14.1.4.1.4. Strategic Overview
14.1.4.1.5. SWOT Analysis
14.1.5. Samsung Bioepis
14.1.5.1.1. Company Details
14.1.5.1.2. Business Overview
14.1.5.1.3. Financial Overview
14.1.5.1.4. Strategic Overview
14.1.5.1.5. SWOT Analysis
14.1.6. Biogen
14.1.6.1.1. Company Details
14.1.6.1.2. Business Overview
14.1.6.1.3. Financial Overview
14.1.6.1.4. Strategic Overview
14.1.6.1.5. SWOT Analysis
14.1.7. Merck & Co.
14.1.7.1.1. Company Details
14.1.7.1.2. Business Overview
14.1.7.1.3. Financial Overview
14.1.7.1.4. Strategic Overview
14.1.7.1.5. SWOT Analysis
14.1.8. Takeda Pharmaceutical Company
14.1.8.1.1. Company Details
14.1.8.1.2. Business Overview
14.1.8.1.3. Financial Overview
14.1.8.1.4. Strategic Overview
14.1.8.1.5. SWOT Analysis
14.1.9. Pfizer, Inc.
14.1.9.1.1. Company Details
14.1.9.1.2. Business Overview
14.1.9.1.3. Financial Overview
14.1.9.1.4. Strategic Overview
14.1.9.1.5. SWOT Analysis
List of Tables
Table 01: Opportunity Map, by Drug
Table 02: Opportunity Map, by Application
Table 03: Opportunity Map, Distribution Channel
Table 04: Global TNF Inhibitors Market Size (US$ Mn) Forecast, by Drug, 2016–2026
Table 05: Global TNF Inhibitors Market Size (US$ Mn) Forecast, by Application, 2016–2026
Table 06: Global TNF Inhibitors Market Size (US$ Mn) Forecast, by Distribution Channel, 2016–2026
Table 07: Global TNF Inhibitors Market Size (US$ Mn) Forecast, by Region, 2016–2026
Table 08: North America TNF Inhibitors Market Size (US$ Mn) Forecast, by Country, 2016–2026
Table 09: North America TNF Inhibitors Market Size (US$ Mn) Forecast, by Drug, 2016–2026
Table 10: North America TNF Inhibitors Market Size (US$ Mn) Forecast, by Application, 2016–2026
Table 11: North America TNF Inhibitors Market Size (US$ Mn) Forecast, by Distribution Channel, 2015–2025
Table 12: Europe TNF Inhibitors Market Size (US$ Mn) Forecast, by Country/Region, 2016–2026
Table 13: Europe TNF Inhibitors Market Size (US$ Mn) Forecast, by Drug, 2016–2026
Table 14: Europe TNF Inhibitors Market Size (US$ Mn) Forecast, by Application, 2016–2026
Table 15: Europe TNF Inhibitors Market Size (US$ Mn) Forecast, by Distribution Channel, 2015–2025
Table 16: Asia Pacific TNF Inhibitors Market Size (US$ Mn) Forecast, by Country/Region, 2016–2026
Table 17: Asia Pacific TNF Inhibitors Market Size (US$ Mn) Forecast, by Drug, 2016–2026
Table 18: Asia Pacific TNF Inhibitors Market Size (US$ Mn) Forecast, by Application, 2016–2026
Table 19: Asia Pacific TNF Inhibitors Market Size (US$ Mn) Forecast, by Distribution Channel, 2015–2025
Table 20: Latin America TNF Inhibitors Market Size (US$ Mn) Forecast, by Country/Region, 2016–2026
Table 21: Latin America TNF Inhibitors Market Size (US$ Mn) Forecast, by Drug, 2016–2026
Table 22: Latin America TNF Inhibitors Market Size (US$ Mn) Forecast, by Application, 2016–2026
Table 23: Latin America TNF Inhibitors Market Size (US$ Mn) Forecast, by Distribution Channel, 2015–2025
Table 24: Middle East & Africa TNF Inhibitors Market Size (US$ Mn) Forecast, by Country/Region, 2016–2026
Table 25: Middle East & Africa TNF Inhibitors Market Size (US$ Mn) Forecast, by Drug, 2016–2026
Table 26: Middle East & Africa TNF Inhibitors Market Size (US$ Mn) Forecast, by Application, 2016–2026
Table 27: Middle East & Africa TNF Inhibitors Market Size (US$ Mn) Forecast, by Distribution Channel, 2015–2025
List of Figures
Figure 01: Global TNF Inhibitors Market Size (US$ Mn), by Drug 2017 (A)
Figure 02: Global TNF Inhibitors Market Revenue (%), by Application, 2017
Figure 03: Global TNF Inhibitors Market Size (US$ Mn) Forecast, 2016–2026
Figure 05: Market Value Share, by Drug (2017)
Figure 07: Market Value Share, by Distribution Channel (2017)
Figure 04: Market Value Share, by Region (2017)
Figure 06: Market Value Share, by Application (2017)
Figure 08: Global TNF Inhibitors Market Value Share Analysis, by Drug, 2016 and 2026
Figure 09: Global TNF inhibitors Market Attractiveness, by Drug, 2018–2026
Figure 10: Global TNF Inhibitors Market Value (US$ Mn) and Y-o-Y Growth, by Adalimumab, 2016–2026
Figure 11: Global TNF Inhibitors Market Value (US$ Mn) and Y-o-Y Growth, by Certolizumab, 2016–2026
Figure 12: Global TNF Inhibitors Market Value (US$ Mn) and Y-o-Y Growth, by Etanercept, 2016–2026
Figure 13: Global TNF Inhibitors Market Value (US$ Mn) and Y-o-Y Growth, by Golimumab, 2016–2026
Figure 14: Global TNF Inhibitors Market Value (US$ Mn) and Y-o-Y Growth, by Infliximab, 2016–2026
Figure 15: Global TNF Inhibitors Market Value Share Analysis, by Application, 2017 and 2026
Figure 16: Global TNF Inhibitors Market Attractiveness, by Application, 2018–2026
Figure 17: Global TNF Inhibitors Market Value (US$ Mn) and Y-o-Y Growth, by Rheumatoid Arthritis, 2016–2026
Figure 18: Global TNF Inhibitors Market Value (US$ Mn) and Y-o-Y Growth, by Psoriasis, 2016–2026
Figure 19: Global TNF Inhibitors Market Value (US$ Mn) and Y-o-Y Growth, by Inflammatory Bowel Disease, 2016–2026
Figure 20: Global TNF Inhibitors Market Value (US$ Mn) and Y-o-Y Growth, by Ankylosing Spondylitis, 2016–2026
Figure 21: Global TNF Inhibitors Market Value (US$ Mn) and Y-o-Y Growth, by Others, 2016–2026
Figure 22: Global TNF Inhibitors Market Value Share, by Distribution Channel, 2017 and 2026
Figure 23: Global TNF Inhibitors Market Attractiveness, by Distribution Channel, 2018–2026
Figure 24: Global TNF Inhibitors Market Revenue (US$ Mn) Forecast and Y-o-Y Growth (%) Projection, by Hospital Pharmacy, 2016–2026
Figure 25: Global TNF Inhibitors Market Revenue (US$ Mn) Forecast and Y-o-Y Growth (%) Projection, by Retail Pharmacy, 2016–2026
Figure 26: Global TNF Inhibitors Market Revenue (US$ Mn) Forecast and Y-o-Y Growth (%) Projection, by Online Pharmacy, 2016-2026
Figure 27: Global TNF Inhibitors Market Value Share, by Region, 2016 and 2025
Figure 28: Global TNF Inhibitors Market Attractiveness, by Region, 2018–2026
Figure 29: North America TNF Inhibitors Market Size (US$ Mn) and Y-o-Y Growth (%) Forecast, 2017–2025
Figure 30: North America TNF Inhibitors Market Value Share Analysis, by Country, 2017 and 2026
Figure 31: North America TNF Inhibitors Market Attractiveness Analysis, by Country, 2018–2026
Figure 32: North America TNF Inhibitors Market Value Share Analysis, by Drug, 2017 and 2026
Figure 33: North America TNF Inhibitors Market Value Share Analysis, by Application, 2017 and 2026
Figure 34: North America TNF Inhibitors Market Value Share Analysis, by Distribution Channel, 2017 and 2026
Figure 35: North America TNF Inhibitors Market Attractiveness Analysis, by Drug, 2018–2026
Figure 36: North America TNF Inhibitors Market Attractiveness Analysis, by Application, 2018–2026
Figure 37: North America TNF Inhibitors Market Attractiveness Analysis, by Distribution Channel, 2018–2026
Figure 38: Europe TNF Inhibitors Market Size (US$ Mn) and Y-o-Y Growth (%) Forecast, 2017–2025
Figure 39: Europe TNF Inhibitors Market Value Share Analysis, by Country, 2017 and 2026
Figure 40: Europe TNF Inhibitors Market Attractiveness Analysis, by Country, 2018-2026
Figure 41: Europe TNF Inhibitors Market Value Share Analysis, by Drug, 2017 and 2026
Figure 42: Europe TNF Inhibitors Market Value Share Analysis, by Application, 2017 and 2026
Figure 43: Europe TNF Inhibitors Market Value Share Analysis, by Distribution Channel, 2017 and 2026
Figure 44: Europe TNF Inhibitors Market Attractiveness Analysis, by Drug, 2018–2026
Figure 45: Europe TNF Inhibitors Market Attractiveness Analysis, by Application, 2018–2026
Figure 46: Europe TNF Inhibitors Market Attractiveness Analysis, by Distribution Channel, 2018–2026
Figure 47: Asia Pacific TNF Inhibitors Market Size (US$ Mn) and Y-o-Y Growth (%) Forecast, 2018–2026
Figure 48: Asia Pacific TNF Inhibitors Market Value Share Analysis, by Country, 2017 and 2026
Figure 49: Asia Pacific TNF Inhibitors Market Attractiveness Analysis, by Country/Sub-region, 2018?2026
Figure 50: Asia Pacific TNF Inhibitors Market Value Share Analysis, by Drug, 2017 and 2026
Figure 51: Asia Pacific TNF Inhibitors Market Value Share Analysis, by Application, 2017 and 2026
Figure 52: Asia Pacific TNF Inhibitors Market Value Share Analysis, by Distribution Channel, 2017 and 2026
Figure 53: Asia Pacific TNF Inhibitors Market Attractiveness Analysis, by Drug, 2018–2026
Figure 54: Asia Pacific TNF Inhibitors Market Attractiveness Analysis, by Application, 2018–2026
Figure 55: Asia Pacific TNF Inhibitors Market Attractiveness Analysis, by Distribution Channel, 2018–2026
Figure 56: Latin America TNF Inhibitors Market Size (US$ Mn) and Y-o-Y Growth (%) Forecast, 2018–2026
Figure 57: Latin America TNF Inhibitors Market Value Share Analysis, by Country, 2017 and 2026
Figure 58: Latin America TNF Inhibitors Market Attractiveness Analysis, by Country/Sub-region, 2018?2026
Figure 59: Latin America TNF Inhibitors Market Value Share Analysis, by Drug, 2017 and 2026
Figure 60: Latin America TNF Inhibitors Market Value Share Analysis, by Application, 2017 and 2026
Figure 61: Latin America TNF Inhibitors Market Value Share Analysis, by Distribution Channel, 2017 and 2026
Figure 62: Latin America TNF Inhibitors Market Attractiveness Analysis, by Drug, 2018–2026
Figure 63: Latin America TNF Inhibitors Market Attractiveness Analysis, by Application, 2018–2026
Figure 64: Latin America TNF Inhibitors Market Attractiveness Analysis, by Distribution Channel, 2018–2026
Figure 65: Middle East & Africa TNF Inhibitors Market Size (US$ Mn) and Y-o-Y Growth (%) Forecast, 2018– 2026
Figure 66: Middle East & Africa TNF Inhibitors Market Value Share Analysis, by Country/Sub-region, 2017 and 2026
Figure 67: Middle East & Africa TNF Inhibitors Market Attractiveness Analysis, by Country/Sub-region, 2018?2026
Figure 68: Middle East & Africa TNF Inhibitors Market Value Share Analysis, by Drug, 2017 and 2026
Figure 69: Middle East & Africa TNF Inhibitors Market Value Share Analysis, by Application, 2017 and 2026
Figure 70: Middle East & Africa TNF Inhibitors Market Value Share Analysis, by Distribution Channel, 2017 and 2026
Figure 71: Middle East & Africa TNF Inhibitors Market Attractiveness Analysis, by Drug, 2018–2026
Figure 72: Middle East & Africa TNF Inhibitors Market Attractiveness Analysis, by Application, 2018–2026
Figure 73: Middle East & Africa TNF Inhibitors Market Attractiveness Analysis, by Distribution Channel, 2018–2026
Figure 74: Global TNF Inhibitors Market Share Analysis, by Company (2017)
Copyright © Transparency Market Research, Inc. All Rights reserved
Trust Online

TNF Inhibitors Market Insights, 2018-2026