
Reports
Reports
Analysts’ Viewpoint on Agricultural Shredder Market Scenario
Shredding is one of the major activities in the agricultural industry. Increasing awareness regarding advanced technology in agricultural practices is a major factor driving the global agricultural shredder market. An agricultural shredder helps reduce manual labor and man-hours that can be used in other tasks. A shredder is ideal for disposing leaves and garden & agricultural waste such as thorns, small branches, flower stalks, and tree pruning. The ground waste mixed with grass, logs, and leaves creates a light compost that promotes soil improvement. Moreover, the best way to get rid of agricultural waste is to turn it into compost. This scientific method returns nutrients to the soil in a natural manner. Therefore, efforts must be focused on the efficient use of all waste. Shredding helps cut agricultural products into smaller components that can be used for other applications. Agricultural shredders or farm shredders can be both fixed and portable; fixed products are mostly used for small farming purposes, while portable shredders are generally used as attachments/implements of tractors and can cover more area. These are more efficient, which makes them a better choice for consumers.
A shredder is a two-axis cutting tool used to cut, roll, tear, and extrude materials. A shredder is also defined as a crushing machine used for crushing materials of different hardness for extrusion and bending. A shredder can shred and recycle waste sources such as waste rubber, plastics, and tires. Therefore, it is considered an ecological machine.
An agricultural shredder machine comprises a bearing structure, drive machine, cutting chamber, rotor, shredding chamber, and blades. Agricultural shredder machine blades and other components are attached to agro machinery, such as a tractor, or installed in a fixed manner for agriculture practices of cutting and shredding. Revenue of the agricultural shredder market is estimated to advance due to the increase in arable land across the globe.
Agriculture is a highly intensive industry in several parts of the world, producing various byproducts requiring different treatment technologies and management practices. Agricultural waste, which includes both organic and inorganic waste, is a general term used to describe the waste produced on a farm through various agricultural activities. This waste is projected to account for more than 30% of global agricultural productivity. Some of the agricultural waste is recycled into agricultural production as fertilizer, while a large amount of waste is unused and in numerous cases presents a disposal problem. Conventional agricultural waste includes garden waste; agricultural waste is landfilled to be decomposed in a specific place. Since waste is landfilled as such, it takes longer to degrade and causes environmental pollution. The design and development of agricultural waste shredder machines helps reduce agricultural waste and convert it into useful nutritious fertilizer.
Moreover, governments in several countries are emphasizing on implementation of new regulations that are estimated to help strengthen the shredder machinery market. Additionally, shredders usually do not produce waste, which is another advantage of this machine. Governments are taking initiatives to recycle waste produced in the agricultural industry for economic and environmental reasons. Agricultural shredders and cutters help reduce waste, and this increases the demand for agricultural shredders globally.
Agricultural automation, often associated with ‘smart farming’, is the technology that makes farms more efficient and automates the production cycle of crops and animals. A growing number of companies are working on robotic innovation, developing drones, autonomous tractors, harvesting robots, automated irrigation, and seeding robots. Although these technologies are fairly new, the industry is seeing more and more traditional farming companies incorporating farm automation into their processes. The main goal of agricultural automation technology is to cover simpler routine tasks. Emerging trends of the agricultural shredder machines market includes commonly used technologies such as automated harvesting (including shredders), autonomous tractors, seeding and weeding, and drones, besides tractor operated shredder machines.
Deere & Company is focusing on development of remote products that can reduce labor involvement and enhance the ability to check work progress more efficiently. The company has developed products applying robotics; its new product line is equipped with ActiveVision cameras that can help farmers look inside the combine's grain bin and observe the stubble to monitor the condition of the harvested grain down to the individual grain. Moreover, the company’s products combine proprietary artificial intelligence capabilities, computer vision, field machine-to-machine communication, and integrated sensors for connectivity and self-driving capabilities. These advanced technologies are expected to propel the demand for automatic agricultural shredders worldwide.
Increasing awareness about the importance of technology in agriculture practices is one of the major factors driving the agriculture shredder market globally. Use of farm equipment such as agricultural grass shredders, or agricultural compost shredders saves considerable time and manual labor, which in turn can be used for performing other tasks. Moreover, garden waste shredder manufacturers are getting government support, which is expected to modernize the agricultural sector and increase the demand for different types of shredders in the near future. Moreover, expansion of commercial and agricultural sectors in emerging countries is likely to create an opportunity for the agricultural shredder market during the forecast period.
Asia Pacific is expected to dominate the global agricultural shredder market during the forecast period owing to a growing agriculture sector in the region. Rapid growth of smart farming and modern technologies is a key trend boosting the prospects of the agricultural shredder market in the region. The market in Asia Pacific is followed by the market in North America. Europe has emerged as a highly lucrative market in recent years. Increasing investments in the agricultural sector across developing economies is also expected to have a significant impact on the agricultural shredder market.
The global agricultural shredder market is consolidated with a few large-scale vendors controlling majority share. Most of the firms are spending significantly on comprehensive research and development for fabrication of agriculture waste shredder machines. Expansion of product portfolios and mergers and acquisitions are major strategies adopted by key players. AGCO Corporation Bamford Excavators Limited, Alamo Group, Beri Udyog Private Limited, Bertolini, Bobcat Company, Changzhou Dongfeng Agricultural Machinery Group Co. Ltd., Daedong Industry Co. Ltd., Deere & Company, Iseki & Co., Ltd., Kubota Corporation, Landoll Company LLC, and Mahindra & Mahindra Limited are the prominent players operating in the market.
|
Attribute |
Detail |
|
Market Size Value in 2021 |
US$ 1.8 Bn |
|
Market Forecast Value in 2031 |
US$ 2.8 Bn |
|
Growth Rate (CAGR) |
4.2% |
|
Forecast Period |
2022–2031 |
|
Historical Data Available for |
2017–2020 |
|
Quantitative Units |
US$ Bn for Value & Thousand Units for Volume |
|
Market Analysis |
Includes cross-segment analysis at the global as well as regional level. Furthermore, qualitative analysis includes drivers, restraints, opportunities, key trends, Porter’s Five Forces analysis, value chain analysis, and key trend analysis. |
|
Competition Landscape |
|
|
Market Segmentation |
|
|
Regions Covered |
|
|
Countries Covered |
|
|
Companies Profiled |
|
|
Customization Scope |
Available upon request |
|
Pricing |
Available upon request |
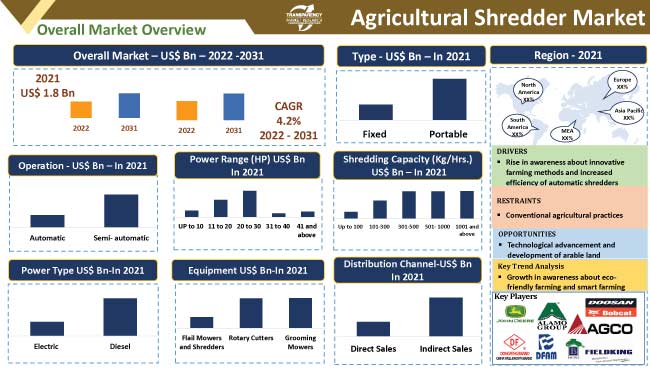
The agricultural shredder market stood at US$ 1.8 Bn in 2021.
The agricultural shredder market is estimated to expand at a CAGR of 4.2%.
Rise in awareness about innovative farming methods and increased efficiency of automatic shredders.
Portable type segment held largest share of the agricultural shredder market in 2021.
Asia Pacific is a more attractive region for vendors in the agricultural shredder market.
Agco Corporation, Bamford Excavators Limited, Alamo Group, Beri Udyog Private Limited, Bertolini, Bobcat Company, Changzhou Dongfeng Agricultural Machinery Group Co. Ltd., Daedong Industry Co. Ltd., Deere & Company, Iseki & Co., Ltd., Kubota Corporation, Landoll Company LLC, and Mahindra & Mahindra Limited.
1. Preface
1.1. Market Definition and Scope
1.2. Market Segmentation
1.3. Key Research Objectives
1.4. Research Highlights
2. Assumptions
3. Research Methodology
4. Executive Summary
5. Market Overview
5.1. Market Dynamics
5.1.1. Drivers
5.1.2. Restraints
5.1.3. Opportunities
5.2. Key Trends Analysis
5.2.1. Demand Side Analysis
5.2.2. Supply Side Analysis
5.3. Key Market Indicators
5.3.1. Overall Shredder Market
5.4. Porter’s Five Forces Analysis
5.5. Industry SWOT Analysis
5.6. Value Chain Analysis
5.7. Covid-19 Impact Analysis
5.8. Regulatory Framework & Guidelines
5.9. Technological Analysis
5.10. Global Agricultural Shredder Market Analysis and Forecast, 2017 - 2031
5.10.1. Market Value Projections (US$ Bn)
5.10.2. Market Volume Projections (Thousand Units)
6. Global Agricultural Shredder Market Analysis and Forecast, by Type
6.1. Agricultural Shredder Market Size (US$ Bn and Thousand Units), by Type, 2017 - 2031
6.1.1. Fixed
6.1.2. Portable
6.1.2.1. Self-driven
6.1.2.2. Attachments/Implements
6.2. Incremental Opportunity, by Type
7. Global Agricultural Shredder Market Analysis and Forecast, by Equipment
7.1. Agricultural Shredder Market Size (US$ Bn and Thousand Units), by Equipment, 2017 - 2031
7.1.1. Flail Mowers and Shredders
7.1.2. Rotary Cutters
7.1.3. Grooming Mowers
7.2. Incremental Opportunity, by Equipment
8. Global Agricultural Shredder Market Analysis and Forecast, by Operation
8.1. Agricultural Shredder Market Size (US$ Bn and Thousand Units), by Operation, 2017 - 2031
8.1.1. Automatic
8.1.2. Semi- automatic
8.2. Incremental Opportunity, by Operation
9. Global Agricultural Shredder Market Analysis and Forecast, by Power Type
9.1. Agricultural Shredder Market Size (US$ Bn and Thousand Units), by Power Type, 2017 - 2031
9.1.1. Electric
9.1.2. Diesel
9.2. Incremental Opportunity, by Power Type
10. Global Agricultural Shredder Market Analysis and Forecast, by Shredding Capacity (Kg/Hrs.)
10.1. Agricultural Shredder Market Size (US$ Bn and Thousand Units), by Shredding Capacity (Kg/Hrs.), 2017 - 2031
10.1.1. Up to 100
10.1.2. 101-300
10.1.3. 301-500
10.1.4. 501- 1000
10.1.5. 1001 and above
10.2. Incremental Opportunity, by Shredding Capacity (Kg/Hrs.)
11. Global Agricultural Shredder Market Analysis and Forecast, by Power Range
11.1. Agricultural Shredder Market Size (US$ Bn and Thousand Units), by Power Range, 2017 - 2031
11.1.1. Up to 10
11.1.2. 11 to 20
11.1.3. 20 to 30
11.1.4. 31 to 40
11.1.5. 41 and above
11.2. Incremental Opportunity, by Power Range
12. Global Agricultural Shredder Market Analysis and Forecast, by Distribution Channel
12.1. Agricultural Shredder Market Size (US$ Bn and Thousand Units), by Distribution Channel, 2017 - 2031
12.1.1. Direct
12.1.2. Indirect
12.2. Incremental Opportunity, by Distribution Channel
13. Global Agricultural Shredder Market Analysis and Forecast, by Region
13.1. Agricultural Shredder Market Size (US$ Bn and Thousand Units), by Region, 2017 - 2031
13.1.1. North America
13.1.2. Europe
13.1.3. Asia Pacific
13.1.4. Middle East & Africa
13.1.5. South America
13.2. Incremental Opportunity, by Region
14. North America Agricultural Shredder Market Analysis and Forecast
14.1. Regional Snapshot
14.2. Key Supplier Analysis
14.3. Price Trend Analysis
14.3.1. Weighted Average Price
14.4. Key Trends Analysis
14.4.1. Demand Side Analysis
14.4.2. Supply Side Analysis
14.5. Agricultural Shredder Market Size (US$ Bn and Thousand Units), by Type, 2017 - 2031
14.5.1. Fixed
14.5.2. Portable
14.5.2.1. Self-driven
14.5.2.2. Attachments/Implements
14.6. Agricultural Shredder Market Size (US$ Bn and Thousand Units), by Equipment, 2017 - 2031
14.6.1. Flail Mowers and Shredders
14.6.2. Rotary Cutters
14.6.3. Grooming Mowers
14.7. Agricultural Shredder Market Size (US$ Bn and Thousand Units), by Operation, 2017 - 2031
14.7.1. Automatic
14.7.2. Semi- automatic
14.8. Agricultural Shredder Market Size (US$ Bn and Thousand Units), by Power Type, 2017 - 2031
14.8.1. Electric
14.8.2. Diesel
14.9. Agricultural Shredder Market Size (US$ Bn and Thousand Units), by Shredding Capacity (Kg/Hrs.), 2017 - 2031
14.9.1. Up to 100
14.9.2. 101-300
14.9.3. 301-500
14.9.4. 501- 1000
14.9.5. 1001 and above
14.10. Agricultural Shredder Market Size (US$ Bn and Thousand Units), by Power Range, 2017 - 2031
14.10.1. UP to 10
14.10.2. 11 to 20
14.10.3. 20 to 30
14.10.4. 31 to 40
14.10.5. 41 and above
14.11. Agricultural Shredder Market Size (US$ Bn and Thousand Units), by Distribution Channel, 2017 - 2031
14.11.1. Direct
14.11.2. Indirect
14.12. Agricultural Shredder Market Size (US$ Bn) (Thousand Units), by Country & Sub-region, 2017 - 2031
14.12.1. U.S.
14.12.2. Canada
14.12.3. Rest of North America
14.13. Incremental Opportunity Analysis
15. Europe Agricultural Shredder Market Analysis and Forecast
15.1. Regional Snapshot
15.2. Key Brand Analysis
15.3. Price Trend Analysis
15.3.1. Weighted Average Price
15.4. Key Trends Analysis
15.4.1. Demand Side Analysis
15.4.2. Supply Side Analysis
15.5. Agricultural Shredder Market Size (US$ Bn and Thousand Units), by Type, 2017 - 2031
15.5.1. Fixed
15.5.2. Portable
15.5.2.1. Self-Driven
15.5.2.2. Attachments/Implements
15.6. Agricultural Shredder Market Size (US$ Bn and Thousand Units), by Equipment, 2017 - 2031
15.6.1. Flail Mowers and Shredders
15.6.2. Rotary Cutters
15.6.3. Grooming Mowers
15.7. Agricultural Shredder Market Size (US$ Bn and Thousand Units), by Operation, 2017 - 2031
15.7.1. Automatic
15.7.2. Semi- automatic
15.8. Agricultural Shredder Market Size (US$ Bn and Thousand Units), by Power Type, 2017 - 2031
15.8.1. Electric
15.8.2. Diesel
15.9. Agricultural Shredder Market Size (US$ Bn and Thousand Units), by Shredding Capacity (Kg/Hrs.), 2017 - 2031
15.9.1. Up to 100
15.9.2. 101-300
15.9.3. 301-500
15.9.4. 501- 1000
15.9.5. 1001 and above
15.10. Agricultural Shredder Market Size (US$ Bn and Thousand Units), by Power Range, 2017 - 2031
15.10.1. UP to 10
15.10.2. 11 to 20
15.10.3. 20 to 30
15.10.4. 31 to 40
15.10.5. 41 and above
15.11. Agricultural Shredder Market Size (US$ Bn and Thousand Units), by Distribution Channel, 2017 - 2031
15.11.1. Direct
15.11.2. Indirect
15.12. Agricultural Shredder Market Size (US$ Bn) (Thousand Units), by Country & Sub-region, 2017 - 2031
15.12.1. U.K.
15.12.2. Germany
15.12.3. France
15.12.4. Rest of Europe
15.13. Incremental Opportunity Analysis
16. Asia Pacific Agricultural Shredder Market Analysis and Forecast
16.1. Regional Snapshot
16.2. Key Brand Analysis
16.3. Price Trend Analysis
16.3.1. Weighted Average Price
16.4. Key Trends Analysis
16.4.1. Demand Side Analysis
16.4.2. Supply Side Analysis
16.5. Agricultural Shredder Market Size (US$ Bn and Thousand Units), by Type, 2017 - 2031
16.5.1. Fixed
16.5.2. Portable
16.5.2.1. Self-driven
16.5.2.2. Attachments/Implements
16.6. Agricultural Shredder Market Size (US$ Bn and Thousand Units), by Equipment, 2017 - 2031
16.6.1. Flail Mowers and Shredders
16.6.2. Rotary Cutters
16.6.3. Grooming Mowers
16.7. Agricultural Shredder Market Size (US$ Bn and Thousand Units), by Operation, 2017 - 2031
16.7.1. Automatic
16.7.2. Semi- automatic
16.8. Agricultural Shredder Market Size (US$ Bn and Thousand Units), by Power Type, 2017 - 2031
16.8.1. Electric
16.8.2. Diesel
16.9. Agricultural Shredder Market Size (US$ Bn and Thousand Units), by Shredding Capacity (Kg/Hrs.), 2017 - 2031
16.9.1. Up to 100
16.9.2. 101-300
16.9.3. 301-500
16.9.4. 501- 1000
16.9.5. 1001 and above
16.10. Agricultural Shredder Market Size (US$ Bn and Thousand Units), by Power Range, 2017 - 2031
16.10.1. UP to 10
16.10.2. 11 to 20
16.10.3. 20 to 30
16.10.4. 31 to 40
16.10.5. 41 and above
16.11. Agricultural Shredder Market Size (US$ Bn and Thousand Units), by Distribution Channel, 2017 - 2031
16.11.1. Direct
16.11.2. Indirect
16.12. Agricultural Shredder Market Size (US$ Bn) (Thousand Units), by Country & Sub-region, 2017 - 2031
16.12.1. China
16.12.2. India
16.12.3. Japan
16.12.4. Rest of Asia Pacific
16.13. Incremental Opportunity Analysis
17. Middle East & Africa Agricultural Shredder Market Analysis and Forecast
17.1. Regional Snapshot
17.2. Key Brand Analysis
17.3. Price Trend Analysis
17.3.1. Weighted Average Price
17.4. Key Trends Analysis
17.4.1. Demand Side Analysis
17.4.2. Supply Side Analysis
17.5. Agricultural Shredder Market Size (US$ Bn and Thousand Units), by Type, 2017 - 2031
17.5.1. Fixed
17.5.2. Portable
17.5.2.1. Self-driven
17.5.2.2. Attachments/Implements
17.6. Agricultural Shredder Market Size (US$ Bn and Thousand Units), by Equipment, 2017 - 2031
17.6.1. Flail Mowers and Shredders
17.6.2. Rotary Cutters
17.6.3. Grooming Mowers
17.7. Agricultural Shredder Market Size (US$ Bn and Thousand Units), by Operation, 2017 - 2031
17.7.1. Automatic
17.7.2. Semi- automatic
17.8. Agricultural Shredder Market Size (US$ Bn and Thousand Units), by Power Type, 2017 - 2031
17.8.1. Electric
17.8.2. Diesel
17.9. Agricultural Shredder Market Size (US$ Bn and Thousand Units), by Shredding Capacity (Kg/Hrs.), 2017 - 2031
17.9.1. Up to 100
17.9.2. 101-300
17.9.3. 301-500
17.9.4. 501- 1000
17.9.5. 1001 and above
17.10. Agricultural Shredder Market Size (US$ Bn and Thousand Units), by Power Range, 2017 - 2031
17.10.1. UP to 10
17.10.2. 11 to 20
17.10.3. 20 to 30
17.10.4. 31 to 40
17.10.5. 41 and above
17.11. Agricultural Shredder Market Size (US$ Bn and Thousand Units), by Distribution Channel, 2017 - 2031
17.11.1. Direct
17.11.2. Indirect
17.12. Agricultural Shredder Market Size (US$ Bn) (Thousand Units), by Country & Sub-region, 2017 - 2031
17.12.1. GCC
17.12.2. South Africa
17.12.3. Rest of Middle East & Africa
17.13. Incremental Opportunity Analysis
18. South America Agricultural Shredder Market Analysis and Forecast
18.1. Regional Snapshot
18.2. Key Brand Analysis
18.3. Price Trend Analysis
18.3.1. Weighted Average Price
18.4. Key Trends Analysis
18.4.1. Demand Side Analysis
18.4.2. Supply Side Analysis
18.5. Agricultural Shredder Market Size (US$ Bn and Thousand Units), by Type, 2017 - 2031
18.5.1. Fixed
18.5.2. Portable
18.5.2.1. Self-driven
18.5.2.2. Attachments/Implements
18.6. Agricultural Shredder Market Size (US$ Bn and Thousand Units), by Equipment, 2017 - 2031
18.6.1. Flail Mowers and Shredders
18.6.2. Rotary Cutters
18.6.3. Grooming Mowers
18.7. Agricultural Shredder Market Size (US$ Bn and Thousand Units), by Operation, 2017 - 2031
18.7.1. Automatic
18.7.2. Semi- automatic
18.8. Agricultural Shredder Market Size (US$ Bn and Thousand Units), by Power Type, 2017 - 2031
18.8.1. Electric
18.8.2. Diesel
18.9. Agricultural Shredder Market Size (US$ Bn and Thousand Units), by Shredding Capacity (Kg/Hrs.), 2017 - 2031
18.9.1. Up to 100
18.9.2. 101-300
18.9.3. 301-500
18.9.4. 501- 1000
18.9.5. 1001 and above
18.10. Agricultural Shredder Market Size (US$ Bn and Thousand Units), by Power Range, 2017 - 2031
18.10.1. UP to 10
18.10.2. 11 to 20
18.10.3. 20 to 30
18.10.4. 31 to 40
18.10.5. 41 and above
18.11. Agricultural Shredder Market Size (US$ Bn and Thousand Units), by Distribution Channel, 2017 - 2031
18.11.1. Direct
18.11.2. Indirect
18.12. Agricultural Shredder Market Size (US$ Bn) (Bn Units), by Country & Sub-region, 2017 - 2031
18.12.1. Brazil
18.12.2. Rest of South America
18.13. Incremental Opportunity Analysis
19. Competition Landscape
19.1. Market Player – Competition Dashboard
19.2. Market Share Analysis % (2021)
19.3. Company Profiles (Details – Company Overview, Sales Area/Geographical Presence, Revenue, Strategy & Business Overview, Go-To-Market Strategy)
19.3.1. AGCO Corporation Bamford Excavators Limited
19.3.1.1. Company Overview
19.3.1.2. Sales Area/Geographical Presence
19.3.1.3. Revenue
19.3.1.4. Strategy & Business Overview
19.3.1.5. Go-To-Market Strategy
19.3.2. Alamo Group
19.3.2.1. Company Overview
19.3.2.2. Sales Area/Geographical Presence
19.3.2.3. Revenue
19.3.2.4. Strategy & Business Overview
19.3.2.5. Go-To-Market Strategy
19.3.3. Beri Udyog Private Limited
19.3.3.1. Company Overview
19.3.3.2. Sales Area/Geographical Presence
19.3.3.3. Revenue
19.3.3.4. Strategy & Business Overview
19.3.3.5. Go-To-Market Strategy
19.3.4. Bertolini
19.3.4.1. Company Overview
19.3.4.2. Sales Area/Geographical Presence
19.3.4.3. Revenue
19.3.4.4. Strategy & Business Overview
19.3.4.5. Go-To-Market Strategy
19.3.5. Bobcat Company
19.3.5.1. Company Overview
19.3.5.2. Sales Area/Geographical Presence
19.3.5.3. Revenue
19.3.5.4. Strategy & Business Overview
19.3.5.5. Go-To-Market Strategy
19.3.6. Changzhou Dongfeng Agricultural Machinery Group Co. Ltd.
19.3.6.1. Company Overview
19.3.6.2. Sales Area/Geographical Presence
19.3.6.3. Revenue
19.3.6.4. Strategy & Business Overview
19.3.6.5. Go-To-Market Strategy
19.3.7. Daedong Industry Co. Ltd.
19.3.7.1. Company Overview
19.3.7.2. Sales Area/Geographical Presence
19.3.7.3. Revenue
19.3.7.4. Strategy & Business Overview
19.3.7.5. Go-To-Market Strategy
19.3.8. Deere & Company
19.3.8.1. Company Overview
19.3.8.2. Sales Area/Geographical Presence
19.3.8.3. Revenue
19.3.8.4. Strategy & Business Overview
19.3.8.5. Go-To-Market Strategy
19.3.9. Iseki & Co., Ltd.
19.3.9.1. Company Overview
19.3.9.2. Sales Area/Geographical Presence
19.3.9.3. Revenue
19.3.9.4. Strategy & Business Overview
19.3.9.5. Go-To-Market Strategy
19.3.10. Kubota Corporation
19.3.10.1. Company Overview
19.3.10.2. Sales Area/Geographical Presence
19.3.10.3. Revenue
19.3.10.4. Strategy & Business Overview
19.3.10.5. Go-To-Market Strategy
19.3.11. Landoll Company. LLC.
19.3.11.1. Company Overview
19.3.11.2. Sales Area/Geographical Presence
19.3.11.3. Revenue
19.3.11.4. Strategy & Business Overview
19.3.11.5. Go-To-Market Strategy
19.3.12. Mahindra & Mahindra Limited
19.3.12.1. Company Overview
19.3.12.2. Sales Area/Geographical Presence
19.3.12.3. Revenue
19.3.12.4. Strategy & Business Overview
19.3.12.5. Go-To-Market Strategy
19.3.13. Mondo Machine / Machinery World
19.3.13.1. Company Overview
19.3.13.2. Sales Area/Geographical Presence
19.3.13.3. Revenue
19.3.13.4. Strategy & Business Overview
19.3.13.5. Go-To-Market Strategy
20. Key Takeaways
20.1. Identification of Potential Market Spaces
20.1.1. Type
20.1.2. Operation
20.1.3. Power Type
20.1.4. Shredding Capacity (Kg/Hrs.)
20.1.5. Power Range (HP)
20.1.6. Distribution Channel
20.1.7. Region
20.2. Preferred Sales & Marketing Strategy
20.3. Prevailing Market Risks
List of Tables
Table 1: Global Agricultural Shredder Market Value (US$ Bn) Projection By Type 2017-2031
Table 2: Global Agricultural Shredder Market Volume (Thousand Units) Projection By Type 2017-2031
Table 3: Global Agricultural Shredder Market Value (US$ Bn) Projection By Operation 2017-2031
Table 4: Global Agricultural Shredder Market Volume (Thousand Units) Projection By Operation 2017-2031
Table 5: Global Agricultural Shredder Market Value (US$ Bn) Projection By Power Range (HP) 2017-2031
Table 6: Global Agricultural Shredder Market Volume (Thousand units) Projection By Power Range (HP) 2017-2031
Table 7: Global Agricultural Shredder Market Value (US$ Bn) Projection By Shredding Capacity (Kg/Hrs.) 2017-2031
Table 8: Global Agricultural Shredder Market Volume (Thousand units) Projection By Shredding Capacity (Kg/Hrs.) 2017-2031
Table 9: Global Agricultural Shredder Market Value (US$ Bn) Projection By Power Type 2017-2031
Table 10: Global Agricultural Shredder Market Volume (Thousand units) Projection By Power Type 2017-2031
Table 11: Global Agricultural Shredder Market Value (US$ Bn) Projection By Equipment 2017-2031
Table 12: Global Agricultural Shredder Market Volume (Thousand units) Projection By Equipment 2017-2031
Table 13: Global Agricultural Shredder Market Value (US$ Bn) Projection By Distribution Channel 2017-2031
Table 14: Global Agricultural Shredder Market Volume (Thousand units) Projection By Distribution Channel 2017-2031
Table 15: Global Agricultural Shredder Market Value (US$ Bn) Projection By Region 2017-2031
Table 16: Global Agricultural Shredder Market Volume (Thousand units) Projection By Region 2017-2031
Table 17: North America Agricultural Shredder Market Value (US$ Bn) Projection By Type 2017-2031
Table 18: North America Agricultural Shredder Market Volume (Thousand units) Projection By Type 2017-2031
Table 19: North America Agricultural Shredder Market Value (US$ Bn) Projection By Operation 2017-2031
Table 20: North America Agricultural Shredder Market Volume (Thousand units) Projection By Operation 2017-2031
Table 21: North America Agricultural Shredder Market Value (US$ Bn) Projection By Power Range (HP) 2017-2031
Table 22: North America Agricultural Shredder Market Volume (Thousand units) Projection By Power Range (HP) 2017-2031
Table 23: North America Agricultural Shredder Market Value (US$ Bn) Projection By Shredding Capacity (Kg/Hrs.) 2017-2031
Table 24: North America Agricultural Shredder Market Volume (Thousand units) Projection By Shredding Capacity (Kg/Hrs.) 2017-2031
Table 25: North America Agricultural Shredder Market Value (US$ Bn) Projection By Power Type 2017-2031
Table 26: North America Agricultural Shredder Market Volume (Thousand units) Projection By Power Type 2017-2031
Table 27: North America Agricultural Shredder Market Value (US$ Bn) Projection By Equipment 2017-2031
Table 28: North America Agricultural Shredder Market Volume (Thousand units) Projection By Equipment 2017-2031
Table 29: North America Agricultural Shredder Market Value (US$ Bn) Projection By Distribution Channel 2017-2031
Table 30: North America Agricultural Shredder Market Volume (Thousand units) Projection By Distribution Channel 2017-2031
Table 31: North America Agricultural Shredder Market Value (US$ Bn) Projection By Country 2017-2031
Table 32: North America Agricultural Shredder Market Volume (Thousand units) Projection By Country 2017-2031
Table 33: Europe Agricultural Shredder Market Value (US$ Bn) Projection By Type 2017-2031
Table 34: Europe Agricultural Shredder Market Volume (Thousand units) Projection By Type 2017-2031
Table 35: Europe Agricultural Shredder Market Value (US$ Bn) Projection By Operation 2017-2031
Table 36: Europe Agricultural Shredder Market Volume (Thousand units) Projection By Operation 2017-2031
Table 37: Europe Agricultural Shredder Market Value (US$ Bn) Projection By Power Range (HP) 2017-2031
Table 38: Europe Agricultural Shredder Market Volume (Thousand units) Projection By Power Range (HP) 2017-2031
Table 39: Europe Agricultural Shredder Market Value (US$ Bn) Projection By Shredding Capacity (Kg/Hrs.) 2017-2031
Table 40: Europe Agricultural Shredder Market Volume (Thousand units) Projection By Shredding Capacity (Kg/Hrs.) 2017-2031
Table 41: Europe Agricultural Shredder Market Value (US$ Bn) Projection By Power Type 2017-2031
Table 42: Europe Agricultural Shredder Market Volume (Thousand units) Projection By Power Type 2017-2031
Table 43: Europe Agricultural Shredder Market Value (US$ Bn) Projection By Equipment 2017-2031
Table 44: Europe Agricultural Shredder Market Volume (Thousand units) Projection By Equipment 2017-2031
Table 45: Europe Agricultural Shredder Market Value (US$ Bn) Projection By Distribution Channel 2017-2031
Table 46: Europe Agricultural Shredder Market Volume (Thousand units) Projection By Distribution Channel 2017-2031
Table 47: Europe Agricultural Shredder Market Value (US$ Bn) Projection By Country 2017-2031
Table 48: Europe Agricultural Shredder Market Volume (Thousand units) Projection By Country 2017-2031
Table 49: Asia Pacific Agricultural Shredder Market Value (US$ Bn) Projection By Type 2017-2031
Table 50: Asia Pacific Agricultural Shredder Market Volume (Thousand units) Projection By Type 2017-2031
Table 51: Asia Pacific Agricultural Shredder Market Value (US$ Bn) Projection By Operation 2017-2031
Table 52: Asia Pacific Agricultural Shredder Market Volume (Thousand units) Projection By Operation 2017-2031
Table 53: Asia Pacific Agricultural Shredder Market Value (US$ Bn) Projection By Power Range (HP) 2017-2031
Table 54: Asia Pacific Agricultural Shredder Market Volume (Thousand units) Projection By Power Range (HP) 2017-2031
Table 55: Asia Pacific Agricultural Shredder Market Value (US$ Bn) Projection By Shredding Capacity (Kg/Hrs.) 2017-2031
Table 56: Asia Pacific Agricultural Shredder Market Volume (Thousand units) Projection By Shredding Capacity (Kg/Hrs.) 2017-2031
Table 57: Asia Pacific Agricultural Shredder Market Value (US$ Bn) Projection By Power Type 2017-2031
Table 58: Asia Pacific Agricultural Shredder Market Volume (Thousand units) Projection By Power Type 2017-2031
Table 59: Asia Pacific Agricultural Shredder Market Value (US$ Bn) Projection By Equipment 2017-2031
Table 60: Asia Pacific Agricultural Shredder Market Volume (Thousand units) Projection By Equipment 2017-2031
Table 61: Asia Pacific Agricultural Shredder Market Value (US$ Bn) Projection By Distribution Channel 2017-2031
Table 62: Asia Pacific Agricultural Shredder Market Volume (Thousand units) Projection By Distribution Channel 2017-2031
Table 63: Asia Pacific Agricultural Shredder Market Value (US$ Bn) Projection By Country 2017-2031
Table 64: Asia Pacific Agricultural Shredder Market Volume (Thousand units) Projection By Country 2017-2031
Table 65: Middle East & Africa Agricultural Shredder Market Value (US$ Bn) Projection By Type 2017-2031
Table 66: Middle East & Africa Agricultural Shredder Market Volume (Thousand units) Projection By Type 2017-2031
Table 67: Middle East & Africa Agricultural Shredder Market Value (US$ Bn) Projection By Operation 2017-2031
Table 68: Middle East & Africa Agricultural Shredder Market Volume (Thousand units) Projection By Operation 2017-2031
Table 69: Middle East & Africa Agricultural Shredder Market Value (US$ Bn) Projection By Power Range (HP) 2017-2031
Table 70: Middle East & Africa Agricultural Shredder Market Volume (Thousand units) Projection By Power Range (HP) 2017-2031
Table 71: Middle East & Africa Agricultural Shredder Market Value (US$ Bn) Projection By Shredding Capacity (Kg/Hrs.) 2017-2031
Table 72: Middle East & Africa Agricultural Shredder Market Volume (Thousand units) Projection By Shredding Capacity (Kg/Hrs.) 2017-2031
Table 73: Middle East & Africa Agricultural Shredder Market Value (US$ Bn) Projection By Power Type 2017-2031
Table 74: Middle East & Africa Agricultural Shredder Market Volume (Thousand units) Projection By Power Type 2017-2031
Table 75: Middle East & Africa Agricultural Shredder Market Value (US$ Bn) Projection By Equipment 2017-2031
Table 76: Middle East & Africa Agricultural Shredder Market Volume (Thousand units) Projection By Equipment 2017-2031
Table 77: Middle East & Africa Agricultural Shredder Market Value (US$ Bn) Projection By Distribution Channel 2017-2031
Table 78: Middle East & Africa Agricultural Shredder Market Volume (Thousand units) Projection By Distribution Channel 2017-2031
Table 79: Middle East & Africa Agricultural Shredder Market Value (US$ Bn) Projection By Country 2017-2031
Table 80: Middle East & Africa Agricultural Shredder Market Volume (Thousand units) Projection By Country 2017-2031
Table 81: South America Agricultural Shredder Market Value (US$ Bn) Projection By Type 2017-2031
Table 82: South America Agricultural Shredder Market Volume (Thousand units) Projection By Type 2017-2031
Table 83: South America Agricultural Shredder Market Value (US$ Bn) Projection By Operation 2017-2031
Table 84: South America Agricultural Shredder Market Volume (Thousand units) Projection By Operation 2017-2031
Table 85: South America Agricultural Shredder Market Value (US$ Bn) Projection By Power Range (HP) 2017-2031
Table 86: South America Agricultural Shredder Market Volume (Thousand units) Projection By Power Range (HP) 2017-2031
Table 87: South America Agricultural Shredder Market Value (US$ Bn) Projection By Shredding Capacity (Kg/Hrs.) 2017-2031
Table 88: South America Agricultural Shredder Market Volume (Thousand units) Projection By Shredding Capacity (Kg/Hrs.) 2017-2031
Table 89: South America Agricultural Shredder Market Value (US$ Bn) Projection By Power Type 2017-2031
Table 90: South America Agricultural Shredder Market Volume (Thousand units) Projection By Power Type 2017-2031
Table 91: South America Agricultural Shredder Market Value (US$ Bn) Projection By Equipment 2017-2031
Table 92: South America Agricultural Shredder Market Volume (Thousand units) Projection By Equipment 2017-2031
Table 93: South America Agricultural Shredder Market Value (US$ Bn) Projection By Distribution Channel 2017-2031
Table 94: South America Agricultural Shredder Market Volume (Thousand units) Projection By Distribution Channel 2017-2031
Table 95: South America Agricultural Shredder Market Value (US$ Bn) Projection By Country 2017-2031
Table 96: South America Agricultural Shredder Market Volume (Thousand units) Projection By Country 2017-2031
List of Figures
Figure 1: Global Agricultural Shredder Market Value (US$ Bn) Projection, By Type 2017-2031
Figure 2: Global Agricultural Shredder Market Volume (Thousand Units) Projection, By Type 2017-2031
Figure 3: Global Agricultural Shredder Market, Incremental Opportunities (US$ Bn), Forecast, by Type 2022-2031
Figure 4: Global Agricultural Shredder Market Value (US$ Bn) Projection, By Operation 2022-2031
Figure 5: Global Agricultural Shredder Market Volume (Thousand Units) Projection, By Operation 2022-2031
Figure 6: Global Agricultural Shredder Market, Incremental Opportunities (US$ Bn), Forecast, by Operation 2022-2031
Figure 7: Global Agricultural Shredder Market Value (US$ Bn) Projection, By Power Range (HP) 2022-2031
Figure 8: Global Agricultural Shredder Market Volume (Thousand Units) Projection, By Power Range (HP) 2022-2031
Figure 9: Global Agricultural Shredder Market, Incremental Opportunities (US$ Bn), Forecast, by Power Range (HP) 2022-2031
Figure 10: Global Agricultural Shredder Market Value (US$ Bn) Projection, By Shredding Capacity (Kg/Hrs.) 2022-2031
Figure 11: Global Agricultural Shredder Market Volume (Thousand Units) Projection, By Shredding Capacity (Kg/Hrs.) 2022-2031
Figure 12: Global Agricultural Shredder Market, Incremental Opportunities (US$ Bn), Forecast, by Shredding Capacity (Kg/Hrs.) 2022-2031
Figure 13: Global Agricultural Shredder Market Value (US$ Bn) Projection, By Power Type 2022-2031
Figure 14: Global Agricultural Shredder Market Volume (Thousand Units) Projection, By Power Type 2022-2031
Figure 15: Global Agricultural Shredder Market, Incremental Opportunities (US$ Bn), Forecast, by Power Type 2022-2031
Figure 16: Global Agricultural Shredder Market Value (US$ Bn) Projection, By Equipment 2017-2031
Figure 17: Global Agricultural Shredder Market Volume (Thousand Units) Projection, By Equipment 2017-2031
Figure 18: Global Agricultural Shredder Market, Incremental Opportunities (US$ Bn), Forecast, by Equipment 2022-2031
Figure 19: Global Agricultural Shredder Market Value (US$ Bn) Projection, By Distribution Channel 2017-2031
Figure 20: Global Agricultural Shredder Market Volume (Thousand Units) Projection, By Distribution Channel 2017-2031
Figure 21: Global Agricultural Shredder Market, Incremental Opportunities (US$ Bn), Forecast, by Distribution Channel 2022-2031
Figure 22: Global Agricultural Shredder Market Value (US$ Bn) Projection, By Region 2017-2031
Figure 23: Global Agricultural Shredder Market Volume (Thousand Units) Projection, By Region 2017-2031
Figure 24: Global Agricultural Shredder Market, Incremental Opportunities (US$ Bn), Forecast, by Region 2022-2031
Figure 25: North America Agricultural Shredder Market Value (US$ Bn) Projection, By Type 2017-2031
Figure 26: North America Agricultural Shredder Market Volume (Thousand Units) Projection, By Type 2017-2031
Figure 27: North America Agricultural Shredder Market, Incremental Opportunities (US$ Bn), Forecast, by Type 2022-2031
Figure 28: North America Agricultural Shredder Market Value (US$ Bn) Projection, By Operation 2017-2031
Figure 29: North America Agricultural Shredder Market Volume (Thousand Units) Projection, By Operation 2017-2031
Figure 30: North America Agricultural Shredder Market, Incremental Opportunities (US$ Bn), Forecast, by Operation 2022-2031
Figure 31: North America Agricultural Shredder Market Value (US$ Bn) Projection, By Power Range (HP) 2017-2031
Figure 32: North America Agricultural Shredder Market Volume (Thousand Units) Projection, By Power Range (HP) 2017-2031
Figure 33: North America Agricultural Shredder Market, Incremental Opportunities (US$ Bn), Forecast, by Power Range (HP) 2022-2031
Figure 34: North America Agricultural Shredder Market Value (US$ Bn) Projection, By Shredding Capacity (Kg/Hrs.) 2017-2031
Figure 35: North America Agricultural Shredder Market Volume (Thousand Units) Projection, By Shredding Capacity (Kg/Hrs.) 2017-2031
Figure 36: North America Agricultural Shredder Market, Incremental Opportunities (US$ Bn), Forecast, by Shredding Capacity (Kg/Hrs.) 2022-2031
Figure 37: North America Agricultural Shredder Market Value (US$ Bn) Projection, By Power Type 2017-2031
Figure 38: North America Agricultural Shredder Market Volume (Thousand Units) Projection, By Power Type 2017-2031
Figure 39: North America Agricultural Shredder Market, Incremental Opportunities (US$ Bn), Forecast, by Power Type 2022-2031
Figure 40: North America Agricultural Shredder Market Value (US$ Bn) Projection, By Equipment 2017-2031
Figure 41: North America Agricultural Shredder Market Volume (Thousand Units) Projection, By Equipment 2017-2031
Figure 42: North America Agricultural Shredder Market, Incremental Opportunities (US$ Bn), Forecast, by Equipment 2022-2031
Figure 43: North America Agricultural Shredder Market Value (US$ Bn) Projection, By Distribution Channel 2017-2031
Figure 44: North America Agricultural Shredder Market Volume (Thousand Units) Projection, By Distribution Channel 2017-2031
Figure 45: North America Agricultural Shredder Market, Incremental Opportunities (US$ Bn), Forecast, by Distribution Channel 2022-2031
Figure 46: North America Agricultural Shredder Market Value (US$ Bn) Projection, By Country 2017-2031
Figure 47: North America Agricultural Shredder Market Volume (Thousand Units) Projection, By Country 2017-2031
Figure 48: North America Agricultural Shredder Market, Incremental Opportunities (US$ Bn), Forecast, by Country 2022-2031
Figure 49: Europe Agricultural Shredder Market Value (US$ Bn) Projection, By Type 2017-2031
Figure 50: Europe Agricultural Shredder Market Volume (Thousand Units) Projection, By Type 2017-2031
Figure 51: Europe Agricultural Shredder Market, Incremental Opportunities (US$ Bn), Forecast, by Type 2022-2031
Figure 52: Europe Agricultural Shredder Market Value (US$ Bn) Projection, By Operation 2017-2031
Figure 53: Europe Agricultural Shredder Market Volume (Thousand Units) Projection, By Operation 2017-2031
Figure 54: Europe Agricultural Shredder Market, Incremental Opportunities (US$ Bn), Forecast, by Operation 2022-2031
Figure 55: Europe Agricultural Shredder Market Value (US$ Bn) Projection, By Power Range (HP) 2017-2031
Figure 56: Europe Agricultural Shredder Market Volume (Thousand Units) Projection, By Power Range (HP) 2017-2031
Figure 57: Europe Agricultural Shredder Market, Incremental Opportunities (US$ Bn), Forecast, by Power Range (HP) 2022-2031
Figure 58: Europe Agricultural Shredder Market Value (US$ Bn) Projection, By Shredding Capacity (Kg/Hrs.) 2017-2031
Figure 59: Europe Agricultural Shredder Market Volume (Thousand Units) Projection, By Shredding Capacity (Kg/Hrs.) 2017-2031
Figure 60: Europe Agricultural Shredder Market, Incremental Opportunities (US$ Bn), Forecast, by Shredding Capacity (Kg/Hrs.) 2022-2031
Figure 61: Europe Agricultural Shredder Market Value (US$ Bn) Projection, By Power Type 2017-2031
Figure 62: Europe Agricultural Shredder Market Volume (Thousand Units) Projection, By Power Type 2017-2031
Figure 63: Europe Agricultural Shredder Market, Incremental Opportunities (US$ Bn), Forecast, by Power Type 2022-2031
Figure 64: Europe Agricultural Shredder Market Value (US$ Bn) Projection, By Equipment 2017-2031
Figure 65: Europe Agricultural Shredder Market Volume (Thousand Units) Projection, By Equipment 2017-2031
Figure 66: Europe Agricultural Shredder Market, Incremental Opportunities (US$ Bn), Forecast, by Equipment 2022-2031
Figure 67: Europe Agricultural Shredder Market Value (US$ Bn) Projection, By Distribution Channel 2017-2031
Figure 68: Europe Agricultural Shredder Market Volume (Thousand Units) Projection, By Distribution Channel 2017-2031
Figure 69: Europe Agricultural Shredder Market, Incremental Opportunities (US$ Bn), Forecast, by Distribution Channel 2022-2031
Figure 70: Europe Agricultural Shredder Market Value (US$ Bn) Projection, By Country 2017-2031
Figure 71: Europe Agricultural Shredder Market Volume (Thousand Units) Projection, By Country 2017-2031
Figure 72: Europe Agricultural Shredder Market, Incremental Opportunities (US$ Bn), Forecast, by Country 2022-2031
Figure 73: Asia Pacific Agricultural Shredder Market Value (US$ Bn) Projection, By Type 2017-2031
Figure 74: Asia Pacific Agricultural Shredder Market Volume (Thousand Units) Projection, By Type 2017-2031
Figure 75: Asia Pacific Agricultural Shredder Market, Incremental Opportunities (US$ Bn), Forecast, by Type 2022-2031
Figure 76: Asia Pacific Agricultural Shredder Market Value (US$ Bn) Projection, By Operation 2017-2031
Figure 77: Asia Pacific Agricultural Shredder Market Volume (Thousand Units) Projection, By Operation 2017-2031
Figure 78: Asia Pacific Agricultural Shredder Market, Incremental Opportunities (US$ Bn), Forecast, by Operation 2022-2031
Figure 79: Asia Pacific Agricultural Shredder Market Value (US$ Bn) Projection, By Power Range (HP) 2017-2031
Figure 80: Asia Pacific Agricultural Shredder Market Volume (Thousand Units) Projection, By Power Range (HP) 2017-2031
Figure 81: Asia Pacific Agricultural Shredder Market, Incremental Opportunities (US$ Bn), Forecast, by Power Range (HP) 2022-2031
Figure 82: Asia Pacific Agricultural Shredder Market Value (US$ Bn) Projection, By Shredding Capacity (Kg/Hrs.) 2017-2031
Figure 83: Asia Pacific Agricultural Shredder Market Volume (Thousand Units) Projection, By Shredding Capacity (Kg/Hrs.) 2017-2031
Figure 84: Asia Pacific Agricultural Shredder Market, Incremental Opportunities (US$ Bn), Forecast, by Shredding Capacity (Kg/Hrs.) 2022-2031
Figure 85: Asia Pacific Agricultural Shredder Market Value (US$ Bn) Projection, By Power Type 2022-2031
Figure 86: Asia Pacific Agricultural Shredder Market Volume (Thousand Units) Projection, By Power Type 2022-2031
Figure 87: Asia Pacific Agricultural Shredder Market, Incremental Opportunities (US$ Bn), Forecast, by Power Type 2022-2031
Figure 88: Asia Pacific Agricultural Shredder Market Value (US$ Bn) Projection, By Equipment 2022-2031
Figure 89: Asia Pacific Agricultural Shredder Market Volume (Thousand Units) Projection, By Equipment 2022-2031
Figure 90: Asia Pacific Agricultural Shredder Market, Incremental Opportunities (US$ Bn), Forecast, by Equipment 2022-2031
Figure 91: Asia Pacific Agricultural Shredder Market Value (US$ Bn) Projection, By Distribution Channel 2022-2031
Figure 92: Asia Pacific Agricultural Shredder Market Volume (Thousand Units) Projection, By Distribution Channel 2022-2031
Figure 93: Asia Pacific Agricultural Shredder Market, Incremental Opportunities (US$ Bn), Forecast, by Distribution Channel 2022-2031
Figure 94: Asia Pacific Agricultural Shredder Market Value (US$ Bn) Projection, By Country 2022-2031
Figure 95: Asia Pacific Agricultural Shredder Market Volume (Thousand Units) Projection, By Country 2022-2031
Figure 96: Asia Pacific Agricultural Shredder Market, Incremental Opportunities (US$ Bn), Forecast, by Country 2022-2031
Figure 97: Middle East & Africa Agricultural Shredder Market Value (US$ Bn) Projection, By Type 2022-2031
Figure 98: Middle East & Africa Agricultural Shredder Market Volume (Thousand Units) Projection, By Type 2022-2031
Figure 99: Middle East & Africa Agricultural Shredder Market, Incremental Opportunities (US$ Bn), Forecast, by Type 2022-2031
Figure 100: Middle East & Africa Agricultural Shredder Market Value (US$ Bn) Projection, By Operation 2022-2031
Figure 101: Middle East & Africa Agricultural Shredder Market Volume (Thousand Units) Projection, By Operation 2022-2031
Figure 102: Middle East & Africa Agricultural Shredder Market, Incremental Opportunities (US$ Bn), Forecast, by Operation 2022-2031
Figure 103: Middle East & Africa Agricultural Shredder Market Value (US$ Bn) Projection, By Power Range (HP) 2022-2031
Figure 104: Middle East & Africa Agricultural Shredder Market Volume (Thousand Units) Projection, By Power Range (HP) 2022-2031
Figure 105: Middle East & Africa Agricultural Shredder Market, Incremental Opportunities (US$ Bn), Forecast, by Power Range (HP) 2022-2031
Figure 106: Middle East & Africa Agricultural Shredder Market Value (US$ Bn) Projection, By Shredding Capacity (Kg/Hrs.) 2022-2031
Figure 107: Middle East & Africa Agricultural Shredder Market Volume (Thousand Units) Projection, By Shredding Capacity (Kg/Hrs.) 2022-2031
Figure 108: Middle East & Africa Agricultural Shredder Market, Incremental Opportunities (US$ Bn), Forecast, by Shredding Capacity (Kg/Hrs.) 2022-2031
Figure 109: Middle East & Africa Agricultural Shredder Market Value (US$ Bn) Projection, By Power Type 2022-2031
Figure 110: Middle East & Africa Agricultural Shredder Market Volume (Thousand Units) Projection, By Power Type 2022-2031
Figure 111: Middle East & Africa Agricultural Shredder Market, Incremental Opportunities (US$ Bn), Forecast, by Power Type 2022-2031
Figure 112: Middle East & Africa Agricultural Shredder Market Value (US$ Bn) Projection, By Equipment 2022-2031
Figure 113: Middle East & Africa Agricultural Shredder Market Volume (Thousand Units) Projection, By Equipment 2022-2031
Figure 114: Middle East & Africa Agricultural Shredder Market, Incremental Opportunities (US$ Bn), Forecast, by Equipment 2022-2031
Figure 115: Middle East & Africa Agricultural Shredder Market Value (US$ Bn) Projection, By Distribution Channel 2022-2031
Figure 116: Middle East & Africa Agricultural Shredder Market Volume (Thousand Units) Projection, By Distribution Channel 2022-2031
Figure 117: Middle East & Africa Agricultural Shredder Market, Incremental Opportunities (US$ Bn), Forecast, by Distribution Channel 2022-2031
Figure 118: Middle East & Africa Agricultural Shredder Market Value (US$ Bn) Projection, By Country 2022-2031
Figure 119: Middle East & Africa Agricultural Shredder Market Volume (Thousand Units) Projection, By Country 2022-2031
Figure 120: Middle East & Africa Agricultural Shredder Market, Incremental Opportunities (US$ Bn), Forecast, by Country 2022-2031
Figure 121: South America Agricultural Shredder Market Value (US$ Bn) Projection, By Type 2022-2031
Figure 122: South America Agricultural Shredder Market Volume (Thousand Units) Projection, By Type 2022-2031
Figure 123: South America Agricultural Shredder Market, Incremental Opportunities (US$ Bn), Forecast, by Type 2022-2031
Figure 124: South America Agricultural Shredder Market Value (US$ Bn) Projection, By Operation 2022-2031
Figure 125: South America Agricultural Shredder Market Volume (Thousand Units) Projection, By Operation 2022-2031
Figure 126: South America Agricultural Shredder Market, Incremental Opportunities (US$ Bn), Forecast, by Operation 2022-2031
Figure 127: South America Agricultural Shredder Market Value (US$ Bn) Projection, By Power Range (HP) 2022-2031
Figure 128: South America Agricultural Shredder Market Volume (Thousand Units) Projection, By Power Range (HP) 2022-2031
Figure 129: South America Agricultural Shredder Market, Incremental Opportunities (US$ Bn), Forecast, by Power Range (HP) 2022-2031
Figure 130: South America Agricultural Shredder Market Value (US$ Bn) Projection, By Shredding Capacity (Kg/Hrs.) 2022-2031
Figure 131: South America Agricultural Shredder Market Volume (Thousand Units) Projection, By Shredding Capacity (Kg/Hrs.) 2022-2031
Figure 132: South America Agricultural Shredder Market, Incremental Opportunities (US$ Bn), Forecast, by Shredding Capacity (Kg/Hrs.) 2022-2031
Figure 133: South America Agricultural Shredder Market Value (US$ Bn) Projection, By Power Type 2022-2031
Figure 134: South America Agricultural Shredder Market Volume (Thousand Units) Projection, By Power Type 2022-2031
Figure 135: South America Agricultural Shredder Market, Incremental Opportunities (US$ Bn), Forecast, by Power Type 2022-2031
Figure 136: South America Agricultural Shredder Market Value (US$ Bn) Projection, By Equipment 2022-2031
Figure 137: South America Agricultural Shredder Market Volume (Thousand Units) Projection, By Equipment 2022-2031
Figure 138: South America Agricultural Shredder Market, Incremental Opportunities (US$ Bn), Forecast, by Equipment 2022-2031
Figure 139: South America Agricultural Shredder Market Value (US$ Bn) Projection, By Distribution Channel 2022-2031
Figure 140: South America Agricultural Shredder Market Volume (Thousand Units) Projection, By Distribution Channel 2022-2031
Figure 141: South America Agricultural Shredder Market, Incremental Opportunities (US$ Bn), Forecast, by Distribution Channel 2022-2031
Figure 142: South America Agricultural Shredder Market Value (US$ Bn) Projection, By Country 2022-2031
Figure 143: South America Agricultural Shredder Market Volume (Thousand Units) Projection, By Country 2022-2031
Figure 144: South America Agricultural Shredder Market, Incremental Opportunities (US$ Bn), Forecast, by Country 2022-2031
Copyright © Transparency Market Research, Inc. All Rights reserved
Trust Online

Agricultural Shredder Market