
Reports
Reports
Analysts’ Viewpoint on Farm Tractor Market Scenario
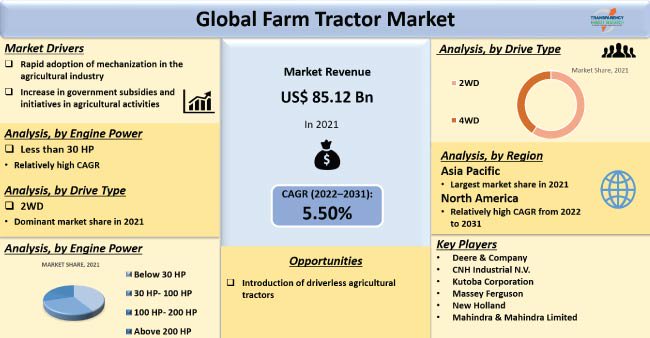
Rapid rise in adoption of mechanization in the agriculture industry, increase in number of medium-scale farmers, and proactive government initiatives are key factors that are likely to propel the global farm tractor market during the forecast period. Surge in demand for compact tractors in small farms and technological advancements, such as integrating telematics with agricultural tractors, are also driving the global market. Increased need for operational efficiency and profitability and rise in labor costs in developing countries such as the U.S., fuel the growth prospects for farm tractor market. Growing urbanization has increased the shortage of skilled laborers for agricultural activities. This shortage is expected to create opportunities for the global farm tractor market. Rise in adoption of driverless agricultural tractors for improving productivity in farming activities is the emerging trend of the farm tractor market.
A tractor is an industrial vehicle; usually with one or two small wheels in front, and two large wheels at the back to carry out agricultural and other functions. It is used to move the attached implement that plows the field or performs other activities. Farm tractors are primarily utilized in the farm for a wide range of farming operations including tilling, ploughing, and planting fields. Farm tractors are also utilized to spread fertilizers, clear bushes, etc. Major companies are manufacturing tractors for specific customer requirements, therefore a wide range of modern farm tractors or tractor farm equipment are available in the market. Modern electric farm tractors are suitable for various farming operational requirements. Utilization of tractors in farming improves productivity with minimum resources. Tractors are also used for industrial and construction purposes. Increase in farm cash receipt, i.e. profit and revenue generated from farming, boosts the affordability of tractors, which is estimated to fuel the agriculture tractor market in the next few years. For instance, the Government of India as well as state governments initiated several schemes that assist to diminish the plight of farmers.
Governments in developing economies provide generous subsidies for the purchase of farm tractors to encourage modernized farming. Additionally, governments of various countries have promoted the adoption of machinery for agricultural activities. This has resulted in an increase in preference for mechanized processes over traditional agriculture practices. Thus, in turn, is likely to propel the demand for farm tractors in the future. India has a lower level of mechanization as compared to other developing countries such as China, U.S., and Brazil; however, mechanization is definitely growing at a rapid pace in the country. For instance, the Government of India is encouraging ‘Balanced Farm Mechanization’ to raise the mechanization level, by providing subsidies on agricultural tractors, which is expected to boost the agricultural tractor market during the forecast period. The goal of the government is to promote the growth of the farming sector through its Rashtriya Krishi Vikasa Yojana (RKVY). The scheme is being implemented throughout India with 100% central assistance to increase the level of farm mechanization in India in the farming sector. Likewise, the Government of Canada has implemented the ‘Canadian Agricultural Loans Act’ (CALA) program that provides farmers with a loan of up to US$ 500,000 to purchase land or farm machinery. All these factors are expected to improve the scope for farm tractor market during the forecast period.
Precision farming and increase in adoption of farm technology to boost production are driving the demand for tractors. Increase in number of farm training programs promoting the use of agricultural machinery on a wide scale is also driving the tractor industry. Tractors with an engine volume of not more than 1,500 CC occupy less space and can be used with greater flexibility. Ease of customization makes them more amenable to experimentation, and consequentially, manufacturers are willing to try new components and technologies in this segment before moving on to high-powered ones. Low-horsepower tractors work well in soft soil conditions, such as river basins. The lesser than 40 HP tractors are primarily used for horticulture.
Demand for lower HP tractors is high in developing countries due to the low disposable income of farmers and high labor costs. Farmers prefer small and customized tractors for agricultural purposes due to small farmland sizes. Moreover, lesser fuel consumption by small tractors helps empower small and marginal farmers. Like India, governments in developing countries promote farm mechanization by subsidizing equipment purchases and supporting bulk buying through front-end agencies. Major players in the market are innovating new products due to increase in demand from developing countries. These factors are likely to boost the sales forecast for farm tractor market during the forecast period.
Based on engine power, the global farm tractor market has been classified into below 30 HP, 30 HP – 100 HP, 100 HP – 200 HP, and above 200 HP. The below 30 HP segment held major share of 39.10% of the global market in 2021. The segment is anticipated to maintain its share in the market and expand at a CAGR of more than 6.10% during the forecast period. The high growth is attributed to the low-cost, compact, and convenient tractors having engine power of less than 30 HP. This tractor agriculture equipment is adopted primarily in Asia Pacific, where approximately 80% of farmlands are below 10 hectares and are preferred by most farmers in the region for performing all the basic farming operations.
Compact tractors, commonly known as compact utility tractors, are manufactured for small farms. Compact tractors have a power lift for implements. Furthermore, these tractors are designed to be attached to a wide range of implements, including small farm implements, front-end loaders, and small backhoes. These tractors are often budget-friendly. If strength, reliability, and durability are the features to be considered, compact tractors are the best choice in a specified price range. All these factors are likely to boost the farm tractor market across the globe.
In terms of drive type, the global farm tractor market has been bifurcated into 2WD and 4WD. The 2WD segment held major share of 59.10% of the global farm tractor market in 2021. The segment is estimated to maintain its position in the market and expand at a CAGR of more than 4.56% during the forecast period. Low upfront cost and better maneuverability are major factors that are expected to drive the demand for 2 wheel-drive tractors, notably in Asia Pacific. 2WD tractors are preferred by middle-income farmers in India. However, a hike in diesel prices has already increased the operation cost for farmers, which is expected to hamper the 2WD segment growth during the forecast period. Followed by 2WD, the 4WD segment is expected to register significant growth during the forecast period, owing to rise in demand for high-power agricultural tractors to perform various agricultural activities efficiently. For instance, powerful agricultural tasks such as tilling and sowing can be easily performed with 4WD tractors.
Asia Pacific dominated the global farm tractor market in 2021. It is expected to hold more than 37.05% share of the global farm tractor market during the forecast period. This is due to the strong presence of the agricultural sector in emerging countries of Asia Pacific, including China and India. Initiatives by governments of several countries in Asia to encourage the adoption of modern farming techniques are anticipated to drive the market in the region during the forecast period. Rise in export of various agricultural products is anticipated to fuel the farming sector. This is expected to further surge in demand for farm tractors across the region.
Europe holds a significant share of the global farm tractor market, followed by North America. Shortage of skilled laborers in Europe and North America is expected to drive the demand for farm tractors in these regions. Technological advancement in these regions is also projected to fuel the demand for automated farming tractors in the next few years.
The global farm tractor market is consolidated, with a few tractor manufacturers controlling majority of the share. Prominent companies in the market possess the potential to increase the pace of growth by adopting newer technologies. Expansion of product portfolios and mergers and acquisitions are major strategies adopted by key players. Some of the key players operating in the global farm tractor market are Deere & Company, Mahindra Group, Kubota Corporation, Yanmar, Massey Ferguson, Farmtac, Dongfeng, Kioti Tractor, New Holland, SDF Group, Valtra Tractor, Argo Tractors S.p.A., CNH Industrial N.V., CLAAS Agricultural Machinery Private Limited, Eicher Motors Limited, Escorts Limited, Force Motors Limited, Mahindra & Mahindra Limited, International Tractors Limited (Sonalika) and TAFE Limited.
Each of these players has been profiled in the farm tractor market report based on parameters such as company overview, financial overview, business strategies, product portfolio, business segments, and recent developments.
|
Attribute |
Detail |
|
Market Size Value in 2021 |
US$ 85.12 Bn |
|
Market Forecast Value in 2031 |
US$ 145.40 Bn |
|
Growth Rate (CAGR) |
5.50% |
|
Forecast Period |
2022–2031 |
|
Historical Data Available for |
2017–2021 |
|
Quantitative Units |
US$ Bn for Value & Thousand Units for Volume |
|
Market Analysis |
It includes cross segment analysis at global as well as regional level. Furthermore, qualitative analysis includes drivers, restraints, opportunities, key trends, Porter’s Five Forces analysis, value chain analysis, and key trend analysis. |
|
Competition Landscape |
|
|
Format |
Electronic (PDF) + Excel |
|
Market Segmentation |
|
|
Regions Covered |
|
|
Countries Covered |
|
|
Companies Profile |
|
|
Customization Scope |
Available upon request |
|
Pricing |
Available upon request |
The global farm tractor market was valued at US$ 85.12 Bn in 2021.
The global farm tractor market is expected to grow at a CAGR of 5.50% by 2031.
The global farm tractor market would be worth US$ 145.40 Bn in 2031.
Rapid adoption of mechanization in the agriculture industry, proactive government initiatives, and increase in number of medium-scale farmers are expected to drive the global farm tractor market during the forecast period.
The below 30 HP segment held 39.10% share of the global farm tractor market in 2021.
Asia Pacific is a highly lucrative region of the global farm tractor market.
Deere & Company, Mahindra Group, Kubota Corporation, Yanmar, Massey Ferguson, Farmtac, Dongfeng, Kioti Tractor, New Holland, SDF Group, Valtra Tractor, Argo Tractors S.p.A., CNH Industrial N.V., CLAAS Agricultural Machinery Private Limited., Eicher Motors Limited., Escorts Limited., Force Motors Limited, Mahindra & Mahindra Limited., International Tractors Limited (Sonalika), and TAFE Limited.
1. Executive Summary
1.1. Global Market Outlook
1.1.1. Market Value US$ Bn, 2017-2031
1.2. Competitive Dashboard Analysis
2. Market Overview
2.1. TMR Analysis and Recommendations
2.2. Market Coverage / Taxonomy
2.3. Market Definition / Scope / Limitations
2.4. Macro-Economic Factors
2.5. Market Dynamics
2.5.1. Drivers
2.5.2. Restraints
2.5.3. Opportunity
2.6. Market Factor Analysis
2.6.1. Porter’s Five Force Analysis
2.6.2. SWOT Analysis
2.7. Regulatory Scenario
2.8. Key Trend Analysis
3. Industry Ecosystem Analysis
3.1. Value Chain Analysis
3.2. Vendor Matrix
3.3. Gross Margin Analysis
4. Pricing Analysis
4.1. Cost Structure Analysis
4.2. Profit Margin Analysis
5. COVID-19 Impact Analysis – Farm Tractor Market
6. Global Farm Tractor Market, by Engine Power
6.1. Market Snapshot
6.1.1. Introduction, Definition, and Key Findings
6.1.2. Market Growth & Y-o-Y Projections
6.1.3. Base Point Share Analysis
6.2. Global Farm Tractor Market Size Analysis & Forecast, 2017-2031, by Engine Power
6.2.1. Below 30 HP
6.2.2. 30 HP - 100 HP
6.2.3. 100 HP - 200 HP
6.2.4. Above 200 HP
7. Global Farm Tractor Market, by Propulsion
7.1. Market Snapshot
7.1.1. Introduction, Definition, and Key Findings
7.1.2. Market Growth & Y-o-Y Projections
7.1.3. Base Point Share Analysis
7.2. Global Farm Tractor Market Size Analysis & Forecast, 2017-2031, by Propulsion
7.2.1. Internal Combustion Engine
7.2.1.1. Gasoline
7.2.1.2. Diesel
7.2.2. Electric
7.2.3. Others
8. Global Farm Tractor Market, by Drive Type
8.1. Market Snapshot
8.1.1. Introduction, Definition, and Key Findings
8.1.2. Market Growth & Y-o-Y Projections
8.1.3. Base Point Share Analysis
8.2. Global Farm Tractor Market Size Analysis & Forecast, 2017-2031, by Drive Type
8.2.1. 2WD
8.2.2. 4WD
9. Global Farm Tractor Market, by Level of Autonomy
9.1. Market Snapshot
9.1.1. Introduction, Definition, and Key Findings
9.1.2. Market Growth & Y-o-Y Projections
9.1.3. Base Point Share Analysis
9.2. Global Farm Tractor Market Size Analysis & Forecast, 2017-2031, by Level of Autonomy
9.2.1. Manual Tractors
9.2.2. Autonomous & Semi-Autonomous Tractors
10. Global Farm Tractor Market, by Application
10.1. Market Snapshot
10.1.1. Introduction, Definition, and Key Findings
10.1.2. Market Growth & Y-o-Y Projections
10.1.3. Base Point Share Analysis
10.2. Global Farm Tractor Market Size Analysis & Forecast, 2017-2031, by Application
10.2.1. Harvesting
10.2.2. Seed Sowing
10.2.3. Spraying
10.2.4. Others
11. Global Farm Tractor Market, by Region
11.1. Market Snapshot
11.1.1. Introduction, Definition, and Key Findings
11.1.2. Market Growth & Y-o-Y Projections
11.1.3. Base Point Share Analysis
11.2. Global Farm Tractor Market Size Analysis & Forecast, 2017-2031, by Region
11.2.1. North America
11.2.2. Europe
11.2.3. Asia Pacific
11.2.4. Middle East & Africa
11.2.5. South America
12. North America Farm Tractor Market
12.1. Market Snapshot
12.2. Farm Tractor Market Size Analysis & Forecast, 2017-2031, by Engine Power
12.2.1. Below 30 HP
12.2.2. 30 HP - 100 HP
12.2.3. 100 HP - 200 HP
12.2.4. Above 200 HP
12.3. Farm Tractor Market Size Analysis & Forecast, 2017-2031, by Propulsion
12.3.1. Internal Combustion Engine
12.3.1.1. Gasoline
12.3.1.2. Diesel
12.3.2. Electric
12.3.3. Others
12.4. Farm Tractor Market Size Analysis & Forecast, 2017-2031, by Drive Type
12.4.1. 2WD
12.4.2. 4WD
12.5. Farm Tractor Market Size Analysis & Forecast, 2017-2031, by Level of Autonomy
12.5.1. Manual Tractors
12.5.2. Autonomous & Semi-Autonomous Tractors
12.6. Farm Tractor Market Size Analysis & Forecast, 2017-2031, by Application
12.6.1. Harvesting
12.6.2. Seed Sowing
12.6.3. Spraying
12.6.4. Others
12.7. Key Country Analysis – North America Farm Tractor Market Size Analysis & Forecast, 2017-2031
12.7.1. U.S.
12.7.2. Canada
12.7.3. Mexico
13. Europe Farm Tractor Market
13.1. Market Snapshot
13.2. Farm Tractor Market Size Analysis & Forecast, 2017-2031, by Engine Power
13.2.1. Below 30 HP
13.2.2. 30 HP - 100 HP
13.2.3. 100 HP - 200 HP
13.2.4. Above 200 HP
13.3. Farm Tractor Market Size Analysis & Forecast, 2017-2031, by Propulsion
13.3.1. Internal Combustion Engine
13.3.1.1. Gasoline
13.3.1.2. Diesel
13.3.2. Electric
13.3.3. Others
13.4. Farm Tractor Market Size Analysis & Forecast, 2017-2031, by Drive Type
13.4.1. 2WD
13.4.2. 4WD
13.5. Farm Tractor Market Size Analysis & Forecast, 2017-2031, by Level of Autonomy
13.5.1. Manual Tractors
13.5.2. Autonomous & Semi-Autonomous Tractors
13.6. Farm Tractor Market Size Analysis & Forecast, 2017-2031, by Application
13.6.1. Harvesting
13.6.2. Seed Sowing
13.6.3. Spraying
13.6.4. Others
13.7. Key Country Analysis – Europe Farm Tractor Market Size Analysis & Forecast, 2017-2031
13.7.1. Germany
13.7.2. U. K.
13.7.3. France
13.7.4. Italy
13.7.5. Spain
13.7.6. Nordic Countries
13.7.7. Russia & CIS
13.7.8. Rest of Europe
14. Asia Pacific Farm Tractor Market
14.1. Market Snapshot
14.2. Farm Tractor Market Size Analysis & Forecast, 2017-2031, by Engine Power
14.2.1. Below 30 HP
14.2.2. 30 HP - 100 HP
14.2.3. 100 HP - 200 HP
14.2.4. Above 200 HP
14.3. Farm Tractor Market Size Analysis & Forecast, 2017-2031, by Propulsion
14.3.1. Internal Combustion Engine
14.3.1.1. Gasoline
14.3.1.2. Diesel
14.3.2. Electric
14.3.3. Others
14.4. Farm Tractor Market Size Analysis & Forecast, 2017-2031, by Drive Type
14.4.1. 2WD
14.4.2. 4WD
14.5. Farm Tractor Market Size Analysis & Forecast, 2017-2031, by Level of Autonomy
14.5.1. Manual Tractors
14.5.2. Autonomous & Semi-Autonomous Tractors
14.6. Farm Tractor Market Size Analysis & Forecast, 2017-2031, by Application
14.6.1. Harvesting
14.6.2. Seed Sowing
14.6.3. Spraying
14.6.4. Others
14.7. Key Country Analysis – Asia Pacific Farm Tractor Market Size Analysis & Forecast, 2017-2031
14.7.1. China
14.7.2. India
14.7.3. Japan
14.7.4. ASEAN Countries
14.7.5. South Korea
14.7.6. ANZ
14.7.7. Rest of Asia Pacific
15. Middle East & Africa Farm Tractor Market
15.1. Market Snapshot
15.2. Farm Tractor Market Size Analysis & Forecast, 2017-2031, by Engine Power
15.2.1. Below 30 HP
15.2.2. 30 HP - 100 HP
15.2.3. 100 HP - 200 HP
15.2.4. Above 200 HP
15.3. Farm Tractor Market Size Analysis & Forecast, 2017-2031, by Propulsion
15.3.1. Internal Combustion Engine
15.3.1.1. Gasoline
15.3.1.2. Diesel
15.3.2. Electric
15.3.3. Others
15.4. Farm Tractor Market Size Analysis & Forecast, 2017-2031, by Drive Type
15.4.1. 2WD
15.4.2. 4WD
15.5. Farm Tractor Market Size Analysis & Forecast, 2017-2031, by Level of Autonomy
15.5.1. Manual Tractors
15.5.2. Autonomous & Semi-Autonomous Tractors
15.6. Farm Tractor Market Size Analysis & Forecast, 2017-2031, by Application
15.6.1. Harvesting
15.6.2. Seed Sowing
15.6.3. Spraying
15.6.4. Others
15.7. Key Country Analysis – Middle East & Africa Farm Tractor Market Size Analysis & Forecast, 2017-2031
15.7.1. GCC
15.7.2. South Africa
15.7.3. Turkey
15.7.4. Rest of Middle East & Africa
16. South America Farm Tractor Market
16.1. Market Snapshot
16.2. Farm Tractor Market Size Analysis & Forecast, 2017-2031, by Engine Power
16.2.1. Below 30 HP
16.2.2. 30 HP - 100 HP
16.2.3. 100 HP - 200 HP
16.2.4. Above 200 HP
16.3. Farm Tractor Market Size Analysis & Forecast, 2017-2031, by Propulsion
16.3.1. Internal Combustion Engine
16.3.1.1. Gasoline
16.3.1.2. Diesel
16.3.2. Electric
16.3.3. Others
16.4. Farm Tractor Market Size Analysis & Forecast, 2017-2031, by Drive Type
16.4.1. 2WD
16.4.2. 4WD
16.5. Farm Tractor Market Size Analysis & Forecast, 2017-2031, by Level of Autonomy
16.5.1. Manual Tractors
16.5.2. Autonomous & Semi-Autonomous Tractors
16.6. Farm Tractor Market Size Analysis & Forecast, 2017-2031, by Application
16.6.1. Harvesting
16.6.2. Seed Sowing
16.6.3. Spraying
16.6.4. Others
16.7. Key Country Analysis – South America Farm Tractor Market Size Analysis & Forecast, 2017-2031
16.7.1. Brazil
16.7.2. Argentina
16.7.3. Rest of South America
17. Competitive Landscape
17.1. Company Share Analysis/ Brand Share Analysis, 2021
17.2. Pricing comparison among key players
17.3. Company Analysis for each player (Company Overview, Company Footprints, Production Locations, Product Portfolio, Competitors & Customers, Subsidiaries & Parent Organization, Recent Developments, Financial Analysis, Profitability, Revenue Share)
18. Company Profile/ Key Players
18.1. Deere & Company
18.1.1. Company Overview
18.1.2. Company Footprints
18.1.3. Production Locations
18.1.4. Product Portfolio
18.1.5. Competitors & Customers
18.1.6. Subsidiaries & Parent Organization
18.1.7. Recent Developments
18.1.8. Financial Analysis
18.1.9. Profitability
18.1.10. Revenue Share
18.2. Mahindra Group
18.2.1. Company Overview
18.2.2. Company Footprints
18.2.3. Production Locations
18.2.4. Product Portfolio
18.2.5. Competitors & Customers
18.2.6. Subsidiaries & Parent Organization
18.2.7. Recent Developments
18.2.8. Financial Analysis
18.2.9. Profitability
18.2.10. Revenue Share
18.3. Kubota Corporation
18.3.1. Company Overview
18.3.2. Company Footprints
18.3.3. Production Locations
18.3.4. Product Portfolio
18.3.5. Competitors & Customers
18.3.6. Subsidiaries & Parent Organization
18.3.7. Recent Developments
18.3.8. Financial Analysis
18.3.9. Profitability
18.3.10. Revenue Share
18.4. Yanmar
18.4.1. Company Overview
18.4.2. Company Footprints
18.4.3. Production Locations
18.4.4. Product Portfolio
18.4.5. Competitors & Customers
18.4.6. Subsidiaries & Parent Organization
18.4.7. Recent Developments
18.4.8. Financial Analysis
18.4.9. Profitability
18.4.10. Revenue Share
18.5. Massey Ferguson
18.5.1. Company Overview
18.5.2. Company Footprints
18.5.3. Production Locations
18.5.4. Product Portfolio
18.5.5. Competitors & Customers
18.5.6. Subsidiaries & Parent Organization
18.5.7. Recent Developments
18.5.8. Financial Analysis
18.5.9. Profitability
18.5.10. Revenue Share
18.6. Farmtac
18.6.1. Company Overview
18.6.2. Company Footprints
18.6.3. Production Locations
18.6.4. Product Portfolio
18.6.5. Competitors & Customers
18.6.6. Subsidiaries & Parent Organization
18.6.7. Recent Developments
18.6.8. Financial Analysis
18.6.9. Profitability
18.6.10. Revenue Share
18.7. Dongfeng
18.7.1. Company Overview
18.7.2. Company Footprints
18.7.3. Production Locations
18.7.4. Product Portfolio
18.7.5. Competitors & Customers
18.7.6. Subsidiaries & Parent Organization
18.7.7. Recent Developments
18.7.8. Financial Analysis
18.7.9. Profitability
18.7.10. Revenue Share
18.8. Kioti Tractor
18.8.1. Company Overview
18.8.2. Company Footprints
18.8.3. Production Locations
18.8.4. Product Portfolio
18.8.5. Competitors & Customers
18.8.6. Subsidiaries & Parent Organization
18.8.7. Recent Developments
18.8.8. Financial Analysis
18.8.9. Profitability
18.8.10. Revenue Share
18.9. New Holland
18.9.1. Company Overview
18.9.2. Company Footprints
18.9.3. Production Locations
18.9.4. Product Portfolio
18.9.5. Competitors & Customers
18.9.6. Subsidiaries & Parent Organization
18.9.7. Recent Developments
18.9.8. Financial Analysis
18.9.9. Profitability
18.9.10. Revenue Share
18.10. SDF Group
18.10.1. Company Overview
18.10.2. Company Footprints
18.10.3. Production Locations
18.10.4. Product Portfolio
18.10.5. Competitors & Customers
18.10.6. Subsidiaries & Parent Organization
18.10.7. Recent Developments
18.10.8. Financial Analysis
18.10.9. Profitability
18.10.10. Revenue Share
18.11. Valtra Tractor
18.11.1. Company Overview
18.11.2. Company Footprints
18.11.3. Production Locations
18.11.4. Product Portfolio
18.11.5. Competitors & Customers
18.11.6. Subsidiaries & Parent Organization
18.11.7. Recent Developments
18.11.8. Financial Analysis
18.11.9. Profitability
18.11.10. Revenue Share
18.12. Argo Tractors S.p.A.
18.12.1. Company Overview
18.12.2. Company Footprints
18.12.3. Production Locations
18.12.4. Product Portfolio
18.12.5. Competitors & Customers
18.12.6. Subsidiaries & Parent Organization
18.12.7. Recent Developments
18.12.8. Financial Analysis
18.12.9. Profitability
18.12.10. Revenue Share
18.13. CNH Industrial N.V.
18.13.1. Company Overview
18.13.2. Company Footprints
18.13.3. Production Locations
18.13.4. Product Portfolio
18.13.5. Competitors & Customers
18.13.6. Subsidiaries & Parent Organization
18.13.7. Recent Developments
18.13.8. Financial Analysis
18.13.9. Profitability
18.13.10. Revenue Share
18.14. CLAAS Agricultural Machinery Private Limited.
18.14.1. Company Overview
18.14.2. Company Footprints
18.14.3. Production Locations
18.14.4. Product Portfolio
18.14.5. Competitors & Customers
18.14.6. Subsidiaries & Parent Organization
18.14.7. Recent Developments
18.14.8. Financial Analysis
18.14.9. Profitability
18.14.10. Revenue Share
18.15. Either Motors Limited.
18.15.1. Company Overview
18.15.2. Company Footprints
18.15.3. Production Locations
18.15.4. Product Portfolio
18.15.5. Competitors & Customers
18.15.6. Subsidiaries & Parent Organization
18.15.7. Recent Developments
18.15.8. Financial Analysis
18.15.9. Profitability
18.15.10. Revenue Share
18.16. Escorts Limited.
18.16.1. Company Overview
18.16.2. Company Footprints
18.16.3. Production Locations
18.16.4. Product Portfolio
18.16.5. Competitors & Customers
18.16.6. Subsidiaries & Parent Organization
18.16.7. Recent Developments
18.16.8. Financial Analysis
18.16.9. Profitability
18.16.10. Revenue Share
18.17. Force Motors Limited
18.17.1. Company Overview
18.17.2. Company Footprints
18.17.3. Production Locations
18.17.4. Product Portfolio
18.17.5. Competitors & Customers
18.17.6. Subsidiaries & Parent Organization
18.17.7. Recent Developments
18.17.8. Financial Analysis
18.17.9. Profitability
18.17.10. Revenue Share
18.18. Mahindra & Mahindra Limited.
18.18.1. Company Overview
18.18.2. Company Footprints
18.18.3. Production Locations
18.18.4. Product Portfolio
18.18.5. Competitors & Customers
18.18.6. Subsidiaries & Parent Organization
18.18.7. Recent Developments
18.18.8. Financial Analysis
18.18.9. Profitability
18.18.10. Revenue Share
18.19. International Tractors Limited. (Sonalika)
18.19.1. Company Overview
18.19.2. Company Footprints
18.19.3. Production Locations
18.19.4. Product Portfolio
18.19.5. Competitors & Customers
18.19.6. Subsidiaries & Parent Organization
18.19.7. Recent Developments
18.19.8. Financial Analysis
18.19.9. Profitability
18.19.10. Revenue Share
18.20. TAFE Limited.
18.20.1. Company Overview
18.20.2. Company Footprints
18.20.3. Production Locations
18.20.4. Product Portfolio
18.20.5. Competitors & Customers
18.20.6. Subsidiaries & Parent Organization
18.20.7. Recent Developments
18.20.8. Financial Analysis
18.20.9. Profitability
18.20.10. Revenue Share
18.21. Other Key Players
18..21.1. Company Overview
18.21.2. Company Footprints
18.21.3. Production Locations
18.21.4. Product Portfolio
18.21.5. Competitors & Customers
18.21.6. Subsidiaries & Parent Organization
18.21.7. Recent Developments
18.21.8. Financial Analysis
18.21.9. Profitability
18.21.10. Revenue Share
List of Tables
Table 1: Global Farm Tractor Market Volume (Thousand Units) Forecast, by Engine Power, 2017-2031
Table 2: Global Farm Tractor Market Value (US$ Bn) Forecast, by Engine Power, 2017‒2031
Table 3: Global Farm Tractor Market Volume (Thousand Units) Forecast, by Propulsion, 2017-2031
Table 4: Global Farm Tractor Market Value (US$ Bn) Forecast, by Propulsion, 2017‒2031
Table 5: Global Farm Tractor Market Volume (Thousand Units) Forecast, by Drive Type, 2017-2031
Table 6: Global Farm Tractor Market Value (US$ Bn) Forecast, by Drive Type, 2017‒2031
Table 7: Global Farm Tractor Market Volume (Thousand Units) Forecast, by Level of Autonomy, 2017-2031
Table 8: Global Farm Tractor Market Value (US$ Bn) Forecast, by Level of Autonomy, 2017‒2031
Table 9: Global Farm Tractor Market Volume (Thousand Units) Forecast, by Application, 2017-2031
Table 10: Global Farm Tractor Market Value (US$ Bn) Forecast, by Application, 2017‒2031
Table 11: Global Farm Tractor Market Volume (Thousand Units) Forecast, by Region, 2017-2031
Table 12: Global Farm Tractor Market Value (US$ Bn) Forecast, by Region, 2017‒2031
Table 13: North America Farm Tractor Market Volume (Thousand Units) Forecast, by Engine Power, 2017-2031
Table 14: North America Farm Tractor Market Value (US$ Bn) Forecast, by Engine Power, 2017‒2031
Table 15: North America Farm Tractor Market Volume (Thousand Units) Forecast, by Propulsion, 2017-2031
Table 16: North America Farm Tractor Market Value (US$ Bn) Forecast, by Propulsion, 2017‒2031
Table 17: North America Farm Tractor Market Volume (Thousand Units) Forecast, by Drive Type, 2017-2031
Table 18: North America Farm Tractor Market Value (US$ Bn) Forecast, by Drive Type, 2017‒2031
Table 19: North America Farm Tractor Market Volume (Thousand Units) Forecast, by Level of Autonomy, 2017-2031
Table 20: North America Farm Tractor Market Value (US$ Bn) Forecast, by Level of Autonomy, 2017‒2031
Table 21: North America Farm Tractor Market Volume (Thousand Units) Forecast, by Application, 2017-2031
Table 22: North America Farm Tractor Market Value (US$ Bn) Forecast, by Application, 2017‒2031
Table 23: North America Farm Tractor Market Volume (Thousand Units) Forecast, by Country, 2017-2031
Table 24: North America Farm Tractor Market Value (US$ Bn) Forecast, by Country, 2017‒2031
Table 25: Europe Farm Tractor Market Volume (Thousand Units) Forecast, by Engine Power, 2017-2031
Table 26: Europe Farm Tractor Market Value (US$ Bn) Forecast, by Engine Power, 2017‒2031
Table 27: Europe Farm Tractor Market Volume (Thousand Units) Forecast, by Propulsion, 2017-2031
Table 28: Europe Farm Tractor Market Value (US$ Bn) Forecast, by Propulsion, 2017‒2031
Table 29: Europe Farm Tractor Market Volume (Thousand Units) Forecast, by Drive Type, 2017-2031
Table 30: Europe Farm Tractor Market Value (US$ Bn) Forecast, by Drive Type, 2017‒2031
Table 31: Europe Farm Tractor Market Volume (Thousand Units) Forecast, by Level of Autonomy, 2017-2031
Table 32: Europe Farm Tractor Market Value (US$ Bn) Forecast, by Level of Autonomy, 2017‒2031
Table 33: Europe Farm Tractor Market Volume (Thousand Units) Forecast, by Application, 2017-2031
Table 34: Europe Farm Tractor Market Value (US$ Bn) Forecast, by Application, 2017‒2031
Table 35: Europe Farm Tractor Market Volume (Thousand Units) Forecast, by Country and Sub-region, 2017-2031
Table 36: Europe Farm Tractor Market Value (US$ Bn) Forecast, by Country and Sub-region, 2017‒2031
Table 37: Asia Pacific Farm Tractor Market Volume (Thousand Units) Forecast, by Engine Power, 2017-2031
Table 38: Asia Pacific Farm Tractor Market Value (US$ Bn) Forecast, by Engine Power, 2017‒2031
Table 39: Asia Pacific Farm Tractor Market Volume (Thousand Units) Forecast, by Propulsion, 2017-2031
Table 40: Asia Pacific Farm Tractor Market Value (US$ Bn) Forecast, by Propulsion, 2017‒2031
Table 41: Asia Pacific Farm Tractor Market Volume (Thousand Units) Forecast, by Drive Type, 2017-2031
Table 42: Asia Pacific Farm Tractor Market Value (US$ Bn) Forecast, by Drive Type, 2017‒2031
Table 43: Asia Pacific Farm Tractor Market Volume (Thousand Units) Forecast, by Level of Autonomy, 2017-2031
Table 44: Asia Pacific Farm Tractor Market Value (US$ Bn) Forecast, by Level of Autonomy, 2017‒2031
Table 45: Asia Pacific Farm Tractor Market Volume (Thousand Units) Forecast, by Application, 2017-2031
Table 46: Asia Pacific Farm Tractor Market Value (US$ Bn) Forecast, by Application, 2017‒2031
Table 47: Asia Pacific Farm Tractor Market Volume (Thousand Units) Forecast, by Country and Sub-region, 2017-2031
Table 48: Asia Pacific Farm Tractor Market Value (US$ Bn) Forecast, by Country and Sub-region, 2017‒2031
Table 49: Middle East & Africa Farm Tractor Market Volume (Thousand Units) Forecast, by Engine Power, 2017-2031
Table 50: Middle East & Africa Farm Tractor Market Value (US$ Bn) Forecast, by Engine Power, 2017‒2031
Table 51: Middle East & Africa Farm Tractor Market Volume (Thousand Units) Forecast, by Propulsion, 2017-2031
Table 52: Middle East & Africa Farm Tractor Market Value (US$ Bn) Forecast, by Propulsion, 2017‒2031
Table 53: Middle East & Africa Farm Tractor Market Volume (Thousand Units) Forecast, by Drive Type, 2017-2031
Table 54: Middle East & Africa Farm Tractor Market Value (US$ Bn) Forecast, by Drive Type, 2017‒2031
Table 55: Middle East & Africa Farm Tractor Market Volume (Thousand Units) Forecast, by Level of Autonomy, 2017-2031
Table 56: Middle East & Africa Farm Tractor Market Value (US$ Bn) Forecast, by Level of Autonomy, 2017‒2031
Table 57: Middle East & Africa Farm Tractor Market Volume (Thousand Units) Forecast, by Application, 2017-2031
Table 58: Middle East & Africa Farm Tractor Market Value (US$ Bn) Forecast, by Application, 2017‒2031
Table 59: Middle East & Africa Farm Tractor Market Volume (Thousand Units) Forecast, by Country and Sub-region, 2017-2031
Table 60: Middle East & Africa Farm Tractor Market Value (US$ Bn) Forecast, by Country and Sub-region, 2017‒2031
Table 61: South America Farm Tractor Market Volume (Thousand Units) Forecast, by Engine Power, 2017-2031
Table 62: South America Farm Tractor Market Value (US$ Bn) Forecast, by Engine Power, 2017‒2031
Table 63: South America Farm Tractor Market Volume (Thousand Units) Forecast, by Propulsion, 2017-2031
Table 64: South America Farm Tractor Market Value (US$ Bn) Forecast, by Propulsion, 2017‒2031
Table 65: South America Farm Tractor Market Volume (Thousand Units) Forecast, by Drive Type, 2017-2031
Table 66: South America Farm Tractor Market Value (US$ Bn) Forecast, by Drive Type, 2017‒2031
Table 67: South America Farm Tractor Market Volume (Thousand Units) Forecast, by Level of Autonomy, 2017-2031
Table 68: South America Farm Tractor Market Value (US$ Bn) Forecast, by Level of Autonomy, 2017‒2031
Table 69: South America Farm Tractor Market Volume (Thousand Units) Forecast, by Application, 2017-2031
Table 70: South America Farm Tractor Market Value (US$ Bn) Forecast, by Application, 2017‒2031
Table 71: South America Farm Tractor Market Volume (Thousand Units) Forecast, by Country and Sub-region, 2017-2031
Table 72: South America Farm Tractor Market Value (US$ Bn) Forecast, by Country and Sub-region, 2017‒2031
List of Figures
Figure 1: Global Farm Tractor Market Volume (Thousand Units) Forecast, by Engine Power, 2017-2031
Figure 2: Global Farm Tractor Market Value (US$ Bn) Forecast, by Engine Power, 2017-2031
Figure 3: Global Farm Tractor Market, Incremental Opportunity, by Engine Power, Value (US$ Bn), 2022-2031
Figure 4: Global Farm Tractor Market Volume (Thousand Units) Forecast, by Propulsion, 2017-2031
Figure 5: Global Farm Tractor Market Value (US$ Bn) Forecast, by Propulsion, 2017-2031
Figure 6: Global Farm Tractor Market, Incremental Opportunity, by Propulsion, Value (US$ Bn), 2022-2031
Figure 7: Global Farm Tractor Market Volume (Thousand Units) Forecast, by Drive Type, 2017-2031
Figure 8: Global Farm Tractor Market Value (US$ Bn) Forecast, by Drive Type, 2017-2031
Figure 9: Global Farm Tractor Market, Incremental Opportunity, by Drive Type, Value (US$ Bn), 2022-2031
Figure 10: Global Farm Tractor Market Volume (Thousand Units) Forecast, by Level of Autonomy, 2017-2031
Figure 11: Global Farm Tractor Market Value (US$ Bn) Forecast, by Level of Autonomy, 2017-2031
Figure 12: Global Farm Tractor Market, Incremental Opportunity, by Level of Autonomy, Value (US$ Bn), 2022-2031
Figure 13: Global Farm Tractor Market Volume (Thousand Units) Forecast, by Application, 2017-2031
Figure 14: Global Farm Tractor Market Value (US$ Bn) Forecast, by Application, 2017-2031
Figure 15: Global Farm Tractor Market, Incremental Opportunity, by Application, Value (US$ Bn), 2022-2031
Figure 16: Global Farm Tractor Market Volume (Thousand Units) Forecast, by Region, 2017-2031
Figure 17: Global Farm Tractor Market Value (US$ Bn) Forecast, by Region, 2017-2031
Figure 18: Global Farm Tractor Market, Incremental Opportunity, by Region, Value (US$ Bn), 2022-2031
Figure 19: North America Farm Tractor Market Volume (Thousand Units) Forecast, by Engine Power, 2017-2031
Figure 20: North America Farm Tractor Market Value (US$ Bn) Forecast, by Engine Power, 2017-2031
Figure 21: North America Farm Tractor Market, Incremental Opportunity, by Engine Power, Value (US$ Bn), 2022-2031
Figure 22: North America Farm Tractor Market Volume (Thousand Units) Forecast, by Propulsion, 2017-2031
Figure 23: North America Farm Tractor Market Value (US$ Bn) Forecast, by Propulsion, 2017-2031
Figure 24: North America Farm Tractor Market, Incremental Opportunity, by Propulsion, Value (US$ Bn), 2022-2031
Figure 25: North America Farm Tractor Market Volume (Thousand Units) Forecast, by Drive Type, 2017-2031
Figure 26: North America Farm Tractor Market Value (US$ Bn) Forecast, by Drive Type, 2017-2031
Figure 27: North America Farm Tractor Market, Incremental Opportunity, by Drive Type, Value (US$ Bn), 2022-2031
Figure 28: North America Farm Tractor Market Volume (Thousand Units) Forecast, by Level of Autonomy, 2017-2031
Figure 29: North America Farm Tractor Market Value (US$ Bn) Forecast, by Level of Autonomy, 2017-2031
Figure 30: North America Farm Tractor Market, Incremental Opportunity, by Level of Autonomy, Value (US$ Bn), 2022-2031
Figure 31: North America Farm Tractor Market Volume (Thousand Units) Forecast, by Application, 2017-2031
Figure 32: North America Farm Tractor Market Value (US$ Bn) Forecast, by Application, 2017-2031
Figure 33: North America Farm Tractor Market, Incremental Opportunity, by Application, Value (US$ Bn), 2022-2031
Figure 34: North America Farm Tractor Market Volume (Thousand Units) Forecast, by Country, 2017-2031
Figure 35: North America Farm Tractor Market Value (US$ Bn) Forecast, by Country, 2017-2031
Figure 36: North America Farm Tractor Market, Incremental Opportunity, by Country, Value (US$ Bn), 2022-2031
Figure 37: Europe Farm Tractor Market Volume (Thousand Units) Forecast, by Engine Power, 2017-2031
Figure 38: Europe Farm Tractor Market Value (US$ Bn) Forecast, by Engine Power, 2017-2031
Figure 39: Europe Farm Tractor Market, Incremental Opportunity, by Engine Power, Value (US$ Bn), 2022-2031
Figure 40: Europe Farm Tractor Market Volume (Thousand Units) Forecast, by Propulsion, 2017-2031
Figure 41: Europe Farm Tractor Market Value (US$ Bn) Forecast, by Propulsion, 2017-2031
Figure 42: Europe Farm Tractor Market, Incremental Opportunity, by Propulsion, Value (US$ Bn), 2022-2031
Figure 43: Europe Farm Tractor Market Volume (Thousand Units) Forecast, by Drive Type, 2017-2031
Figure 44: Europe Farm Tractor Market Value (US$ Bn) Forecast, by Drive Type, 2017-2031
Figure 45: Europe Farm Tractor Market, Incremental Opportunity, by Drive Type, Value (US$ Bn), 2022-2031
Figure 46: Europe Farm Tractor Market Volume (Thousand Units) Forecast, by Level of Autonomy, 2017-2031
Figure 47: Europe Farm Tractor Market Value (US$ Bn) Forecast, by Level of Autonomy, 2017-2031
Figure 48: Europe Farm Tractor Market, Incremental Opportunity, by Level of Autonomy, Value (US$ Bn), 2022-2031
Figure 49: Europe Farm Tractor Market Volume (Thousand Units) Forecast, by Application, 2017-2031
Figure 50: Europe Farm Tractor Market Value (US$ Bn) Forecast, by Application, 2017-2031
Figure 51: Europe Farm Tractor Market, Incremental Opportunity, by Application, Value (US$ Bn), 2022-2031
Figure 52: Europe Farm Tractor Market Volume (Thousand Units) Forecast, by Country and Sub-region, 2017-2031
Figure 53: Europe Farm Tractor Market Value (US$ Bn) Forecast, by Country and Sub-region, 2017-2031
Figure 54: Europe Farm Tractor Market, Incremental Opportunity, by Country and Sub-region, Value (US$ Bn), 2022-2031
Figure 55: Asia Pacific Farm Tractor Market Volume (Thousand Units) Forecast, by Engine Power, 2017-2031
Figure 56: Asia Pacific Farm Tractor Market Value (US$ Bn) Forecast, by Engine Power, 2017-2031
Figure 57: Asia Pacific Farm Tractor Market, Incremental Opportunity, by Engine Power, Value (US$ Bn), 2022-2031
Figure 58: Asia Pacific Farm Tractor Market Volume (Thousand Units) Forecast, by Propulsion, 2017-2031
Figure 59: Asia Pacific Farm Tractor Market Value (US$ Bn) Forecast, by Propulsion, 2017-2031
Figure 60: Asia Pacific Farm Tractor Market, Incremental Opportunity, by Propulsion, Value (US$ Bn), 2022-2031
Figure 61: Asia Pacific Farm Tractor Market Volume (Thousand Units) Forecast, by Drive Type, 2017-2031
Figure 62: Asia Pacific Farm Tractor Market Value (US$ Bn) Forecast, by Drive Type, 2017-2031
Figure 63: Asia Pacific Farm Tractor Market, Incremental Opportunity, by Drive Type, Value (US$ Bn), 2022-2031
Figure 64: Asia Pacific Farm Tractor Market Volume (Thousand Units) Forecast, by Level of Autonomy, 2017-2031
Figure 65: Asia Pacific Farm Tractor Market Value (US$ Bn) Forecast, by Level of Autonomy, 2017-2031
Figure 66: Asia Pacific Farm Tractor Market, Incremental Opportunity, by Level of Autonomy, Value (US$ Bn), 2022-2031
Figure 67: Asia Pacific Farm Tractor Market Volume (Thousand Units) Forecast, by Application, 2017-2031
Figure 68: Asia Pacific Farm Tractor Market Value (US$ Bn) Forecast, by Application, 2017-2031
Figure 69: Asia Pacific Farm Tractor Market, Incremental Opportunity, by Application, Value (US$ Bn), 2022-2031
Figure 70: Asia Pacific Farm Tractor Market Volume (Thousand Units) Forecast, by Country and Sub-region, 2017-2031
Figure 71: Asia Pacific Farm Tractor Market Value (US$ Bn) Forecast, by Country and Sub-region, 2017-2031
Figure 72: Asia Pacific Farm Tractor Market, Incremental Opportunity, by Country and Sub-region, Value (US$ Bn), 2022-2031
Figure 73: Middle East & Africa Farm Tractor Market Volume (Thousand Units) Forecast, by Engine Power, 2017-2031
Figure 74: Middle East & Africa Farm Tractor Market Value (US$ Bn) Forecast, by Engine Power, 2017-2031
Figure 75: Middle East & Africa Farm Tractor Market, Incremental Opportunity, by Engine Power, Value (US$ Bn), 2022-2031
Figure 76: Middle East & Africa Farm Tractor Market Volume (Thousand Units) Forecast, by Propulsion, 2017-2031
Figure 77: Middle East & Africa Farm Tractor Market Value (US$ Bn) Forecast, by Propulsion, 2017-2031
Figure 78: Middle East & Africa Farm Tractor Market, Incremental Opportunity, by Propulsion, Value (US$ Bn), 2022-2031
Figure 79: Middle East & Africa Farm Tractor Market Volume (Thousand Units) Forecast, by Drive Type, 2017-2031
Figure 80: Middle East & Africa Farm Tractor Market Value (US$ Bn) Forecast, by Drive Type, 2017-2031
Figure 81: Middle East & Africa Farm Tractor Market, Incremental Opportunity, by Drive Type, Value (US$ Bn), 2022-2031
Figure 82: Middle East & Africa Farm Tractor Market Volume (Thousand Units) Forecast, by Level of Autonomy, 2017-2031
Figure 83: Middle East & Africa Farm Tractor Market Value (US$ Bn) Forecast, by Level of Autonomy, 2017-2031
Figure 84: Middle East & Africa Farm Tractor Market, Incremental Opportunity, by Level of Autonomy, Value (US$ Bn), 2022-2031
Figure 85: Middle East & Africa Farm Tractor Market Volume (Thousand Units) Forecast, by Application, 2017-2031
Figure 86: Middle East & Africa Farm Tractor Market Value (US$ Bn) Forecast, by Application, 2017-2031
Figure 87: Middle East & Africa Farm Tractor Market, Incremental Opportunity, by Application, Value (US$ Bn), 2022-2031
Figure 88: Middle East & Africa Farm Tractor Market Volume (Thousand Units) Forecast, by Country and Sub-region, 2017-2031
Figure 89: Middle East & Africa Farm Tractor Market Value (US$ Bn) Forecast, by Country and Sub-region, 2017-2031
Figure 90: Middle East & Africa Farm Tractor Market, Incremental Opportunity, by Country and Sub-region, Value (US$ Bn), 2022-2031
Figure 91: South America Farm Tractor Market Volume (Thousand Units) Forecast, by Engine Power, 2017-2031
Figure 92: South America Farm Tractor Market Value (US$ Bn) Forecast, by Engine Power, 2017-2031
Figure 93: South America Farm Tractor Market, Incremental Opportunity, by Engine Power, Value (US$ Bn), 2022-2031
Figure 94: South America Farm Tractor Market Volume (Thousand Units) Forecast, by Propulsion, 2017-2031
Figure 95: South America Farm Tractor Market Value (US$ Bn) Forecast, by Propulsion, 2017-2031
Figure 96: South America Farm Tractor Market, Incremental Opportunity, by Propulsion, Value (US$ Bn), 2022-2031
Figure 97: South America Farm Tractor Market Volume (Thousand Units) Forecast, by Drive Type, 2017-2031
Figure 98: South America Farm Tractor Market Value (US$ Bn) Forecast, by Drive Type, 2017-2031
Figure 99: South America Farm Tractor Market, Incremental Opportunity, by Drive Type, Value (US$ Bn), 2022-2031
Figure 100: South America Farm Tractor Market Volume (Thousand Units) Forecast, by Level of Autonomy, 2017-2031
Figure 101: South America Farm Tractor Market Value (US$ Bn) Forecast, by Level of Autonomy, 2017-2031
Figure 102: South America Farm Tractor Market, Incremental Opportunity, by Level of Autonomy, Value (US$ Bn), 2022-2031
Figure 103: South America Farm Tractor Market Volume (Thousand Units) Forecast, by Application, 2017-2031
Figure 104: South America Farm Tractor Market Value (US$ Bn) Forecast, by Application, 2017-2031
Figure 105: South America Farm Tractor Market, Incremental Opportunity, by Application, Value (US$ Bn), 2022-2031
Figure 106: South America Farm Tractor Market Volume (Thousand Units) Forecast, by Country and Sub-region, 2017-2031
Figure 107: South America Farm Tractor Market Value (US$ Bn) Forecast, by Country and Sub-region, 2017-2031
Figure 108: South America Farm Tractor Market, Incremental Opportunity, by Country and Sub-region, Value (US$ Bn), 2022-2031
Copyright © Transparency Market Research, Inc. All Rights reserved
Trust Online

Farm Tractor Market