

Reports
Reports
The global value of the After-Sun Products Market stood at USD 2,541 Million in 2025 and is anticipated to reach USD 3,988.1 Million by 2036 with a CAGR growth rate of 4.7%. After-sun products include skincare products having soothing, hydrating, and healing effects on the skin after being exposed to excessive sunlight and UV radiation. The industry includes products available in different forms such as lotion, gel, cream, spray, and balm. The after-sun products consist of ingredients like aloevera, antioxidants, vitamins, and moisturizers.
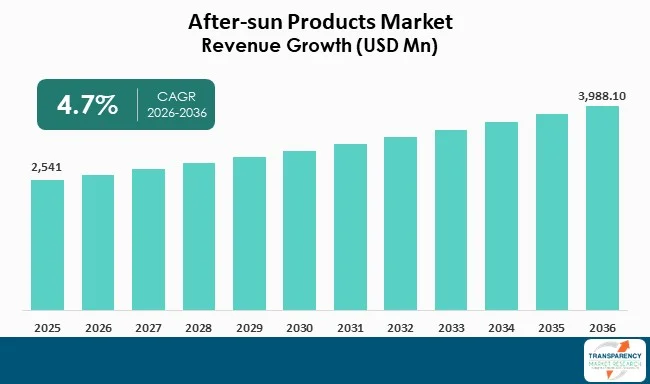
After-Sun Products Market is expected to witness moderate growth during the forecast period as consumers are now well aware of their skin type and the impact of ultraviolet rays on their skin. The increase in the consumer population that indulges themselves in outdoor activities such as vacationing on the beach, traveling, and exercising has caused the increased demand for beauty products that provide soothing, moisturizing, and revitalizing effects on their skin as a result of sun exposure. Awareness among consumers regarding issues such as sunburns, early aging of the skin, skin discoloration, and dehydrated skin has caused the demand for after-sun care products.
It should be noted that according to experts, innovation and changes in consumers’ preferences present tremendous opportunities for growth in this field. Companies manufacturing skincare products have begun to pay attention to the development of new skincare products that include aloe vera, chamomile, cucumber extracts, antioxidants, and vitamins in order to heal skin. Apart from this, it has become evident that consumers demand skincare products whose packaging indicates the fact that the ingredients used in the production are organic in addition to dermatological tests being performed and vegan-friendly products being produced. An important trend that can be mentioned is that of increased sales of skincare products through online channels.
The After-Sun Products Market is made up of skin care products which are designed to give relief, hydrate the skin, and rejuvenate the skin after being exposed to the sun. These skin care products comprise lotions, gels, creams, sprays, balms, and other skin care products that contain active components including aloe vera, antioxidants, vitamins, and plant extracts which can effectively be used to address various skin problems such as dryness, sun damage, and irritation, among others. Consumer awareness regarding skin care practices, participation in outdoor activities and tourism, and demand for premium and natural skin care products are some of the key drivers for this market.
| Attribute | Detail |
|---|---|
| After-sun Products Market Drivers |
|
An increase in exposure to the UV rays as well as sunburns is yet another important factor that contributes significantly to the growth of the After-sun Products Market. The increased exposure of individuals to the UV rays occurs due to engaging themselves in outdoor recreational activities such as traveling, engaging in sports activities, and even in everyday activities. Overexposure of oneself to the sun causes issues like irritation, redness, dryness, inflammation, and sunburn on the skin. Due to this, the need for skin products to heal oneself after overexposure to the sun is rising. Skin products such as after-sun lotions, gels, sprays, creams, and balm are known to help soothe the skin; hence, they become very essential skin care products post-sun exposure.
According to CDC in 2026, exposure to UV light causes damage to skin cells; therefore, there is a need for protection against ultraviolet light at all seasons and not only during the summertime. The CDC further mentions that ultraviolet light goes through clouds and even bounces back from items such as water, sand, snow, and concrete. This makes an individual vulnerable to the harmful rays in different locations. Statistics show that ultraviolet light reaches many areas and therefore requires products which reduce skin irritations and dry skin caused by exposure to the sun.
In the 2026 Morbidity and Mortality Weekly Report (MMWR) by the CDC, sunburn has been listed as a risk factor for skin cancer, with an analysis of national survey data helping determine its frequency. Consumers will seek more after-sun products to keep their skin hydrated, cooled, and recovered from the effects of exposure to sunlight due to growing awareness of the risks of UV damage, offering new growth potential for the After-sun Products Market.
The other factors that have contributed to the growth of the After-Sun Products Market are greater engagement in outdoor pursuits by consumers. There has been an upward trend witnessed by more participation in activities like trekking, camping, bicycling, beach trips, boating, fishing, sports, and adventurous travel. People engaging in such outdoor activities will be exposed to the sun and elements leading to dehydration of the skin, causing irritation, redness, and discomfort due to exposure to UV radiation, heat, winds, and salinity of water. It is for this reason that there has been the adoption by consumers of after-sun products like after-sun creams, gels, sprays, and moisturizers into their skin care regimen.
There is an ongoing trend toward increasing outdoor recreation activities. This leads to a wide consumer market for both sunscreen products and after-sun treatments. The United States Bureau of Economic Analysis (BEA) states that in 2024, the contribution of the outdoor recreation industry to U.S. GDP was 2.4%, equal to USD 696.7 billion. The Bureau also indicates that about 5.2 million people are employed in the industry, thus accounting for 3.2% of all American jobs. This means that there are many people who engage in outdoor activities and are exposed to sun rays for prolonged periods of time.
Apart from recreationally inclined individuals, there are workers in the outdoor industry too. In 2026, it was highlighted by the CDC’s National Institute for Occupational Safety and Health (NIOSH) that outdoor work could elevate risks of getting sunburned and damaging the skin owing to UV exposure. With repetitive exposure to such conditions, the condition of one’s skin might get impaired and necessitate skincare solutions. Therefore, in addition to outdoor recreationists and travelers, construction workers, farmers, landscapers, and other professions are likely to contribute to the market demand for after-sun products.
| Attribute | Detail |
|---|---|
| After-sun Products Market Opportunity |
|
The skincare requirements of outdoor workers will create a great chance for businesses within the After-Sun Products Market. People involved in agriculture, construction, gardening, transportation, utility work, fishing, and government services spend prolonged periods outside. This makes outdoor workers regular consumers of after-sun care products as opposed to seasonal holiday makers. The frequent exposure to sunlight, heat, wind, dust, and dry conditions calls for after-sun products that soothe, hydrate and cool the skin.
As per the guidance document on sun exposure at work issued by CDC/NIOSH for 2026, the sun is strongest in summer season and from 10:00 AM to 4:00 PM. Work performed outdoors during this period increases the likelihood of sunburning. CDC/NIOSH adds that UV radiation exposure risk is present on cloudy days, but UV rays are reflected from snow and light-colored sand increasing the risk of sunburns. The above information clearly supports the assertion that outdoor workers who are subject to repetitive UV exposure are after-sun product customers.
Some benefits can accrue to firms that manufacture after-sun products specifically targeted at outdoor workers, such as quick-absorption coolants, scentless aloe lotions, protection creams, spray applications, and bulkier sizes suitable for use at the workplace. The marketing and distribution of the brand in drugstores, protective equipment suppliers, occupational health programs, and employer wellness initiatives may be useful in expanding the brand into markets other than those of beaches and holidays. With more sun exposures at workplaces, targeted after-sun products offer room for growth.
| Attribute | Detail |
|---|---|
| Leading Segment |
|
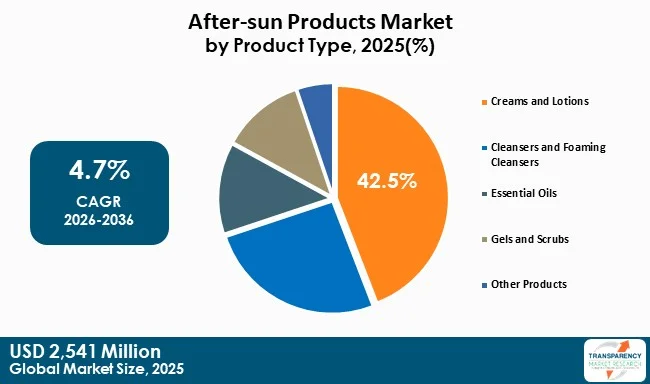
The Creams & Lotions segment holds around 42.5% of the total share of the global After-Sun prodcuts market during the forecast period and represents the most dominant product segment in the beginning of the forecast period. The leadership of this product segment is mainly attributed to the broad consumer acceptance, applicability, and capacity to offer deep skin moisturization and nourishment after exposure to the sun's rays. Commonly, creams and lotions contain moisturizing and soothing ingredients, including aloe vera, glycerin, shea butter, vitamin E, hyaluronic acid, and various plant extracts that aid in the treatment of the dryness, redness, and irritation of the skin caused by UV light rays.
Rising awareness among consumers about the significance of post-sun skincare along with the importance of keeping the skin moisturized is one of the major factors responsible for growth in this segment. Contrary to the light formulations including sprays and gels, creams and lotions deliver lasting moisturization properties and help repair the protective barrier of the skin exposed to sunlight, heat, wind, and environmental elements. With a shift toward viewing after-sun creams and lotions as a necessary part of sun care regimen during holidays, outdoor trips, and seasons with increased UV radiation, the market is witnessing rising demand for premium skincare products and dermatological formulations.
Manufacturers keep launching innovative formulations that feature natural ingredients, antioxidant properties, anti-aging benefits, and clean-label formulations to cater to consumer preference trends. Increasing demand for organic, vegan, and gentle formulas suitable for sensitive skin types has also been playing an influential role in product development in the segment. Owing to increased awareness about skincare, availability in retail stores, and rising demand for skin rejuvenation products, the Creams and Lotions segment is set to remain dominant in the global After-sun Products market during the forecast period.
| Attribute | Detail |
|---|---|
| Leading Region |
|
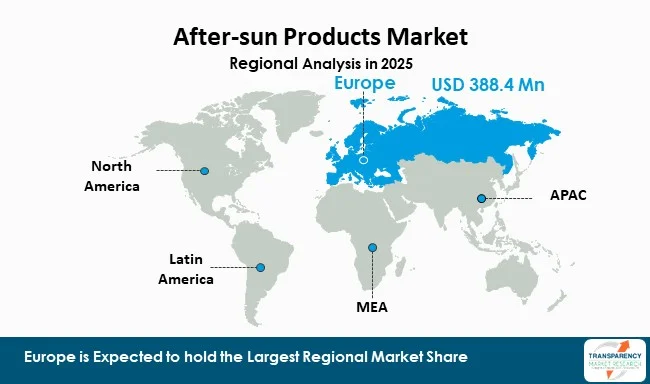
Europe is one of the largest regional markets of After-sun Products accounting for about 35.9% share of the market at the start of the forecast period, thereby emerging as the most dominant regional market of the After-sun Products market. The growth of the Europe region is being fueled due to high consumer consciousness regarding skincare along with extensive use of sun-care products and increasing demand for premium personal care solutions. Major economies such as Germany, France, Italy, Spain, and the UK have matured skincare markets, wherein consumers regularly include after-sun care products in their skincare regimen.
Another advantage enjoyed by the European region is its robust tourism sector along with a large number of people engaging in various forms of outdoor recreation such as sunbathing at the beaches and holidaying during summers. These habits contribute towards more exposure to the sun and consequently, the need for after-sun products becomes consistent. Consumer preferences in this market area have been evolving to include products which have natural ingredients, antioxidants and dermatologically-tested formulations.
The major companies operating in the skin care & personal care segment in the region keep investing in innovation and eco-friendly packaging materials for their products. There is an increasing consumer demand for organic, vegan and eco-friendly products for skin care. Backed by strong retail networks and growing consumer expenditure on skin care, Europe seems to remain at the forefront in the global After-sun Products market.
Key industry players in the After-sun Products Market include L’Oréal S.A., Beiersdorf AG, Kenvue Inc., The Avon Company, Kao Corporation, Shiseido Company, Limited, The Procter & Gamble Company, The Estée Lauder Companies Inc., Unilever PLC, and LVMH Moët Hennessy Louis Vuitton SE. The skincare experience of these companies, coupled with their vast distribution network and large brand portfolio, has enabled them to introduce numerous after-sun lotion products, creams, gels, and other skin soothers. Their objective remains consistent, which is to provide hydration, repair, and protection against the harmful effects of UV rays.
Industry participants are working hard to build their competitive advantage by means of innovation and using high-quality, natural, and dermatologist-tested formulations. Increasing investments into environmentally friendly formulations, natural products, and skin-safe offerings have become essential for these firms in recent years. Constant growth in e-commerce, retail, and travel retail channels, as well as the popularity of a full-fledged sun care regime, keeps the market competitive.
| Attribute | Detail |
|---|---|
| Size in 2025 | USD 2,541 Million |
| Forecast Value in 2036 | USD 3,988.1 Million |
| CAGR | 4.7% |
| Forecast Period | 2026-2036 |
| Historical Data Available for | 2021-2025 |
| Quantitative Units | USD Million for Value |
| After-sun Products Market Analysis | It includes segment analysis as well as regional level analysis. Qualitative analysis includes drivers, restraints, opportunities, key trends, value chain analysis, and key trend analysis. |
| Competition Landscape |
|
| Format | Electronic (PDF) + Excel |
| Segmentation | By Product Type
|
| Regions Covered |
|
| Countries Covered |
|
| Companies Profiled |
|
| Customization Scope | Available upon request |
| Pricing | Available upon request |
The global After-sun Products Market was valued at USD 2,541 Million in 2025.
The market is projected to reach USD 3,988.1 Million by 2036.
The market is expected to expand at a CAGR of 4.7% from 2026 to 2036.
The Creams and Lotions segment dominates the market with a 42.5% share, owing to its superior moisturizing properties, ease of application, long-lasting hydration benefits, and widespread consumer preference for post-sun skin recovery.
Europe leads the market with a 35.9% share, supported by high skincare awareness, strong demand for premium personal care products, widespread sun-care usage, and a large tourism and outdoor recreation industry.
Key players operating in the After-sun Products Market include L’Oréal S.A., Beiersdorf AG, Kenvue Inc., The Avon Company, Kao Corporation, Shiseido Company, Limited, The Procter & Gamble Company, The Estée Lauder Companies Inc., Unilever PLC, LVMH Moët Hennessy Louis Vuitton SE, and other key players.
Table 01: Global After-sun Products Market Value (USD Billion) Projection, By Product Type 2021 to 2036
Table 02: Global After-sun Products Market Volume (Tons) Projection, By Product Type 2021 to 2036
Table 03: Global After-sun Products Market Value (USD Billion) Projection, By End-user 2021 to 2036
Table 04: Global After-sun Products Market Volume (Tons) Projection, By End-user 2021 to 2036
Table 05: Global After-sun Products Market Value (USD Billion) Projection, By Distribution Channel 2021 to 2036
Table 06: Global After-sun Products Market Volume (Tons) Projection, By Distribution Channel 2021 to 2036
Table 07: Global After-sun Products Market Value (USD Billion) Projection, By Region 2021 to 2036
Table 08: Global After-sun Products Market Volume (Tons) Projection, By Region 2021 to 2036
Table 09: North America After-sun Products Market Value (USD Billion) Projection, By Product Type 2021 to 2036
Table 10: North America After-sun Products Market Volume (Tons) Projection, By Product Type 2021 to 2036
Table 11: North America After-sun Products Market Value (USD Billion) Projection, By End-user 2021 to 2036
Table 12: North America After-sun Products Market Volume (Tons) Projection, By End-user 2021 to 2036
Table 13: North America After-sun Products Market Value (USD Billion) Projection, By Distribution Channel 2021 to 2036
Table 14: North America After-sun Products Market Volume (Tons) Projection, By Distribution Channel 2021 to 2036
Table 15: North America After-sun Products Market Value (USD Billion) Projection, By Country 2021 to 2036
Table 16: North America After-sun Products Market Volume (Tons) Projection, By Country 2021 to 2036
Table 17: U.S. After-sun Products Market Value (USD Billion) Projection, By Product Type 2021 to 2036
Table 18: U.S. After-sun Products Market Volume (Tons) Projection, By Product Type 2021 to 2036
Table 19: U.S. After-sun Products Market Value (USD Billion) Projection, By End-user 2021 to 2036
Table 20: U.S. After-sun Products Market Volume (Tons) Projection, By End-user 2021 to 2036
Table 21: U.S. After-sun Products Market Value (USD Billion) Projection, By Distribution Channel 2021 to 2036
Table 22: U.S. After-sun Products Market Volume (Tons) Projection, By Distribution Channel 2021 to 2036
Table 23: Canada After-sun Products Market Value (USD Billion) Projection, By Product Type 2021 to 2036
Table 24: Canada After-sun Products Market Volume (Tons) Projection, By Product Type 2021 to 2036
Table 25: Canada After-sun Products Market Value (USD Billion) Projection, By End-user 2021 to 2036
Table 26: Canada After-sun Products Market Volume (Tons) Projection, By End-user 2021 to 2036
Table 27: Canada After-sun Products Market Value (USD Billion) Projection, By Distribution Channel 2021 to 2036
Table 28: Canada After-sun Products Market Volume (Tons) Projection, By Distribution Channel 2021 to 2036
Table 29: Europe After-sun Products Market Value (USD Billion) Projection, By Product Type 2021 to 2036
Table 30: Europe After-sun Products Market Volume (Tons) Projection, By Product Type 2021 to 2036
Table 31: Europe After-sun Products Market Value (USD Billion) Projection, By End-user 2021 to 2036
Table 32: Europe After-sun Products Market Volume (Tons) Projection, By End-user 2021 to 2036
Table 33: Europe After-sun Products Market Value (USD Billion) Projection, By Distribution Channel 2021 to 2036
Table 34: Europe After-sun Products Market Volume (Tons) Projection, By Distribution Channel 2021 to 2036
Table 35: Europe After-sun Products Market Value (USD Billion) Projection, By Country 2021 to 2036
Table 36: Europe After-sun Products Market Volume (Tons) Projection, By Country 2021 to 2036
Table 37: U.K. After-sun Products Market Value (USD Billion) Projection, By Product Type 2021 to 2036
Table 38: U.K. After-sun Products Market Volume (Tons) Projection, By Product Type 2021 to 2036
Table 39: U.K. After-sun Products Market Value (USD Billion) Projection, By End-user 2021 to 2036
Table 40: U.K. After-sun Products Market Volume (Tons) Projection, By End-user 2021 to 2036
Table 41: U.K. After-sun Products Market Value (USD Billion) Projection, By Distribution Channel 2021 to 2036
Table 42: U.K. After-sun Products Market Volume (Tons) Projection, By Distribution Channel 2021 to 2036
Table 43: Germany After-sun Products Market Value (USD Billion) Projection, By Product Type 2021 to 2036
Table 44: Germany After-sun Products Market Volume (Tons) Projection, By Product Type 2021 to 2036
Table 45: Germany After-sun Products Market Value (USD Billion) Projection, By End-user 2021 to 2036
Table 46: Germany After-sun Products Market Volume (Tons) Projection, By End-user 2021 to 2036
Table 47: Germany After-sun Products Market Value (USD Billion) Projection, By Distribution Channel 2021 to 2036
Table 48: Germany After-sun Products Market Volume (Tons) Projection, By Distribution Channel 2021 to 2036
Table 49: France After-sun Products Market Value (USD Billion) Projection, By Product Type 2021 to 2036
Table 50: France After-sun Products Market Volume (Tons) Projection, By Product Type 2021 to 2036
Table 51: France After-sun Products Market Value (USD Billion) Projection, By End-user 2021 to 2036
Table 52: France After-sun Products Market Volume (Tons) Projection, By End-user 2021 to 2036
Table 53: France After-sun Products Market Value (USD Billion) Projection, By Distribution Channel 2021 to 2036
Table 54: France After-sun Products Market Volume (Tons) Projection, By Distribution Channel 2021 to 2036
Table 55: Italy After-sun Products Market Value (USD Billion) Projection, By Product Type 2021 to 2036
Table 56: Italy After-sun Products Market Volume (Tons) Projection, By Product Type 2021 to 2036
Table 57: Italy After-sun Products Market Value (USD Billion) Projection, By End-user 2021 to 2036
Table 58: Italy After-sun Products Market Volume (Tons) Projection, By End-user 2021 to 2036
Table 59: Italy After-sun Products Market Value (USD Billion) Projection, By Distribution Channel 2021 to 2036
Table 60: Italy After-sun Products Market Volume (Tons) Projection, By Distribution Channel 2021 to 2036
Table 61: Spain After-sun Products Market Value (USD Billion) Projection, By Product Type 2021 to 2036
Table 62: Spain After-sun Products Market Volume (Tons) Projection, By Product Type 2021 to 2036
Table 63: Spain After-sun Products Market Value (USD Billion) Projection, By End-user 2021 to 2036
Table 64: Spain After-sun Products Market Volume (Tons) Projection, By End-user 2021 to 2036
Table 65: Spain After-sun Products Market Value (USD Billion) Projection, By Distribution Channel 2021 to 2036
Table 66: Spain After-sun Products Market Volume (Tons) Projection, By Distribution Channel 2021 to 2036
Table 67: The Netherlands After-sun Products Market Value (USD Billion) Projection, By Product Type 2021 to 2036
Table 68: The Netherlands After-sun Products Market Volume (Tons) Projection, By Product Type 2021 to 2036
Table 69: The Netherlands After-sun Products Market Value (USD Billion) Projection, By End-user 2021 to 2036
Table 70: The Netherlands After-sun Products Market Volume (Tons) Projection, By End-user 2021 to 2036
Table 71: The Netherlands After-sun Products Market Value (USD Billion) Projection, By Distribution Channel 2021 to 2036
Table 72: The Netherlands After-sun Products Market Volume (Tons) Projection, By Distribution Channel 2021 to 2036
Table 73: Asia Pacific After-sun Products Market Value (USD Billion) Projection, By Product Type 2021 to 2036
Table 74: Asia Pacific After-sun Products Market Volume (Tons) Projection, By Product Type 2021 to 2036
Table 75: Asia Pacific After-sun Products Market Value (USD Billion) Projection, By End-user 2021 to 2036
Table 76: Asia Pacific After-sun Products Market Volume (Tons) Projection, By End-user 2021 to 2036
Table 77: Asia Pacific After-sun Products Market Value (USD Billion) Projection, By Distribution Channel 2021 to 2036
Table 78: Asia Pacific After-sun Products Market Volume (Tons) Projection, By Distribution Channel 2021 to 2036
Table 79: Asia Pacific After-sun Products Market Value (USD Billion) Projection, By Country 2021 to 2036
Table 80: Asia Pacific After-sun Products Market Volume (Tons) Projection, By Country 2021 to 2036
Table 81: China After-sun Products Market Value (USD Billion) Projection, By Product Type 2021 to 2036
Table 82: China After-sun Products Market Volume (Tons) Projection, By Product Type 2021 to 2036
Table 83: China After-sun Products Market Value (USD Billion) Projection, By End-user 2021 to 2036
Table 84: China After-sun Products Market Volume (Tons) Projection, By End-user 2021 to 2036
Table 85: China After-sun Products Market Value (USD Billion) Projection, By Distribution Channel 2021 to 2036
Table 86: China After-sun Products Market Volume (Tons) Projection, By Distribution Channel 2021 to 2036
Table 87: India After-sun Products Market Value (USD Billion) Projection, By Product Type 2021 to 2036
Table 88: India After-sun Products Market Volume (Tons) Projection, By Product Type 2021 to 2036
Table 89: India After-sun Products Market Value (USD Billion) Projection, By End-user 2021 to 2036
Table 90: India After-sun Products Market Volume (Tons) Projection, By End-user 2021 to 2036
Table 91: India After-sun Products Market Value (USD Billion) Projection, By Distribution Channel 2021 to 2036
Table 92: India After-sun Products Market Volume (Tons) Projection, By Distribution Channel 2021 to 2036
Table 93: Japan After-sun Products Market Value (USD Billion) Projection, By Product Type 2021 to 2036
Table 94: Japan After-sun Products Market Volume (Tons) Projection, By Product Type 2021 to 2036
Table 95: Japan After-sun Products Market Value (USD Billion) Projection, By End-user 2021 to 2036
Table 96: Japan After-sun Products Market Volume (Tons) Projection, By End-user 2021 to 2036
Table 97: Japan After-sun Products Market Value (USD Billion) Projection, By Distribution Channel 2021 to 2036
Table 98: Japan After-sun Products Market Volume (Tons) Projection, By Distribution Channel 2021 to 2036
Table 99: Australia After-sun Products Market Value (USD Billion) Projection, By Product Type 2021 to 2036
Table 100: Australia After-sun Products Market Volume (Tons) Projection, By Product Type 2021 to 2036
Table 101: Australia After-sun Products Market Value (USD Billion) Projection, By End-user 2021 to 2036
Table 102: Australia After-sun Products Market Volume (Tons) Projection, By End-user 2021 to 2036
Table 103: Australia After-sun Products Market Value (USD Billion) Projection, By Distribution Channel 2021 to 2036
Table 104: Australia After-sun Products Market Volume (Tons) Projection, By Distribution Channel 2021 to 2036
Table 105: South Korea After-sun Products Market Value (USD Billion) Projection, By Product Type 2021 to 2036
Table 106: South Korea After-sun Products Market Volume (Tons) Projection, By Product Type 2021 to 2036
Table 107: South Korea After-sun Products Market Value (USD Billion) Projection, By End-user 2021 to 2036
Table 108: South Korea After-sun Products Market Volume (Tons) Projection, By End-user 2021 to 2036
Table 109: South Korea After-sun Products Market Value (USD Billion) Projection, By Distribution Channel 2021 to 2036
Table 110: South Korea After-sun Products Market Volume (Tons) Projection, By Distribution Channel 2021 to 2036
Table 111: ASEAN After-sun Products Market Value (USD Billion) Projection, By Product Type 2021 to 2036
Table 112: ASEAN After-sun Products Market Volume (Tons) Projection, By Product Type 2021 to 2036
Table 113: ASEAN After-sun Products Market Value (USD Billion) Projection, By End-user 2021 to 2036
Table 114: ASEAN After-sun Products Market Volume (Tons) Projection, By End-user 2021 to 2036
Table 115: ASEAN After-sun Products Market Value (USD Billion) Projection, By Distribution Channel 2021 to 2036
Table 116: ASEAN After-sun Products Market Volume (Tons) Projection, By Distribution Channel 2021 to 2036
Table 117: Middle East & Africa After-sun Products Market Value (USD Billion) Projection, By Product Type 2021 to 2036
Table 118: Middle East & Africa After-sun Products Market Volume (Tons) Projection, By Product Type 2021 to 2036
Table 119: Middle East & Africa After-sun Products Market Value (USD Billion) Projection, By End-user 2021 to 2036
Table 120: Middle East & Africa After-sun Products Market Volume (Tons) Projection, By End-user 2021 to 2036
Table 121: Middle East & Africa After-sun Products Market Value (USD Billion) Projection, By Distribution Channel 2021 to 2036
Table 122: Middle East & Africa After-sun Products Market Volume (Tons) Projection, By Distribution Channel 2021 to 2036
Table 123: Middle East & Africa After-sun Products Market Value (USD Billion) Projection, By Country 2021 to 2036
Table 124: Middle East & Africa After-sun Products Market Volume (Tons) Projection, By Country 2021 to 2036
Table 125: GCC Countries After-sun Products Market Value (USD Billion) Projection, By Product Type 2021 to 2036
Table 126: GCC Countries After-sun Products Market Volume (Tons) Projection, By Product Type 2021 to 2036
Table 127: GCC Countries After-sun Products Market Value (USD Billion) Projection, By End-user 2021 to 2036
Table 128: GCC Countries After-sun Products Market Volume (Tons) Projection, By End-user 2021 to 2036
Table 129: GCC Countries After-sun Products Market Value (USD Billion) Projection, By Distribution Channel 2021 to 2036
Table 130: GCC Countries After-sun Products Market Volume (Tons) Projection, By Distribution Channel 2021 to 2036
Table 131: South Africa After-sun Products Market Value (USD Billion) Projection, By Product Type 2021 to 2036
Table 132: South Africa After-sun Products Market Volume (Tons) Projection, By Product Type 2021 to 2036
Table 133: South Africa After-sun Products Market Value (USD Billion) Projection, By End-user 2021 to 2036
Table 134: South Africa After-sun Products Market Volume (Tons) Projection, By End-user 2021 to 2036
Table 135: South Africa After-sun Products Market Value (USD Billion) Projection, By Distribution Channel 2021 to 2036
Table 136: South Africa After-sun Products Market Volume (Tons) Projection, By Distribution Channel 2021 to 2036
Table 137: Latin America After-sun Products Market Value (USD Billion) Projection, By Product Type 2021 to 2036
Table 138: Latin America After-sun Products Market Volume (Tons) Projection, By Product Type 2021 to 2036
Table 139: Latin America After-sun Products Market Value (USD Billion) Projection, By End-user 2021 to 2036
Table 140: Latin America After-sun Products Market Volume (Tons) Projection, By End-user 2021 to 2036
Table 141: Latin America After-sun Products Market Value (USD Billion) Projection, By Distribution Channel 2021 to 2036
Table 142: Latin America After-sun Products Market Volume (Tons) Projection, By Distribution Channel 2021 to 2036
Table 143: Latin America After-sun Products Market Value (USD Billion) Projection, By Country 2021 to 2036
Table 144: Latin America After-sun Products Market Volume (Tons) Projection, By Country 2021 to 2036
Table 145: Brazil After-sun Products Market Value (USD Billion) Projection, By Product Type 2021 to 2036
Table 146: Brazil After-sun Products Market Volume (Tons) Projection, By Product Type 2021 to 2036
Table 147: Brazil After-sun Products Market Value (USD Billion) Projection, By End-user 2021 to 2036
Table 148: Brazil After-sun Products Market Volume (Tons) Projection, By End-user 2021 to 2036
Table 149: Brazil After-sun Products Market Value (USD Billion) Projection, By Distribution Channel 2021 to 2036
Table 150: Brazil After-sun Products Market Volume (Tons) Projection, By Distribution Channel 2021 to 2036
Table 151: Mexico After-sun Products Market Value (USD Billion) Projection, By Product Type 2021 to 2036
Table 152: Mexico After-sun Products Market Volume (Tons) Projection, By Product Type 2021 to 2036
Table 153: Mexico After-sun Products Market Value (USD Billion) Projection, By End-user 2021 to 2036
Table 154: Mexico After-sun Products Market Volume (Tons) Projection, By End-user 2021 to 2036
Table 155: Mexico After-sun Products Market Value (USD Billion) Projection, By Distribution Channel 2021 to 2036
Table 156: Mexico After-sun Products Market Volume (Tons) Projection, By Distribution Channel 2021 to 2036
Table 157: Argentina After-sun Products Market Value (USD Billion) Projection, By Product Type 2021 to 2036
Table 158: Argentina After-sun Products Market Volume (Tons) Projection, By Product Type 2021 to 2036
Table 159: Argentina After-sun Products Market Value (USD Billion) Projection, By End-user 2021 to 2036
Table 160: Argentina After-sun Products Market Volume (Tons) Projection, By End-user 2021 to 2036
Table 161: Argentina After-sun Products Market Value (USD Billion) Projection, By Distribution Channel 2021 to 2036
Table 162: Argentina After-sun Products Market Volume (Tons) Projection, By Distribution Channel 2021 to 2036
Figure 01: Global After-sun Products Market Value (USD Billion) Projection, By Product Type 2021 to 2036
Figure 02: Global After-sun Products Market Volume (Tons) Projection, By Product Type 2021 to 2036
Figure 03: Global After-sun Products Market Incremental Opportunities (USD Billion) Forecast, By Product Type 2026 to 2036
Figure 04: Global After-sun Products Market Value (USD Billion) Projection, By End-user 2021 to 2036
Figure 05: Global After-sun Products Market Volume (Tons) Projection, By End-user 2021 to 2036
Figure 06: Global After-sun Products Market Incremental Opportunities (USD Billion) Forecast, By End-user 2026 to 2036
Figure 07: Global After-sun Products Market Value (USD Billion) Projection, By Distribution Channel 2021 to 2036
Figure 08: Global After-sun Products Market Volume (Tons) Projection, By Distribution Channel 2021 to 2036
Figure 09: Global After-sun Products Market Incremental Opportunities (USD Billion) Forecast, By Distribution Channel 2026 to 2036
Figure 10: Global After-sun Products Market Value (USD Billion) Projection, By Region 2021 to 2036
Figure 11: Global After-sun Products Market Volume (Tons) Projection, By Region 2021 to 2036
Figure 12: Global After-sun Products Market Incremental Opportunities (USD Billion) Forecast, By Region 2026 to 2036
Figure 13: North America After-sun Products Market Value (USD Billion) Projection, By Product Type 2021 to 2036
Figure 14: North America After-sun Products Market Volume (Tons) Projection, By Product Type 2021 to 2036
Figure 15: North America After-sun Products Market Incremental Opportunities (USD Billion) Forecast, By Product Type 2026 to 2036
Figure 16: North America After-sun Products Market Value (USD Billion) Projection, By End-user 2021 to 2036
Figure 17: North America After-sun Products Market Volume (Tons) Projection, By End-user 2021 to 2036
Figure 18: North America After-sun Products Market Incremental Opportunities (USD Billion) Forecast, By End-user 2026 to 2036
Figure 19: North America After-sun Products Market Value (USD Billion) Projection, By Distribution Channel 2021 to 2036
Figure 20: North America After-sun Products Market Volume (Tons) Projection, By Distribution Channel 2021 to 2036
Figure 21: North America After-sun Products Market Incremental Opportunities (USD Billion) Forecast, By Distribution Channel 2026 to 2036
Figure 22: North America After-sun Products Market Value (USD Billion) Projection, By Country 2021 to 2036
Figure 23: North America After-sun Products Market Volume (Tons) Projection, By Country 2021 to 2036
Figure 24: North America After-sun Products Market Incremental Opportunities (USD Billion) Forecast, By Country 2026 to 2036
Figure 25: U.S. After-sun Products Market Value (USD Billion) Projection, By Product Type 2021 to 2036
Figure 26: U.S. After-sun Products Market Volume (Tons) Projection, By Product Type 2021 to 2036
Figure 27: U.S. After-sun Products Market Incremental Opportunities (USD Billion) Forecast, By Product Type 2026 to 2036
Figure 28: U.S. After-sun Products Market Value (USD Billion) Projection, By End-user 2021 to 2036
Figure 29: U.S. After-sun Products Market Volume (Tons) Projection, By End-user 2021 to 2036
Figure 30: U.S. After-sun Products Market Incremental Opportunities (USD Billion) Forecast, By End-user 2026 to 2036
Figure 31: U.S. After-sun Products Market Value (USD Billion) Projection, By Distribution Channel 2021 to 2036
Figure 32: U.S. After-sun Products Market Volume (Tons) Projection, By Distribution Channel 2021 to 2036
Figure 33: U.S. After-sun Products Market Incremental Opportunities (USD Billion) Forecast, By Distribution Channel 2026 to 2036
Figure 34: Canada After-sun Products Market Value (USD Billion) Projection, By Product Type 2021 to 2036
Figure 35: Canada After-sun Products Market Volume (Tons) Projection, By Product Type 2021 to 2036
Figure 36: Canada After-sun Products Market Incremental Opportunities (USD Billion) Forecast, By Product Type 2026 to 2036
Figure 37: Canada After-sun Products Market Value (USD Billion) Projection, By End-user 2021 to 2036
Figure 38: Canada After-sun Products Market Volume (Tons) Projection, By End-user 2021 to 2036
Figure 39: Canada After-sun Products Market Incremental Opportunities (USD Billion) Forecast, By End-user 2026 to 2036
Figure 40: Canada After-sun Products Market Value (USD Billion) Projection, By Distribution Channel 2021 to 2036
Figure 41: Canada After-sun Products Market Volume (Tons) Projection, By Distribution Channel 2021 to 2036
Figure 42: Canada After-sun Products Market Incremental Opportunities (USD Billion) Forecast, By Distribution Channel 2026 to 2036
Figure 43: Europe After-sun Products Market Value (USD Billion) Projection, By Product Type 2021 to 2036
Figure 44: Europe After-sun Products Market Volume (Tons) Projection, By Product Type 2021 to 2036
Figure 45: Europe After-sun Products Market Incremental Opportunities (USD Billion) Forecast, By Product Type 2026 to 2036
Figure 46: Europe After-sun Products Market Value (USD Billion) Projection, By End-user 2021 to 2036
Figure 47: Europe After-sun Products Market Volume (Tons) Projection, By End-user 2021 to 2036
Figure 48: Europe After-sun Products Market Incremental Opportunities (USD Billion) Forecast, By End-user 2026 to 2036
Figure 49: Europe After-sun Products Market Value (USD Billion) Projection, By Distribution Channel 2021 to 2036
Figure 50: Europe After-sun Products Market Volume (Tons) Projection, By Distribution Channel 2021 to 2036
Figure 51: Europe After-sun Products Market Incremental Opportunities (USD Billion) Forecast, By Distribution Channel 2026 to 2036
Figure 52: Europe After-sun Products Market Value (USD Billion) Projection, By Country 2021 to 2036
Figure 53: Europe After-sun Products Market Volume (Tons) Projection, By Country 2021 to 2036
Figure 54: Europe After-sun Products Market Incremental Opportunities (USD Billion) Forecast, By Country 2026 to 2036
Figure 55: U.K. After-sun Products Market Value (USD Billion) Projection, By Product Type 2021 to 2036
Figure 56: U.K. After-sun Products Market Volume (Tons) Projection, By Product Type 2021 to 2036
Figure 57: U.K. After-sun Products Market Incremental Opportunities (USD Billion) Forecast, By Product Type 2026 to 2036
Figure 58: U.K. After-sun Products Market Value (USD Billion) Projection, By End-user 2021 to 2036
Figure 59: U.K. After-sun Products Market Volume (Tons) Projection, By End-user 2021 to 2036
Figure 60: U.K. After-sun Products Market Incremental Opportunities (USD Billion) Forecast, By End-user 2026 to 2036
Figure 61: U.K. After-sun Products Market Value (USD Billion) Projection, By Distribution Channel 2021 to 2036
Figure 62: U.K. After-sun Products Market Volume (Tons) Projection, By Distribution Channel 2021 to 2036
Figure 63: U.K. After-sun Products Market Incremental Opportunities (USD Billion) Forecast, By Distribution Channel 2026 to 2036
Figure 64: Germany After-sun Products Market Value (USD Billion) Projection, By Product Type 2021 to 2036
Figure 65: Germany After-sun Products Market Volume (Tons) Projection, By Product Type 2021 to 2036
Figure 66: Germany After-sun Products Market Incremental Opportunities (USD Billion) Forecast, By Product Type 2026 to 2036
Figure 67: Germany After-sun Products Market Value (USD Billion) Projection, By End-user 2021 to 2036
Figure 68: Germany After-sun Products Market Volume (Tons) Projection, By End-user 2021 to 2036
Figure 69: Germany After-sun Products Market Incremental Opportunities (USD Billion) Forecast, By End-user 2026 to 2036
Figure 70: Germany After-sun Products Market Value (USD Billion) Projection, By Distribution Channel 2021 to 2036
Figure 71: Germany After-sun Products Market Volume (Tons) Projection, By Distribution Channel 2021 to 2036
Figure 72: Germany After-sun Products Market Incremental Opportunities (USD Billion) Forecast, By Distribution Channel 2026 to 2036
Figure 73: France After-sun Products Market Value (USD Billion) Projection, By Product Type 2021 to 2036
Figure 74: France After-sun Products Market Volume (Tons) Projection, By Product Type 2021 to 2036
Figure 75: France After-sun Products Market Incremental Opportunities (USD Billion) Forecast, By Product Type 2026 to 2036
Figure 76: France After-sun Products Market Value (USD Billion) Projection, By End-user 2021 to 2036
Figure 77: France After-sun Products Market Volume (Tons) Projection, By End-user 2021 to 2036
Figure 78: France After-sun Products Market Incremental Opportunities (USD Billion) Forecast, By End-user 2026 to 2036
Figure 79: France After-sun Products Market Value (USD Billion) Projection, By Distribution Channel 2021 to 2036
Figure 80: France After-sun Products Market Volume (Tons) Projection, By Distribution Channel 2021 to 2036
Figure 81: France After-sun Products Market Incremental Opportunities (USD Billion) Forecast, By Distribution Channel 2026 to 2036
Figure 82: Italy After-sun Products Market Value (USD Billion) Projection, By Product Type 2021 to 2036
Figure 83: Italy After-sun Products Market Volume (Tons) Projection, By Product Type 2021 to 2036
Figure 84: Italy After-sun Products Market Incremental Opportunities (USD Billion) Forecast, By Product Type 2026 to 2036
Figure 85: Italy After-sun Products Market Value (USD Billion) Projection, By End-user 2021 to 2036
Figure 86: Italy After-sun Products Market Volume (Tons) Projection, By End-user 2021 to 2036
Figure 87: Italy After-sun Products Market Incremental Opportunities (USD Billion) Forecast, By End-user 2026 to 2036
Figure 88: Italy After-sun Products Market Value (USD Billion) Projection, By Distribution Channel 2021 to 2036
Figure 89: Italy After-sun Products Market Volume (Tons) Projection, By Distribution Channel 2021 to 2036
Figure 90: Italy After-sun Products Market Incremental Opportunities (USD Billion) Forecast, By Distribution Channel 2026 to 2036
Figure 91: Spain After-sun Products Market Value (USD Billion) Projection, By Product Type 2021 to 2036
Figure 92: Spain After-sun Products Market Volume (Tons) Projection, By Product Type 2021 to 2036
Figure 93: Spain After-sun Products Market Incremental Opportunities (USD Billion) Forecast, By Product Type 2026 to 2036
Figure 94: Spain After-sun Products Market Value (USD Billion) Projection, By End-user 2021 to 2036
Figure 95: Spain After-sun Products Market Volume (Tons) Projection, By End-user 2021 to 2036
Figure 96: Spain After-sun Products Market Incremental Opportunities (USD Billion) Forecast, By End-user 2026 to 2036
Figure 97: Spain After-sun Products Market Value (USD Billion) Projection, By Distribution Channel 2021 to 2036
Figure 98: Spain After-sun Products Market Volume (Tons) Projection, By Distribution Channel 2021 to 2036
Figure 99: Spain After-sun Products Market Incremental Opportunities (USD Billion) Forecast, By Distribution Channel 2026 to 2036
Figure 100: The Netherlands After-sun Products Market Value (USD Billion) Projection, By Product Type 2021 to 2036
Figure 101: The Netherlands After-sun Products Market Volume (Tons) Projection, By Product Type 2021 to 2036
Figure 102: The Netherlands After-sun Products Market Incremental Opportunities (USD Billion) Forecast, By Product Type 2026 to 2036
Figure 103: The Netherlands After-sun Products Market Value (USD Billion) Projection, By End-user 2021 to 2036
Figure 104: The Netherlands After-sun Products Market Volume (Tons) Projection, By End-user 2021 to 2036
Figure 105: The Netherlands After-sun Products Market Incremental Opportunities (USD Billion) Forecast, By End-user 2026 to 2036
Figure 106: The Netherlands After-sun Products Market Value (USD Billion) Projection, By Distribution Channel 2021 to 2036
Figure 107: The Netherlands After-sun Products Market Volume (Tons) Projection, By Distribution Channel 2021 to 2036
Figure 108: The Netherlands After-sun Products Market Incremental Opportunities (USD Billion) Forecast, By Distribution Channel 2026 to 2036
Figure 109: Asia Pacific After-sun Products Market Value (USD Billion) Projection, By Product Type 2021 to 2036
Figure 110: Asia Pacific After-sun Products Market Volume (Tons) Projection, By Product Type 2021 to 2036
Figure 111: Asia Pacific After-sun Products Market Incremental Opportunities (USD Billion) Forecast, By Product Type 2026 to 2036
Figure 112: Asia Pacific After-sun Products Market Value (USD Billion) Projection, By End-user 2021 to 2036
Figure 113: Asia Pacific After-sun Products Market Volume (Tons) Projection, By End-user 2021 to 2036
Figure 114: Asia Pacific After-sun Products Market Incremental Opportunities (USD Billion) Forecast, By End-user 2026 to 2036
Figure 115: Asia Pacific After-sun Products Market Value (USD Billion) Projection, By Distribution Channel 2021 to 2036
Figure 116: Asia Pacific After-sun Products Market Volume (Tons) Projection, By Distribution Channel 2021 to 2036
Figure 117: Asia Pacific After-sun Products Market Incremental Opportunities (USD Billion) Forecast, By Distribution Channel 2026 to 2036
Figure 118: Asia Pacific After-sun Products Market Value (USD Billion) Projection, By Country 2021 to 2036
Figure 119: Asia Pacific After-sun Products Market Volume (Tons) Projection, By Country 2021 to 2036
Figure 120: Asia Pacific After-sun Products Market Incremental Opportunities (USD Billion) Forecast, By Country 2026 to 2036
Figure 121: China After-sun Products Market Value (USD Billion) Projection, By Product Type 2021 to 2036
Figure 122: China After-sun Products Market Volume (Tons) Projection, By Product Type 2021 to 2036
Figure 123: China After-sun Products Market Incremental Opportunities (USD Billion) Forecast, By Product Type 2026 to 2036
Figure 124: China After-sun Products Market Value (USD Billion) Projection, By End-user 2021 to 2036
Figure 125: China After-sun Products Market Volume (Tons) Projection, By End-user 2021 to 2036
Figure 126: China After-sun Products Market Incremental Opportunities (USD Billion) Forecast, By End-user 2026 to 2036
Figure 127: China After-sun Products Market Value (USD Billion) Projection, By Distribution Channel 2021 to 2036
Figure 128: China After-sun Products Market Volume (Tons) Projection, By Distribution Channel 2021 to 2036
Figure 129: China After-sun Products Market Incremental Opportunities (USD Billion) Forecast, By Distribution Channel 2026 to 2036
Figure 130: India After-sun Products Market Value (USD Billion) Projection, By Product Type 2021 to 2036
Figure 131: India After-sun Products Market Volume (Tons) Projection, By Product Type 2021 to 2036
Figure 132: India After-sun Products Market Incremental Opportunities (USD Billion) Forecast, By Product Type 2026 to 2036
Figure 133: India After-sun Products Market Value (USD Billion) Projection, By End-user 2021 to 2036
Figure 134: India After-sun Products Market Volume (Tons) Projection, By End-user 2021 to 2036
Figure 135: India After-sun Products Market Incremental Opportunities (USD Billion) Forecast, By End-user 2026 to 2036
Figure 136: India After-sun Products Market Value (USD Billion) Projection, By Distribution Channel 2021 to 2036
Figure 137: India After-sun Products Market Volume (Tons) Projection, By Distribution Channel 2021 to 2036
Figure 138: India After-sun Products Market Incremental Opportunities (USD Billion) Forecast, By Distribution Channel 2026 to 2036
Figure 139: Japan After-sun Products Market Value (USD Billion) Projection, By Product Type 2021 to 2036
Figure 140: Japan After-sun Products Market Volume (Tons) Projection, By Product Type 2021 to 2036
Figure 141: Japan After-sun Products Market Incremental Opportunities (USD Billion) Forecast, By Product Type 2026 to 2036
Figure 142: Japan After-sun Products Market Value (USD Billion) Projection, By End-user 2021 to 2036
Figure 143: Japan After-sun Products Market Volume (Tons) Projection, By End-user 2021 to 2036
Figure 144: Japan After-sun Products Market Incremental Opportunities (USD Billion) Forecast, By End-user 2026 to 2036
Figure 145: Japan After-sun Products Market Value (USD Billion) Projection, By Distribution Channel 2021 to 2036
Figure 146: Japan After-sun Products Market Volume (Tons) Projection, By Distribution Channel 2021 to 2036
Figure 147: Japan After-sun Products Market Incremental Opportunities (USD Billion) Forecast, By Distribution Channel 2026 to 2036
Figure 148: Australia After-sun Products Market Value (USD Billion) Projection, By Product Type 2021 to 2036
Figure 149: Australia After-sun Products Market Volume (Tons) Projection, By Product Type 2021 to 2036
Figure 150: Australia After-sun Products Market Incremental Opportunities (USD Billion) Forecast, By Product Type 2026 to 2036
Figure 151: Australia After-sun Products Market Value (USD Billion) Projection, By End-user 2021 to 2036
Figure 152: Australia After-sun Products Market Volume (Tons) Projection, By End-user 2021 to 2036
Figure 153: Australia After-sun Products Market Incremental Opportunities (USD Billion) Forecast, By End-user 2026 to 2036
Figure 154: Australia After-sun Products Market Value (USD Billion) Projection, By Distribution Channel 2021 to 2036
Figure 155: Australia After-sun Products Market Volume (Tons) Projection, By Distribution Channel 2021 to 2036
Figure 156: Australia After-sun Products Market Incremental Opportunities (USD Billion) Forecast, By Distribution Channel 2026 to 2036
Figure 157: South Korea After-sun Products Market Value (USD Billion) Projection, By Product Type 2021 to 2036
Figure 158: South Korea After-sun Products Market Volume (Tons) Projection, By Product Type 2021 to 2036
Figure 159: South Korea After-sun Products Market Incremental Opportunities (USD Billion) Forecast, By Product Type 2026 to 2036
Figure 160: South Korea After-sun Products Market Value (USD Billion) Projection, By End-user 2021 to 2036
Figure 161: South Korea After-sun Products Market Volume (Tons) Projection, By End-user 2021 to 2036
Figure 162: South Korea After-sun Products Market Incremental Opportunities (USD Billion) Forecast, By End-user 2026 to 2036
Figure 163: South Korea After-sun Products Market Value (USD Billion) Projection, By Distribution Channel 2021 to 2036
Figure 164: South Korea After-sun Products Market Volume (Tons) Projection, By Distribution Channel 2021 to 2036
Figure 165: South Korea After-sun Products Market Incremental Opportunities (USD Billion) Forecast, By Distribution Channel 2026 to 2036
Figure 166: ASEAN After-sun Products Market Value (USD Billion) Projection, By Product Type 2021 to 2036
Figure 167: ASEAN After-sun Products Market Volume (Tons) Projection, By Product Type 2021 to 2036
Figure 168: ASEAN After-sun Products Market Incremental Opportunities (USD Billion) Forecast, By Product Type 2026 to 2036
Figure 169: ASEAN After-sun Products Market Value (USD Billion) Projection, By End-user 2021 to 2036
Figure 170: ASEAN After-sun Products Market Volume (Tons) Projection, By End-user 2021 to 2036
Figure 171: ASEAN After-sun Products Market Incremental Opportunities (USD Billion) Forecast, By End-user 2026 to 2036
Figure 172: ASEAN After-sun Products Market Value (USD Billion) Projection, By Distribution Channel 2021 to 2036
Figure 173: ASEAN After-sun Products Market Volume (Tons) Projection, By Distribution Channel 2021 to 2036
Figure 174: ASEAN After-sun Products Market Incremental Opportunities (USD Billion) Forecast, By Distribution Channel 2026 to 2036
Figure 175: Middle East & Africa After-sun Products Market Value (USD Billion) Projection, By Product Type 2021 to 2036
Figure 176: Middle East & Africa After-sun Products Market Volume (Tons) Projection, By Product Type 2021 to 2036
Figure 177: Middle East & Africa After-sun Products Market Incremental Opportunities (USD Billion) Forecast, By Product Type 2026 to 2036
Figure 178: Middle East & Africa After-sun Products Market Value (USD Billion) Projection, By End-user 2021 to 2036
Figure 179: Middle East & Africa After-sun Products Market Volume (Tons) Projection, By End-user 2021 to 2036
Figure 180: Middle East & Africa After-sun Products Market Incremental Opportunities (USD Billion) Forecast, By End-user 2026 to 2036
Figure 181: Middle East & Africa After-sun Products Market Value (USD Billion) Projection, By Distribution Channel 2021 to 2036
Figure 182: Middle East & Africa After-sun Products Market Volume (Tons) Projection, By Distribution Channel 2021 to 2036
Figure 183: Middle East & Africa After-sun Products Market Incremental Opportunities (USD Billion) Forecast, By Distribution Channel 2026 to 2036
Figure 184: Middle East & Africa After-sun Products Market Value (USD Billion) Projection, By Country 2021 to 2036
Figure 185: Middle East & Africa After-sun Products Market Volume (Tons) Projection, By Country 2021 to 2036
Figure 186: Middle East & Africa After-sun Products Market Incremental Opportunities (USD Billion) Forecast, By Country 2026 to 2036
Figure 187: GCC Countries After-sun Products Market Value (USD Billion) Projection, By Product Type 2021 to 2036
Figure 188: GCC Countries After-sun Products Market Volume (Tons) Projection, By Product Type 2021 to 2036
Figure 189: GCC Countries After-sun Products Market Incremental Opportunities (USD Billion) Forecast, By Product Type 2026 to 2036
Figure 190: GCC Countries After-sun Products Market Value (USD Billion) Projection, By End-user 2021 to 2036
Figure 191: GCC Countries After-sun Products Market Volume (Tons) Projection, By End-user 2021 to 2036
Figure 192: GCC Countries After-sun Products Market Incremental Opportunities (USD Billion) Forecast, By End-user 2026 to 2036
Figure 193: GCC Countries After-sun Products Market Value (USD Billion) Projection, By Distribution Channel 2021 to 2036
Figure 194: GCC Countries After-sun Products Market Volume (Tons) Projection, By Distribution Channel 2021 to 2036
Figure 195: GCC Countries After-sun Products Market Incremental Opportunities (USD Billion) Forecast, By Distribution Channel 2026 to 2036
Figure 196: South Africa After-sun Products Market Value (USD Billion) Projection, By Product Type 2021 to 2036
Figure 197: South Africa After-sun Products Market Volume (Tons) Projection, By Product Type 2021 to 2036
Figure 198: South Africa After-sun Products Market Incremental Opportunities (USD Billion) Forecast, By Product Type 2026 to 2036
Figure 199: South Africa After-sun Products Market Value (USD Billion) Projection, By End-user 2021 to 2036
Figure 200: South Africa After-sun Products Market Volume (Tons) Projection, By End-user 2021 to 2036
Figure 201: South Africa After-sun Products Market Incremental Opportunities (USD Billion) Forecast, By End-user 2026 to 2036
Figure 202: South Africa After-sun Products Market Value (USD Billion) Projection, By Distribution Channel 2021 to 2036
Figure 203: South Africa After-sun Products Market Volume (Tons) Projection, By Distribution Channel 2021 to 2036
Figure 204: South Africa After-sun Products Market Incremental Opportunities (USD Billion) Forecast, By Distribution Channel 2026 to 2036
Figure 205: Latin America After-sun Products Market Value (USD Billion) Projection, By Product Type 2021 to 2036
Figure 206: Latin America After-sun Products Market Volume (Tons) Projection, By Product Type 2021 to 2036
Figure 207: Latin America After-sun Products Market Incremental Opportunities (USD Billion) Forecast, By Product Type 2026 to 2036
Figure 208: Latin America After-sun Products Market Value (USD Billion) Projection, By End-user 2021 to 2036
Figure 209: Latin America After-sun Products Market Volume (Tons) Projection, By End-user 2021 to 2036
Figure 210: Latin America After-sun Products Market Incremental Opportunities (USD Billion) Forecast, By End-user 2026 to 2036
Figure 211: Latin America After-sun Products Market Value (USD Billion) Projection, By Distribution Channel 2021 to 2036
Figure 212: Latin America After-sun Products Market Volume (Tons) Projection, By Distribution Channel 2021 to 2036
Figure 213: Latin America After-sun Products Market Incremental Opportunities (USD Billion) Forecast, By Distribution Channel 2026 to 2036
Figure 214: Latin America After-sun Products Market Value (USD Billion) Projection, By Country 2021 to 2036
Figure 215: Latin America After-sun Products Market Volume (Tons) Projection, By Country 2021 to 2036
Figure 216: Latin America After-sun Products Market Incremental Opportunities (USD Billion) Forecast, By Country 2026 to 2036
Figure 217: Brazil After-sun Products Market Value (USD Billion) Projection, By Product Type 2021 to 2036
Figure 218: Brazil After-sun Products Market Volume (Tons) Projection, By Product Type 2021 to 2036
Figure 219: Brazil After-sun Products Market Incremental Opportunities (USD Billion) Forecast, By Product Type 2026 to 2036
Figure 220: Brazil After-sun Products Market Value (USD Billion) Projection, By End-user 2021 to 2036
Figure 221: Brazil After-sun Products Market Volume (Tons) Projection, By End-user 2021 to 2036
Figure 222: Brazil After-sun Products Market Incremental Opportunities (USD Billion) Forecast, By End-user 2026 to 2036
Figure 223: Brazil After-sun Products Market Value (USD Billion) Projection, By Distribution Channel 2021 to 2036
Figure 224: Brazil After-sun Products Market Volume (Tons) Projection, By Distribution Channel 2021 to 2036
Figure 225: Brazil After-sun Products Market Incremental Opportunities (USD Billion) Forecast, By Distribution Channel 2026 to 2036
Figure 226: Mexico After-sun Products Market Value (USD Billion) Projection, By Product Type 2021 to 2036
Figure 227: Mexico After-sun Products Market Volume (Tons) Projection, By Product Type 2021 to 2036
Figure 228: Mexico After-sun Products Market Incremental Opportunities (USD Billion) Forecast, By Product Type 2026 to 2036
Figure 229: Mexico After-sun Products Market Value (USD Billion) Projection, By End-user 2021 to 2036
Figure 230: Mexico After-sun Products Market Volume (Tons) Projection, By End-user 2021 to 2036
Figure 231: Mexico After-sun Products Market Incremental Opportunities (USD Billion) Forecast, By End-user 2026 to 2036
Figure 232: Mexico After-sun Products Market Value (USD Billion) Projection, By Distribution Channel 2021 to 2036
Figure 233: Mexico After-sun Products Market Volume (Tons) Projection, By Distribution Channel 2021 to 2036
Figure 234: Mexico After-sun Products Market Incremental Opportunities (USD Billion) Forecast, By Distribution Channel 2026 to 2036
Figure 235: Argentina After-sun Products Market Value (USD Billion) Projection, By Product Type 2021 to 2036
Figure 236: Argentina After-sun Products Market Volume (Tons) Projection, By Product Type 2021 to 2036
Figure 237: Argentina After-sun Products Market Incremental Opportunities (USD Billion) Forecast, By Product Type 2026 to 2036
Figure 238: Argentina After-sun Products Market Value (USD Billion) Projection, By End-user 2021 to 2036
Figure 239: Argentina After-sun Products Market Volume (Tons) Projection, By End-user 2021 to 2036
Figure 240: Argentina After-sun Products Market Incremental Opportunities (USD Billion) Forecast, By End-user 2026 to 2036
Figure 241: Argentina After-sun Products Market Value (USD Billion) Projection, By Distribution Channel 2021 to 2036
Figure 242: Argentina After-sun Products Market Volume (Tons) Projection, By Distribution Channel 2021 to 2036
Figure 243: Argentina After-sun Products Market Incremental Opportunities (USD Billion) Forecast, By Distribution Channel 2026 to 2036
Copyright © Transparency Market Research, Inc. All Rights reserved
Trust Online


After-sun Products Market
