
Analysts’ Viewpoint on Market Scenario
Increase in adoption of power GaN devices in power supply and charging devices is anticipated to fuel the global power GaN devices market in the next few years. Gallium nitride (GaN) is known for its reliability and high-current capabilities. Power GaN devices are anticipated to provide substantial growth opportunities in end-use industries such as consumer electronics, automotive, IT & telecom, and semiconductor & electronics during the forecast period.
Key players in the business are focusing on research and development activities to explore more opportunities in the challenging EV/HEV inverter sector. Market players need to concentrate on economies with limited government regulations by integrating their value chain and expanding the supply chain base.
Gallium nitride (GaN) devices have emerged as high-performance alternatives to silicon-based transistors. GaN possesses significantly higher electric field strength than silicon. Gallium nitride has 3.4 eV bandgap compared to silicon’s 1.12 eV bandgap. Thus, usage of GaN makes power conversion solutions more compact and energy-efficient. Increase in usage of power GaN devices in smartphones, laptops, and monitors to control battery charging and discharging currents is likely to augment the global power GaN devices market share in the next few years.
Request a sample to get extensive insights into the Power GaN Devices Market
GaN devices are widely used in chargers and other power supplies. Various GaN-based chargers are available in the market. GaN devices for power electronics are small in size and offer higher speed and higher energy efficiency than traditional silicon-based devices. Thus, various OEMs producing laptops, PCs, and smartphones have started offering GaN-based chargers due to the increase in demand from customers.
Key market players are developing advanced GaN-based mobile phone chargers and gaining competitive edge. For instance, in August 2022, Navitas Semiconductor announced that its GaN power IC technology had been used by OnePlus, a global mobile-technology company, in its 160 W in-box charger for OnePlus 10R 5G (worldwide) and OnePlus ACE 5G (China model) Android smartphones.
GaN is also ideally suited for applications in amplifiers and power converters in various consumer electronic devices. Its improved capability vis-à-vis other technologies is likely to boost its usage in AI, voice recognition systems, biometrics, and various high-speed applications.
Efficiency achieved in power converters is below 95% in industrial power supplies that use silicon solution. GaN solution offers up to 99% efficiency, thus significantly conserving power as per the industry usage. Furthermore, increase in frequency, rise in power density, growth in bi-directional power flow, and decrease in component count are driving the demand for industrial power supplies using GaN technology.
GaN power semiconductors take up less space on circuit boards and have better thermal properties. This facilitates the manufacture of smaller electronic appliances. Key applications of GaN in consumer electronics devices are power supplies and adaptors for PC, portable electronics, USB chargers, and wireless chargers.
Gallium nitride power transistors or GaN transistors are driving growth and product innovation in the electronics industry, as several manufacturers have realized that silicon has reached its limitations in solving critical power system challenges.
Large amount of data is stored in data centers from around 15 million to 30 million connected devices all over the world. About 10% increase in data center expansion is expected over the next year. Thus, the need to change data center economics through power supply design has increased.
GaN is steadily replacing silicon in power devices of all shapes and sizes in data center infrastructure including servers, power distribution, and UPS. Power GaN devices offer more computing power per rack footprint, thus resulting in increased revenue. GaN transistors are more efficient than silicon-based super-junction devices in data center power supply and telecom switching rack applications. Therefore, suppliers and system users are increasingly opting for GaN devices for better performance and operational benefits. This is leading to significant market development.
Increase in number of internet users has fueled the demand for data center services, thus raising concerns about data center energy usage. Hence, there is a need for improved energy efficiency in next-generation computing, storage, and cooling technologies. Low resistance and capacitance of GaN results in greater power conversion efficiency, thus supplying more power for data center workloads. High-speed frequency switching of GaN reduces the size and weight of energy-storing passive components.
Reducing energy consumption is a major goal for telecom infrastructure, and the primary advantage of GaN is its higher power density. Usage of GaN in multi-chip modules increases lineup efficiency to 50% and reduces size and weight of radio units. This helps mobile network operators lower the cost of deploying 5G on cellular towers and rooftops.
GaN is used in power amplifiers, antenna modules, RF radios, MIMO systems, base transceiver station (BTS), and many other applications for 5G infrastructure. According to the China Academy of Information and Communications Technology (CAICT), the Government of China plans to invest more than US$ 170 Bn in 5G infrastructure projects by 2025. Thus, rise in investment in 5G infrastructure is likely to augment market statistics in the next few years.
Request a custom report on Power GaN Devices Market
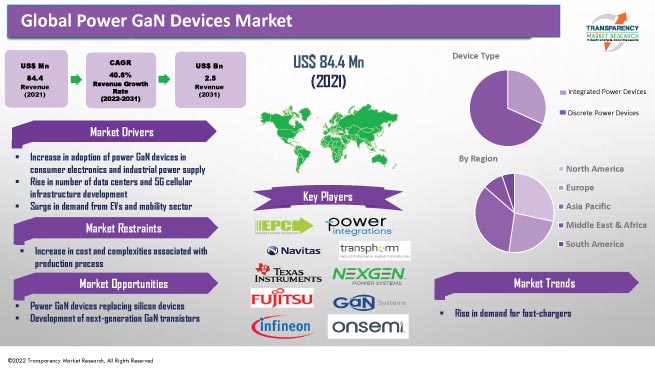
Power GaN devices can be bifurcated into two types: integrated power devices and discrete power devices. The discrete power devices segment held prominent share of nearly 68.3% in 2021. Rise in adoption of discrete power devices in consumer electronics and power supplies devices is estimated to augment the segment growth during the forecast period.
GaN discrete components can withstand higher temperatures. Their wide band gap increases electron mobility, thus offering high switching speed and higher voltages. GaN semiconductor technology has the intrinsic ability to integrate multiple devices with a single substrate. Development of technology such as GaN-on-Si has accelerated the market size for integrated power devices using GaN.
Based on voltage, the global power GaN devices market has been classified into below 200V, 200-600V, and above 600V. According to the market forecast, the below 200V segment is likely to witness rapid growth in the next few years in terms of voltage. It held 45.8% share of the global market in 2021. Major applications of this voltage range include power supplies, power amplifiers, and chargers.
200V - 600V GaN and below 200V devices are used in the currently available inverters and power supplies with high operating efficiencies. Some devices that would exhibit high-speed switching under high-current/voltage switching conditions are under development.
In terms of value, Asia Pacific dominated the global market with 34.1% share in 2021. China and Japan are projected to exhibit the highest CAGR in the region during the forecast period. China has announced a number of initiatives aimed at advancing its domestic semiconductor industry, including a new and massive fab expansion campaign in the foundry, gallium-nitride (GaN), and silicon carbide (SiC) markets.
North America and Europe held 28.4% and 23.9% share, respectively, of the global market in 2021. Increase in research and development activities in the U.S. and government initiatives for the growth of the semiconductor sector are likely to fuel market expansion in North America in the near future. Some of the key players are expanding their business in North America. VisIC Technologies and KYOCERA AVX Salzburg announced their collaboration in October 2022. The partners are combining their strength in packaging, assembly, and GaN wafer technologies in order to provide high-current components for high-voltage applications such as charging and e-drivetrain.
The global power GaN devices market is consolidated, with a small number of large-scale vendors controlling majority of the share. Most of the companies are investing significantly in comprehensive research and development activities for new product development. Expansion of product portfolios and mergers and acquisitions are key strategies adopted by prominent market players.
Efficient Power Conversion Corporation, Inc., Fujitsu limited, GaN Power Inc., GaN Systems, Infineon Technologies, Navitas Semiconductor, NexGen Power Systems, On Semiconductors, Panasonic Corporation, Power Integrations, Inc., ROHM CO., LTD., SOITEC, Texas Instruments Incorporated, Transphorm Inc., and VisIC Technologies are the leading market entities.
Each of these players has been profiled in the power GaN devices market report based on parameters such as company overview, financial overview, business strategies, product portfolio, business segments, and recent developments.
|
Attribute |
Detail |
|
Market Size Value in 2021 |
US$ 84.4 Mn |
|
Market Forecast Value in 2031 |
US$ 2.5 Bn |
|
Growth Rate (CAGR) |
40.6% |
|
Forecast Period |
2022–2031 |
|
Historical Data Available for |
2017–2020 |
|
Quantitative Units |
US$ Mn/Bn for Value and Million Units for Volume |
|
Market Analysis |
It includes cross segment analysis at global as well as regional level. Furthermore, qualitative analysis includes drivers, restraints, opportunities, key trends, Porter’s Five Forces analysis, value chain analysis, and key trend analysis. |
|
Competition Landscape |
|
|
Format |
Electronic (PDF) + Excel |
|
Market Segmentation |
|
|
Regions Covered |
|
|
Countries Covered |
|
|
Companies Profiled |
|
|
Customization Scope |
Available upon request |
|
Pricing |
Available upon request |
The market stood at US$ 84.4 Mn in 2021
The industry is expected to advance at a CAGR of 40.6% from 2022 to 2031
Increase in adoption of GaN devices in consumer electronics and industrial power supply industry; rise in number of data centers; 5G cellular infrastructure development, and surge in demand from EVs and mobility sector
Semiconductor & electronics was the largest end-use industry segment that held 46.5% share in 2021
Asia Pacific is a more attractive region for vendors in the global market
Efficient Power Conversion Corporation, Inc., Fujitsu limited, GaN Power Inc., GaN Systems, Infineon Technologies, Navitas Semiconductor, NexGen Power Systems, On Semiconductors, Panasonic Corporation, Power Integrations, Inc., ROHM CO., LTD., SOITEC, Texas Instruments Incorporated, Transphorm Inc., and VisIC Technologies
1. Preface
1.1. Market Introduction
1.2. Market and Segments Definition
1.3. Market Taxonomy
1.4. Research Methodology
1.5. Assumption and Acronyms
2. Executive Summary
2.1. Global Power GaN Devices Market Overview
2.2. Regional Outline
2.3. Industry Outline
2.4. Market Dynamics Snapshot
2.5. Competition Blueprint
3. Market Dynamics
3.1. Macro-economic Factors
3.2. Drivers
3.3. Restraints
3.4. Opportunities
3.5. Key Trends
3.6. Regulatory Scenario
4. Associated Industry and Key Indicator Assessment
4.1. Parent Industry Overview – Power Devices Industry Overview
4.2. Supply Chain Analysis
4.3. Pricing Analysis
4.4. Technology Roadmap Analysis
4.5. Industry SWOT Analysis
4.6. Porter Five Forces Analysis
4.7. Covid-19 Impact and Recovery Analysis
5. Power GaN Devices Market Analysis by Device Type
5.1. Power GaN Devices Market Size (US$ Mn) and Volume (Million Units) Analysis & Forecast, by Device Type, 2017–2031
5.1.1. Integrated Power Devices
5.1.2. Discrete Power Devices
5.2. Market Attractiveness Analysis, by Device Type
6. Power GaN Devices Market Analysis by Voltage
6.1. Power GaN Devices Market Size (US$ Mn) and Volume (Million Units) Analysis & Forecast, by Voltage, 2017–2031
6.1.1. Below 200V
6.1.2. 200-600V
6.1.3. Above 600V
6.2. Market Attractiveness Analysis, by Voltage
7. Power GaN Devices Market Analysis by End-use Industry
7.1. Power GaN Devices Market Size (US$ Mn) Analysis & Forecast, by End-use Industry, 2017–2031
7.1.1. IT & Telecommunication
7.1.2. Automotive
7.1.3. Semiconductor & Electronics
7.1.4. Industrial
7.1.5. Aerospace & Defense
7.1.6. Others
7.2. Market Attractiveness Analysis, by End-use Industry
8. Power GaN Devices Market Analysis and Forecast, by Region
8.1. Power GaN Devices Market Size (US$ Mn) and Volume (Million Units) Analysis & Forecast, by Region, 2017–2031
8.1.1. North America
8.1.2. Europe
8.1.3. Asia Pacific
8.1.4. Middle East & Africa
8.1.5. South America
8.2. Market Attractiveness Analysis, by Region
9. North America Power GaN Devices Market Analysis and Forecast
9.1. Market Snapshot
9.2. Drivers and Restraints: Impact Analysis
9.3. Power GaN Devices Market Size (US$ Mn) and Volume (Million Units) Analysis & Forecast, by Device Type, 2017–2031
9.3.1. Integrated Power Devices
9.3.2. Discrete Power Devices
9.4. Power GaN Devices Market Size (US$ Mn) and Volume (Million Units) Analysis & Forecast, by Voltage, 2017–2031
9.4.1. Below 200V
9.4.2. 200-600V
9.4.3. Above 600V
9.5. Power GaN Devices Market Size (US$ Mn) Analysis & Forecast, by End-use Industry, 2017–2031
9.5.1. IT & Telecommunication
9.5.2. Automotive
9.5.3. Semiconductor & Electronics
9.5.4. Industrial
9.5.5. Aerospace & Defense
9.5.6. Others
9.6. Power GaN Devices Market Size (US$ Mn) and Volume (Million Units) Analysis & Forecast, by Country and Sub-region, 2017–2031
9.6.1. The U.S.
9.6.2. Canada
9.6.3. Rest of North America
9.7. Market Attractiveness Analysis
9.7.1. by Device Type
9.7.2. by Voltage
9.7.3. by End-use Industry
9.7.4. by Country/Sub-region
10. Europe Power GaN Devices Market Analysis and Forecast
10.1. Market Snapshot
10.2. Drivers and Restraints: Impact Analysis
10.3. Power GaN Devices Market Size (US$ Mn) and Volume (Million Units) Analysis & Forecast, by Device Type, 2017–2031
10.3.1. Integrated Power Devices
10.3.2. Discrete Power Devices
10.4. Power GaN Devices Market Size (US$ Mn) and Volume (Million Units) Analysis & Forecast, by Voltage, 2017–2031
10.4.1. Below 200V
10.4.2. 200-600V
10.4.3. Above 600V
10.5. Power GaN Devices Market Size (US$ Mn) Analysis & Forecast, by End-use Industry, 2017–2031
10.5.1. IT & Telecommunication
10.5.2. Automotive
10.5.3. Semiconductor & Electronics
10.5.4. Industrial
10.5.5. Aerospace & Defense
10.5.6. Others
10.6. Power GaN Devices Market Size (US$ Mn) and Volume (Million Units) Analysis & Forecast, by Country and Sub-region, 2017–2031
10.6.1. The U.K.
10.6.2. Germany
10.6.3. France
10.6.4. Rest of Europe
10.7. Market Attractiveness Analysis
10.7.1. by Device Type
10.7.2. by Voltage
10.7.3. by End-use Industry
10.7.4. by Country/Sub-region
11. Asia Pacific Power GaN Devices Market Analysis and Forecast
11.1. Market Snapshot
11.2. Drivers and Restraints: Impact Analysis
11.3. Power GaN Devices Market Size (US$ Mn) and Volume (Million Units) Analysis & Forecast, by Device Type, 2017–2031
11.3.1. Integrated Power Devices
11.3.2. Discrete Power Devices
11.4. Power GaN Devices Market Size (US$ Mn) and Volume (Million Units) Analysis & Forecast, by Voltage, 2017–2031
11.4.1. Below 200V
11.4.2. 200-600V
11.4.3. Above 600V
11.5. Power GaN Devices Market Size (US$ Mn) Analysis & Forecast, by End-use Industry, 2017–2031
11.5.1. IT & Telecommunication
11.5.2. Automotive
11.5.3. Semiconductor & Electronics
11.5.4. Industrial
11.5.5. Aerospace & Defense
11.5.6. Others
11.6. Power GaN Devices Market Size (US$ Mn) and Volume (Million Units) Analysis & Forecast, by Country and Sub-region, 2017–2031
11.6.1. China
11.6.2. Japan
11.6.3. India
11.6.4. South Korea
11.6.5. ASEAN
11.6.6. Rest of Asia Pacific
11.7. Market Attractiveness Analysis
11.7.1. by Device Type
11.7.2. by Voltage
11.7.3. by End-use Industry
11.7.4. by Country/Sub-region
12. Middle East and Africa Power GaN Devices Market Analysis and Forecast
12.1. Market Snapshot
12.2. Drivers and Restraints: Impact Analysis
12.3. Power GaN Devices Market Size (US$ Mn) and Volume (Million Units) Analysis & Forecast, by Device Type, 2017–2031
12.3.1. Integrated Power Devices
12.3.2. Discrete Power Devices
12.4. Power GaN Devices Market Size (US$ Mn) and Volume (Million Units) Analysis & Forecast, by Voltage, 2017–2031
12.4.1. Below 200V
12.4.2. 200-600V
12.4.3. Above 600V
12.5. Power GaN Devices Market Size (US$ Mn) Analysis & Forecast, by End-use Industry, 2017–2031
12.5.1. IT & Telecommunication
12.5.2. Automotive
12.5.3. Semiconductor & Electronics
12.5.4. Industrial
12.5.5. Aerospace & Defense
12.5.6. Others
12.6. Power GaN Devices Market Size (US$ Mn) and Volume (Million Units) Analysis & Forecast, by Country and Sub-region, 2017–2031
12.6.1. GCC
12.6.2. South Africa
12.6.3. Rest of Middle East and Africa
12.7. Market Attractiveness Analysis
12.7.1. by Device Type
12.7.2. by Voltage
12.7.3. by End-use Industry
12.7.4. by Country/Sub-region
13. South America Power GaN Devices Market Analysis and Forecast
13.1. Market Snapshot
13.2. Drivers and Restraints: Impact Analysis
13.3. Power GaN Devices Market Size (US$ Mn) and Volume (Million Units) Analysis & Forecast, by Device Type, 2017–2031
13.3.1. Integrated Power Devices
13.3.2. Discrete Power Devices
13.4. Power GaN Devices Market Size (US$ Mn) and Volume (Million Units) Analysis & Forecast, by Voltage, 2017–2031
13.4.1. Below 200V
13.4.2. 200-600V
13.4.3. Above 600V
13.5. Power GaN Devices Market Size (US$ Mn) Analysis & Forecast, by End-use Industry, 2017–2031
13.5.1. IT & Telecommunication
13.5.2. Automotive
13.5.3. Semiconductor & Electronics
13.5.4. Industrial
13.5.5. Aerospace & Defense
13.5.6. Others
13.6. Power GaN Devices Market Size (US$ Mn) and Volume (Million Units) Analysis & Forecast, by Country and Sub-region, 2017–2031
13.6.1. Brazil
13.6.2. Rest of South America
13.7. Market Attractiveness Analysis
13.7.1. by Device Type
13.7.2. by Voltage
13.7.3. by End-use Industry
13.7.4. by Country/Sub-region
14. Competition Assessment
14.1. Global Power GaN Devices Market Competition Matrix - a Dashboard View
14.1.1. Global Power GaN Devices Market Company Share Analysis, by Value (2021)
14.1.2. Technological Differentiator
15. Company Profiles (Global Manufacturers/Suppliers)
15.1. Efficient Power Conversion Corporation, Inc.
15.1.1. Overview
15.1.2. Product Portfolio
15.1.3. Sales Footprint
15.1.4. Key Subsidiaries or Distributors
15.1.5. Strategy and Recent Developments
15.1.6. Key Financials
15.2. SOITEC
15.2.1. Overview
15.2.2. Product Portfolio
15.2.3. Sales Footprint
15.2.4. Key Subsidiaries or Distributors
15.2.5. Strategy and Recent Developments
15.2.6. Key Financials
15.3. Fujitsu limited
15.3.1. Overview
15.3.2. Product Portfolio
15.3.3. Sales Footprint
15.3.4. Key Subsidiaries or Distributors
15.3.5. Strategy and Recent Developments
15.3.6. Key Financials
15.4. GaN Power Inc.
15.4.1. Overview
15.4.2. Product Portfolio
15.4.3. Sales Footprint
15.4.4. Key Subsidiaries or Distributors
15.4.5. Strategy and Recent Developments
15.4.6. Key Financials
15.5. GaN Systems
15.5.1. Overview
15.5.2. Product Portfolio
15.5.3. Sales Footprint
15.5.4. Key Subsidiaries or Distributors
15.5.5. Strategy and Recent Developments
15.5.6. Key Financials
15.6. Infineon Technologies
15.6.1. Overview
15.6.2. Product Portfolio
15.6.3. Sales Footprint
15.6.4. Key Subsidiaries or Distributors
15.6.5. Strategy and Recent Developments
15.6.6. Key Financials
15.7. Navitas Semiconductor
15.7.1. Overview
15.7.2. Product Portfolio
15.7.3. Sales Footprint
15.7.4. Key Subsidiaries or Distributors
15.7.5. Strategy and Recent Developments
15.7.6. Key Financials
15.8. NexGen Power Systems
15.8.1. Overview
15.8.2. Product Portfolio
15.8.3. Sales Footprint
15.8.4. Key Subsidiaries or Distributors
15.8.5. Strategy and Recent Developments
15.8.6. Key Financials
15.9. On Semiconductors
15.9.1. Overview
15.9.2. Product Portfolio
15.9.3. Sales Footprint
15.9.4. Key Subsidiaries or Distributors
15.9.5. Strategy and Recent Developments
15.9.6. Key Financials
15.10. Panasonic Corporation
15.10.1. Overview
15.10.2. Product Portfolio
15.10.3. Sales Footprint
15.10.4. Key Subsidiaries or Distributors
15.10.5. Strategy and Recent Developments
15.10.6. Key Financials
15.11. ROHM CO., LTD.
15.11.1. Overview
15.11.2. Product Portfolio
15.11.3. Sales Footprint
15.11.4. Key Subsidiaries or Distributors
15.11.5. Strategy and Recent Developments
15.11.6. Key Financials
15.12. Texas Instruments Incorporated
15.12.1. Overview
15.12.2. Product Portfolio
15.12.3. Sales Footprint
15.12.4. Key Subsidiaries or Distributors
15.12.5. Strategy and Recent Developments
15.12.6. Key Financials
15.13. Transphorm Inc.
15.13.1. Overview
15.13.2. Product Portfolio
15.13.3. Sales Footprint
15.13.4. Key Subsidiaries or Distributors
15.13.5. Strategy and Recent Developments
15.13.6. Key Financials
15.14. VisIC Technologies
15.14.1. Overview
15.14.2. Product Portfolio
15.14.3. Sales Footprint
15.14.4. Key Subsidiaries or Distributors
15.14.5. Strategy and Recent Developments
15.14.6. Key Financials
15.15. Power Integrations, Inc.
15.15.1. Overview
15.15.2. Product Portfolio
15.15.3. Sales Footprint
15.15.4. Key Subsidiaries or Distributors
15.15.5. Strategy and Recent Developments
15.15.6. Key Financials
16. Recommendation
16.1. Opportunity Assessment
16.1.1. by Device Type
16.1.2. by Voltage
16.1.3. by End-use Industry
16.1.4. by Region
List of Tables
Table 01: Global Power GaN Devices Market Size & Forecast, by Device Type, Value (US$ Mn), 2017-2031
Table 02: Global Power GaN Devices Market Size & Forecast, by Device Type, Volume (Million Units), 2017-2031
Table 03: Global Power GaN Devices Market Size & Forecast, by Voltage, Value (US$ Mn), 2017-2031
Table 04: Global Power GaN Devices Market Size & Forecast, by Voltage, Volume (Million Units), 2017-2031
Table 05: Global Power GaN Devices Market Size & Forecast, by End-use, Value (US$ Mn), 2017-2031
Table 06: Global Power GaN Devices Market Size & Forecast, by Region, Value (US$ Mn), 2017-2031
Table 07: Global Power GaN Devices Market Size & Forecast, by Region, Volume (Million Units), 2017-2031
Table 08: North America Power GaN Devices Market Size & Forecast, by Device Type, Value (US$ Mn), 2017-2031
Table 09: North America Power GaN Devices Market Size & Forecast, by Device Type, Volume (Million Units), 2017-2031
Table 10: North America Power GaN Devices Market Size & Forecast, by Voltage, Value (US$ Mn), 2017-2031
Table 11: North America Power GaN Devices Market Size & Forecast, by Voltage, Volume (Million Units), 2017-2031
Table 12: North America Power GaN Devices Market Size & Forecast, by End-use, Value (US$ Mn), 2017-2031
Table 13: North America Power GaN Devices Market Size & Forecast, by Country, Value (US$ Mn), 2017-2031
Table 14: North America Power GaN Devices Market Size & Forecast, by Country, Volume (Million Units), 2017-2031
Table 15: Europe Power GaN Devices Market Size & Forecast, by Device Type, Value (US$ Mn), 2017-2031
Table 16: Europe Power GaN Devices Market Size & Forecast, by Device Type, Volume (Million Units), 2017-2031
Table 17: Europe Power GaN Devices Market Size & Forecast, by Voltage, Value (US$ Mn), 2017-2031
Table 18: Europe Power GaN Devices Market Size & Forecast, by Voltage, Volume (Million Units), 2017-2031
Table 19: Europe Power GaN Devices Market Size & Forecast, by End-use, Value (US$ Mn), 2017-2031
Table 20: Europe Power GaN Devices Market Size & Forecast, by Country, Value (US$ Mn), 2017-2031
Table 21: Europe Power GaN Devices Market Size & Forecast, by Country, Volume (Million Units), 2017-2031
Table 22: Asia Pacific Power GaN Devices Market Size & Forecast, by Device Type, Value (US$ Mn), 2017-2031
Table 23: Asia Pacific Power GaN Devices Market Size & Forecast, by Device Type, Volume (Million Units), 2017-2031
Table 24: Asia Pacific Power GaN Devices Market Size & Forecast, by Voltage, Value (US$ Mn), 2017-2031
Table 25: Asia Pacific Power GaN Devices Market Size & Forecast, by Voltage, Volume (Million Units), 2017-2031
Table 26: Asia Pacific Power GaN Devices Market Size & Forecast, by End-use, Value (US$ Mn), 2017-2031
Table 27: Asia Pacific Power GaN Devices Market Size & Forecast, by Country, Value (US$ Mn), 2017-2031
Table 28: Asia Pacific Power GaN Devices Market Size & Forecast, by Country, Volume (Million Units), 2017-2031
Table 29: Middle East & Africa Power GaN Devices Market Size & Forecast, by Device Type, Value (US$ Mn), 2017-2031
Table 30: Middle East & Africa Power GaN Devices Market Size & Forecast, by Device Type, Volume (Million Units), 2017-2031
Table 31: Middle East & Africa Power GaN Devices Market Size & Forecast, by Voltage, Value (US$ Mn), 2017-2031
Table 32: Middle East & Africa Power GaN Devices Market Size & Forecast, by Voltage, Volume (Million Units), 2017-2031
Table 33: Middle East & Africa Power GaN Devices Market Size & Forecast, by End-use, Value (US$ Mn), 2017-2031
Table 34: Middle East & Africa Power GaN Devices Market Size & Forecast, by Country, Value (US$ Mn), 2017-2031
Table 35: Middle East & Africa Power GaN Devices Market Size & Forecast, by Country, Volume (Million Units), 2017-2031
Table 36: South America Power GaN Devices Market Size & Forecast, by Device Type, Value (US$ Mn), 2017-2031
Table 37: South America Power GaN Devices Market Size & Forecast, by Device Type, Volume (Million Units), 2017-2031
Table 38: South America Power GaN Devices Market Size & Forecast, by Voltage, Value (US$ Mn), 2017-2031
Table 39: South America Power GaN Devices Market Size & Forecast, by Voltage, Volume (Million Units), 2017-2031
Table 40: South America Power GaN Devices Market Size & Forecast, by End-use, Value (US$ Mn), 2017-2031
Table 41: South America Power GaN Devices Market Size & Forecast, by Country, Value (US$ Mn), 2017-2031
Table 42: South America Power GaN Devices Market Size & Forecast, by Country, Volume (Million Units), 2017-2031
List of Figures
Figure 01: Global Power GaN Devices Market Share Analysis, by Region
Figure 02: Global Power GaN Devices Price Trend Analysis (Average Price, US$)
Figure 03: Global Power GaN Devices Market, Value (US$ Mn), 2017-2031
Figure 04: Global Power GaN Devices Market, Volume (Million Units), 2017-2031
Figure 05: Global Power GaN Devices Market Size & Forecast, by Device Type, Revenue (US$ Mn), 2017-2031
Figure 06: Global Power GaN Devices Market Attractiveness, by Device Type, Value (US$ Mn), 2022-2031
Figure 07: Global Power GaN Devices Market Size & Forecast, by Device Type, Value (US$ Mn), 2022-2031
Figure 08: Global Power GaN Devices Market Size & Forecast, by Voltage, Revenue (US$ Mn), 2017-2031
Figure 09: Global Power GaN Devices Market Attractiveness, by Voltage, Value (US$ Mn), 2022-2031
Figure 10: Global Power GaN Devices Market Size & Forecast, by Voltage, Value (US$ Mn), 2022-2031
Figure 11: Global Power GaN Devices Market Size & Forecast, by End-use Industry, Revenue (US$ Mn), 2017-2031
Figure 12: Global Power GaN Devices Market Attractiveness, by End-use Industry, Value (US$ Mn), 2022-2031
Figure 13: Global Power GaN Devices Market Size & Forecast, by End-use Industry, Value (US$ Mn), 2022-2031
Figure 14: Global Power GaN Devices Market Size & Forecast, by Region, Revenue (US$ Mn), 2017-2031
Figure 15: Global Power GaN Devices Market Attractiveness, by Region, Value (US$ Mn), 2022-2031
Figure 16: Global Power GaN Devices Market Size & Forecast, by Region, Value (US$ Mn), 2022-2031
Figure 17: North America Power GaN Devices Market, Value (US$ Mn), 2017-2031
Figure 18: North America Power GaN Devices Market, Volume (Million Units), 2017-2031
Figure 19: North America Power GaN Devices Market Size & Forecast, by Device Type, Revenue (US$ Mn), 2017-2031
Figure 20: North America Power GaN Devices Market Attractiveness, by Device Type, Value (US$ Mn), 2022-2031
Figure 21: North America Power GaN Devices Market Size & Forecast, by Device Type, Value (US$ Mn), 2022-2031
Figure 22: North America Power GaN Devices Market Size & Forecast, by Voltage, Revenue (US$ Mn), 2017-2031
Figure 23: North America Power GaN Devices Market Attractiveness, by Voltage, Value (US$ Mn), 2022-2031
Figure 24: North America Power GaN Devices Market Size & Forecast, by Voltage, Value (US$ Mn), 2022-2031
Figure 25: North America Power GaN Devices Market Size & Forecast, by End-use Industry, Revenue (US$ Mn), 2017-2031
Figure 26: North America Power GaN Devices Market Attractiveness, by End-use Industry, Value (US$ Mn), 2022-2031
Figure 27: North America Power GaN Devices Market Size & Forecast, by End-use Industry, Value (US$ Mn), 2022-2031
Figure 28: North America Power GaN Devices Market Size & Forecast, by Country, Revenue (US$ Mn), 2017-2031
Figure 29: North America Power GaN Devices Market Attractiveness, by Country, Value (US$ Mn), 2022-2031
Figure 30: North America Power GaN Devices Market Size & Forecast, by Country, Value (US$ Mn), 2022-2031
Figure 31: Europe Power GaN Devices Market, Value (US$ Mn), 2017-2031
Figure 32: Europe Power GaN Devices Market, Volume (Million Units), 2017-2031
Figure 33: Europe Power GaN Devices Market Size & Forecast, by Device Type, Revenue (US$ Mn), 2017-2031
Figure 34: Europe Power GaN Devices Market Attractiveness, by Device Type, Value (US$ Mn), 2022-2031
Figure 35: Europe Power GaN Devices Market Size & Forecast, by Device Type, Value (US$ Mn), 2022-2031
Figure 36: Europe Power GaN Devices Market Size & Forecast, by Voltage, Revenue (US$ Mn), 2017-2031
Figure 37: Europe Power GaN Devices Market Attractiveness, by Voltage, Value (US$ Mn), 2022-2031
Figure 38: Europe Power GaN Devices Market Size & Forecast, by Voltage, Value (US$ Mn), 2022-2031
Figure 39: Europe Power GaN Devices Market Size & Forecast, by End-use Industry, Revenue (US$ Mn), 2017-2031
Figure 40: Europe Power GaN Devices Market Attractiveness, by End-use Industry, Value (US$ Mn), 2022-2031
Figure 41: Europe Power GaN Devices Market Size & Forecast, by End-use Industry, Value (US$ Mn), 2022-2031
Figure 42: Europe Power GaN Devices Market Size & Forecast, by Country, Revenue (US$ Mn), 2017-2031
Figure 43: Europe Power GaN Devices Market Attractiveness, by Country, Value (US$ Mn), 2022-2031
Figure 44: Europe Power GaN Devices Market Size & Forecast, by Country, Value (US$ Mn), 2022-2031
Figure 45: Asia Pacific Power GaN Devices Market, Value (US$ Mn), 2017-2031
Figure 46: Asia Pacific Power GaN Devices Market, Volume (Million Units), 2017-2031
Figure 47: Asia Pacific Power GaN Devices Market Size & Forecast, by Device Type, Revenue (US$ Mn), 2017-2031
Figure 48: Asia Pacific Power GaN Devices Market Attractiveness, by Device Type, Value (US$ Mn), 2022-2031
Figure 49: Asia Pacific Power GaN Devices Market Size & Forecast, by Device Type, Value (US$ Mn), 2022-2031
Figure 50: Asia Pacific Power GaN Devices Market Size & Forecast, by Voltage, Revenue (US$ Mn), 2017-2031
Figure 51: Asia Pacific Power GaN Devices Market Attractiveness, by Voltage, Value (US$ Mn), 2022-2031
Figure 52: Asia Pacific Power GaN Devices Market Size & Forecast, by Voltage, Value (US$ Mn), 2022-2031
Figure 53: Asia Pacific Power GaN Devices Market Size & Forecast, by End-use Industry, Revenue (US$ Mn), 2017-2031
Figure 54: Asia Pacific Power GaN Devices Market Attractiveness, by End-use Industry, Value (US$ Mn), 2022-2031
Figure 55: Asia Pacific Power GaN Devices Market Size & Forecast, by End-use Industry, Value (US$ Mn), 2022-2031
Figure 56: Asia Pacific Power GaN Devices Market Size & Forecast, by Country, Revenue (US$ Mn), 2017-2031
Figure 57: Asia Pacific Power GaN Devices Market Attractiveness, by Country, Value (US$ Mn), 2022-2031
Figure 58: Asia Pacific Power GaN Devices Market Size & Forecast, by Country, Value (US$ Mn), 2022-2031
Figure 59: Middle East & Africa Power GaN Devices Market, Value (US$ Mn), 2017-2031
Figure 60: Middle East & Africa Power GaN Devices Market, Volume (Million Units), 2017-2031
Figure 61: Middle East & Africa Power GaN Devices Market Size & Forecast, by Device Type, Revenue (US$ Mn), 2017-2031
Figure 62: Middle East & Africa Power GaN Devices Market Attractiveness, by Device Type, Value (US$ Mn), 2022-2031
Figure 63: Middle East & Africa Power GaN Devices Market Size & Forecast, by Device Type, Value (US$ Mn), 2022-2031
Figure 64: Middle East & Africa Power GaN Devices Market Size & Forecast, by Voltage, Revenue (US$ Mn), 2017-2031
Figure 65: Middle East & Africa Power GaN Devices Market Attractiveness, by Voltage, Value (US$ Mn), 2022-2031
Figure 66: Middle East & Africa Power GaN Devices Market Size & Forecast, by Voltage, Value (US$ Mn), 2022-2031
Figure 67: Middle East & Africa Power GaN Devices Market Size & Forecast, by End-use Industry, Revenue (US$ Mn), 2017-2031
Figure 68: Middle East & Africa Power GaN Devices Market Attractiveness, by End-use Industry, Value (US$ Mn), 2022-2031
Figure 69: Middle East & Africa Power GaN Devices Market Size & Forecast, by End-use Industry, Value (US$ Mn), 2022-2031
Figure 70: Middle East & Africa Power GaN Devices Market Size & Forecast, by Country, Revenue (US$ Mn), 2017-2031
Figure 71: Middle East & Africa Power GaN Devices Market Attractiveness, by Country, Value (US$ Mn), 2022-2031
Figure 72: Middle East & Africa Power GaN Devices Market Size & Forecast, by Country, Value (US$ Mn), 2022-2031
Figure 73: South America Power GaN Devices Market, Value (US$ Mn), 2017-2031
Figure 74: South America Power GaN Devices Market, Volume (Million Units), 2017-2031
Figure 75: South America Power GaN Devices Market Size & Forecast, by Device Type, Revenue (US$ Mn), 2017-2031
Figure 76: South America Power GaN Devices Market Attractiveness, by Device Type, Value (US$ Mn), 2022-2031
Figure 77: South America Power GaN Devices Market Size & Forecast, by Device Type, Value (US$ Mn), 2022-2031
Figure 78: South America Power GaN Devices Market Size & Forecast, by Voltage, Revenue (US$ Mn), 2017-2031
Figure 79: South America Power GaN Devices Market Attractiveness, by Voltage, Value (US$ Mn), 2022-2031
Figure 80: South America Power GaN Devices Market Size & Forecast, by Voltage, Value (US$ Mn), 2022-2031
Figure 81: South America Power GaN Devices Market Size & Forecast, by End-use Industry, Revenue (US$ Mn), 2017-2031
Figure 82: South America Power GaN Devices Market Attractiveness, by End-use Industry, Value (US$ Mn), 2022-2031
Figure 83: South America Power GaN Devices Market Size & Forecast, by End-use Industry, Value (US$ Mn), 2022-2031
Figure 84: South America Power GaN Devices Market Size & Forecast, by Country, Revenue (US$ Mn), 2017-2031
Figure 85: South America Power GaN Devices Market Attractiveness, by Country, Value (US$ Mn), 2022-2031
Figure 86: South America Power GaN Devices Market Size & Forecast, by Country, Value (US$ Mn), 2022-2031
Figure 87: Global Power GaN Devices Market Share Analysis, by Company
Copyright © Transparency Market Research, Inc. All Rights reserved
Trust Online


Power GaN Devices Market