
Reports
Reports
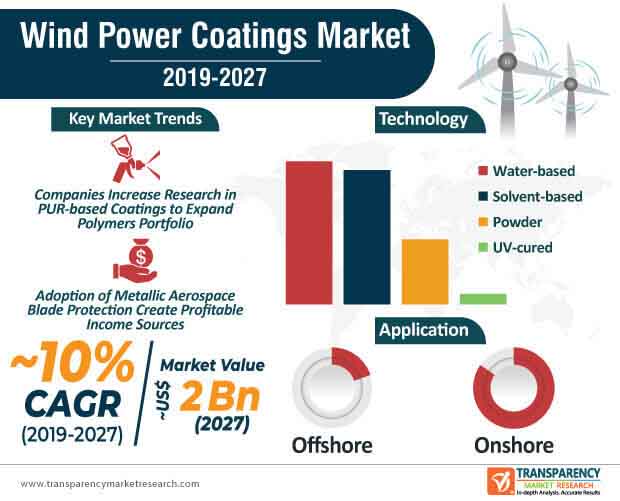
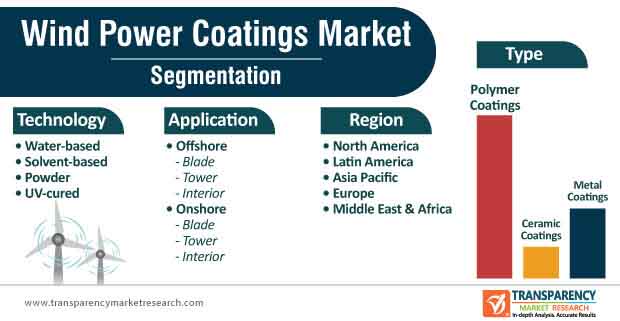
Growing atrocities of unpredictable weather conditions have triggered the demand for efficacious wind power coatings. Manufacturing companies are aiming to expand their product portfolio of polymer coatings for wind towers and blades that are witnessing an increase in demand. As such, the polymer coatings type segment dominates the wind power coatings market, in terms of value and volume, and is estimated to reach a volume of ~178,200 kilo liters by the end of 2022. Hence, manufacturers are innovating in new polymer coatings. For instance, German supplier of high-tech polymer materials Convestro, has gained expertise in PUR (Polyurethanes)-based topcoats that offer lasting corrosion protection for wind towers.
Companies in the market for wind power coatings are increasing their research activities to develop high-performance wind energy coatings. They are adding value to polymer coatings by offering exceptional gloss and color retention attributes in coatings. Furthermore, companies in the wind power coatings market are increasing production capacities to manufacture PUR-based coatings to provide lasting mechanical performance and protection from abrasion for smooth functionality of turbine blades. Companies are helping stakeholders in onshore and offshore segments to achieve high productivity by increasing the availability of low-VOC content coatings.
Companies in the wind power coatings market are boosting their credibility credentials by developing greener corrosion protection coatings. Apart from gaining stability in polymer-based coatings, manufacturers are increasing efforts to gain trust and reliability in the global market landscape by developing eco-friendly coatings. This goal is being achieved with the help of graphene additives.
Exceptional mechanical strength and thermal conductive properties of graphene are gaining increased popularity in the market for wind power coatings. Hence, manufacturers are combining the properties of graphene with solvent- and water-based coatings to develop eco-friendly coatings. As such, the water-based technology segment accounts for the highest revenue in the wind power coatings market. This segment is expected to reach a value of ~US$ 800 Mn by 2027.
Moreover, manufacturers are increasing production capabilities to develop water-based coatings to address the growing concerns of corrosion in onshore and offshore applications. Companies are experimenting by combining graphene with other corrosion-protection pigments to offer anti-corrosion function in coatings.
High industry standards in the European wind power coatings market are giving rise to efficient coating systems. There is a growing demand for advanced coatings that improve operational life of wind turbines. Hence, manufacturers in the wind power coatings market are increasing the availability of protective coatings and gel coatings for blades of wind power plants. As such, the onshore blade application segment of the wind power coatings market is estimated to reach an output of ~66,000 kilo liters by 2027. Hence, manufacturers are increasing efforts to meet productivity and long-lasting performance without the need for maintenance requirements of end users.
Companies in the wind power coatings market are gaining efficacy in waterborne topcoats that provide low solvent emissions. They are tapping into opportunities in coatings for rotor blades to offer leading-edge protection.
Innovations in offshore application are contributing to the exponential growth of the market, even though onshore application dominates the wind power coatings market in terms of volume and value. Companies are adopting new approaches such as using the aerospace technology to develop leading-edge protection systems. These novel coatings are being increasingly used for offshore wind turbines. Continuous product developments in the wind power coatings market are helping stakeholders in the offshore segment to achieve cost-efficiency. Cost-efficiency is being achieved through advanced coating systems that eliminate the need for intervention due to rain erosion. Thus, improved coatings are paving the way for lighter wind turbine blades.
On the other hand, new product offerings for onshore applications are helping manufacturers in the wind power coatings market to accomplish business stability. As such, the onshore application segment accounts for ~97% of the wind power coatings market share. However, there is a need for better products to address erosion due to rain. Hence, companies in the wind power coatings market are adopting the aerospace technology to enhance the blades operational life.
Analysts’ Viewpoint
The wind power coatings market is largely consolidated with three major players accounting to ~75% of the market share. Companies are focusing on niche requirements for fewer coats and faster curing in painting operations. They are increasing awareness about the inspection technology to improve the operational life of wind turbine blades in onshore and offshore applications.
However, conventional coating methods, such as using zinc powder lead to growing concerns about the degradation of the environment. Hence, manufacturers are developing coatings with graphene additives to help develop greener coatings. Companies should invest in powder and water-based coatings, since they are projected for exponential growth.
Wind Power Coatings Market: Overview
Wind Power Coatings Market: Key Growth Drivers
Wind Power Coatings Market: Major Challenges
Wind Power Coatings Market: Opportunities
Asia Pacific Dominates Wind Power Coatings Market
Extensive Usage of Wind Power Coatings in Onshore Application
Key Developments in Wind Power Coatings Market
Wind Power Coatings Market To Reach A Valuation Of US$ 2 Bn By 2027
Wind Power Coatings Market is growing at a CAGR of 10% during forecast period
Akzo Nobel N.V., 3M Co., The Sherwin-Williams Company are the top key players in the Wind Power Coatings Market
Asia Pacific holds the leading share of the global Wind Power Coatings Market
Polymer coatings type segment is the rising prominent segment in the Wind Power Coatings Market
1. Preface
1.1. Market Definition and Scope
1.2. Market Segmentation
1.3. Key Research Objectives
1.4. Research Highlights
2. Assumptions and Research Methodology
3. Executive Summary: Global Wind Power Coatings Market
4. Production Outlook, 2018
4.1. Production Outlook, by Region
5. Global Wind Power Coatings Market, Import-Export Analysis
6. Pricing Analysis, 2018 (Benchmarking)
6.1. Price Comparison Analysis, by Region
6.2. Price Comparison Analysis, by Type
6.3. Price Comparison Analysis, by Application
6.4. Price Comparison Analysis, by Technology
6.5. Price Comparison Analysis, by Wind Turbine Blades
7. Market Overview
7.1. Introduction
7.2. Key Market Indicators/Definitions
7.3. Market Dynamics
7.3.1. Drivers
7.3.2. Restraints
7.3.3. Opportunities
7.4. Porters Five Forces Analysis
7.5. Value Chain Analysis
7.6. Market Dynamics, by Wind Blade Market
7.6.1. Drivers
7.6.2. Restraints
7.6.3. Opportunities
7.7. Regulatory Landscape
8. Global Wind Power Coatings Market Analysis and Forecast, by Type
8.1. Introduction & Key Findings
8.2. Global Wind Power Coatings Market Volume (Kilo Liters) and Value (US$ Mn) Forecast, by Type, 2018–2027
8.2.1. Polymer Coatings
8.2.2. Ceramic Coatings
8.2.3. Metal Coatings
8.3. Global Wind Power Coatings Market Attractiveness, by Type
9. Global Wind Power Coatings Market Analysis and Forecast, by Application
9.1. Introduction
9.2. Global Wind Power Coatings Market Volume (Kilo Liters) and Value (US$ Mn) Forecast, by Application, 2018–2028
9.2.1. Offshore
9.2.1.1. Offshore Blade
9.2.1.2. Offshore Tower
9.2.1.3. Offshore Interior
9.2.2. Onshore
9.2.2.1. Onshore Blade
9.2.2.2. Onshore Tower
9.2.2.3. Onshore Interior
9.3. Global Wind Power Coatings Market Attractiveness, by Application
10. Global Wind Power Coatings Market Analysis and Forecast, by Technology
10.1. Introduction & Key Findings
10.2. Global Wind Power Coatings Market Volume (Kilo Liters) and Value (US$ Mn) Forecast, by Technology, 2018–2028
10.2.1. Water based
10.2.2. Solvent based
10.2.3. Powder
10.2.4. UV Cured
11. Global Wind Power Coatings Market Attractiveness, by Technology
12. Global Wind Power Coatings Market Analysis and Forecast, by Region
12.1. Key Findings
12.2. Global Wind Power Coatings Market Volume (Kilo Liters) and Value (US$ Mn) Forecast, by Region, 20110–2027
12.3. Global Wind Power Coatings Market Attractiveness, by Region
13. North America Wind Power Coatings Market Analysis and Forecast
13.1. Key Findings
13.2. North America Wind Power Coatings Market Forecast, by Type, 2018–2027
13.3. North America Wind Power Coatings Forecast, by Application, 2018–2027
13.4. North America Wind Power Coatings Market Forecast, by Technology, 2018–2027
13.5. North America Wind Power Coatings Market Forecast, by Country, 2018–2027
13.5.1. U.S. Wind Power Coatings Market Volume (Kilo Liters) and Value (US$ Mn) Forecast, by Type, 2018–2027
13.5.2. U.S. Wind Power Coatings Market Volume (Kilo Liters) and Value (US$ Mn) Forecast, by Application, 2018–2027
13.5.3. U.S. Wind Power Coatings Market Volume (Kilo Liters) and Value (US$ Mn) Forecast, by Technology, 2018–2027
13.5.4. Canada Wind Power Coatings Market Volume (Kilo Liters) and Value (US$ Mn) Forecast, by Type, 2018–2027
13.5.5. Canada Wind Power Coatings Market Volume (Kilo Liters) and Value (US$ Mn) Forecast, by Application, 2018–2027
13.5.6. Canada Wind Power Coatings Market Volume (Kilo Liters) and Value (US$ Mn) Forecast, by Technology, 2018–2027
13.6. North America Wind Power Coatings Market Attractiveness Analysis
14. Europe Wind Power Coatings Market Analysis and Forecast
14.1. Key Findings
14.2. Europe Wind Power Coatings Market Forecast, by Type, 2018–2027
14.3. Europe Wind Power Coatings Forecast, by Application, 2018–2027
14.4. Europe Wind Power Coatings Market Forecast, by Technology, 2018–2027
14.5. Europe Wind Power Coatings Market Forecast, by Country and Sub-region, 2018–2027
14.5.1. Germany Wind Power Coatings Market Volume (Kilo Liters) and Value (US$ Mn) Forecast, by Type, 2018–2027
14.5.2. Germany Wind Power Coatings Market Volume (Kilo Liters) and Value (US$ Mn) Forecast, by Application, 2018–2027
14.5.3. Germany Wind Power Coatings Market Volume (Kilo Liters) and Value (US$ Mn) Forecast, by Technology, 2018–2027
14.5.4. Spain Wind Power Coatings Market Volume (Kilo Liters) and Value (US$ Mn) Forecast, by Type, 2018–2027
14.5.5. Spain Wind Power Coatings Market Volume (Kilo Liters) and Value (US$ Mn) Forecast, by Application, 2018–2027
14.5.6. Spain Wind Power Coatings Market Volume (Kilo Liters) and Value (US$ Mn) Forecast, by Technology, 2018–2027
14.5.7. U.K. Wind Power Coatings Market Volume (Kilo Liters) and Value (US$ Mn) Forecast, by Type, 2018–2027
14.5.8. U.K. Wind Power Coatings Market Volume (Kilo Liters) and Value (US$ Mn) Forecast, by Application, 2018–2027
14.5.9. U.K. Wind Power Coatings Market Volume (Kilo Liters) and Value (US$ Mn) Forecast, by Technology, 2018–2027
14.5.10. France Wind Power Coatings Market Volume (Kilo Liters) and Value (US$ Mn) Forecast, by Type, 2018–2027
14.5.11. France Wind Power Coatings Market Volume (Kilo Liters) and Value (US$ Mn) Forecast, by Application, 2018–2027
14.5.12. France Wind Power Coatings Market Volume (Kilo Liters) and Value (US$ Mn) Forecast, by Technology, 2018–2027
14.5.13. Italy Wind Power Coatings Market Volume (Kilo Liters) and Value (US$ Mn) Forecast, by Type, 2018–2027
14.5.14. Italy Wind Power Coatings Market Volume (Kilo Liters) and Value (US$ Mn) Forecast, by Application, 2018–2027
14.5.15. Italy Wind Power Coatings Market Volume (Kilo Liters) and Value (US$ Mn) Forecast, by Technology, 2018–2027
14.5.16. Russia & CIS Wind Power Coatings Market Volume (Kilo Liters) and Value (US$ Mn) Forecast, by Type, 2018–2027
14.5.17. Russia & CIS Wind Power Coatings Market Volume (Kilo Liters) and Value (US$ Mn) Forecast, by Application, 2018–2027
14.5.18. Russia & CIS Wind Power Coatings Market Volume (Kilo Liters) and Value (US$ Mn) Forecast, by Technology, 2018–2027
14.5.19. Rest of Europe Wind Power Coatings Market Volume (Kilo Liters) and Value (US$ Mn) Forecast, by Type, 2018–2027
14.5.20. Rest of Europe Wind Power Coatings Market Volume (Kilo Liters) and Value (US$ Mn) Forecast, by Application, 2018–2027
14.5.21. Rest of Europe Wind Power Coatings Market Volume (Kilo Liters) and Value (US$ Mn) Forecast, by Technology, 2018–2027
14.6. Europe Wind Power Coatings Market Attractiveness Analysis
15. Asia Pacific Wind Power Coatings Market Analysis and Forecast
15.1. Key Findings
15.2. Asia Pacific Wind Power Coatings Market Forecast, by Type, 2018–2027
15.3. Asia Pacific Wind Power Coatings Forecast, by Application, 2018–2027
15.4. Asia Pacific Wind Power Coatings Market Forecast, by Technology, 2018–2027
15.5. Asia Pacific Wind Power Coatings Market Forecast, by Country and Sub-region, 2018–2027
15.5.1. China Wind Power Coatings Market Volume (Kilo Liters) and Value (US$ Mn) Forecast, by Type, 2018–2027
15.5.2. China Wind Power Coatings Market Volume (Kilo Liters) and Value (US$ Mn) Forecast, by Application, 2018–2027
15.5.3. China Wind Power Coatings Market Volume (Kilo Liters) and Value (US$ Mn) Forecast, by Technology, 2018–2027
15.5.4. India Wind Power Coatings Market Volume (Kilo Liters) and Value (US$ Mn) Forecast, by Type, 2018–2027
15.5.5. India Wind Power Coatings Market Volume (Kilo Liters) and Value (US$ Mn) Forecast, by Application, 2018–2027
15.5.6. India Wind Power Coatings Market Volume (Kilo Liters) and Value (US$ Mn) Forecast, by Technology, 2018–2027
15.5.7. Japan Wind Power Coatings Market Volume (Kilo Liters) and Value (US$ Mn) Forecast, by Type, 2018–2027
15.5.8. Australia Wind Power Coatings Market Volume (Kilo Liters) and Value (US$ Mn) Forecast, by Type, 2018–2027
15.5.9. Australia Wind Power Coatings Market Volume (Kilo Liters) and Value (US$ Mn) Forecast, by Application, 2018–2027
15.5.10. Australia Wind Power Coatings Market Volume (Kilo Liters) and Value (US$ Mn) Forecast, by Technology, 2018–2027
15.5.11. Japan Wind Power Coatings Market Volume (Kilo Liters) and Value (US$ Mn) Forecast, by Application, 2018–2027
15.5.12. Japan Wind Power Coatings Market Volume (Kilo Liters) and Value (US$ Mn) Forecast, by Technology, 2018–2027
15.5.13. Rest of Asia Pacific Wind Power Coatings Market Volume (Kilo Liters) and Value (US$ Mn) Forecast, by Type, 2018–2027
15.5.14. Rest of Asia Pacific Wind Power Coatings Market Volume (Kilo Liters) and Value (US$ Mn) Forecast, by Application, 2018–2027
15.5.15. Rest of Asia Pacific Wind Power Coatings Market Volume (Kilo Liters) and Value (US$ Mn) Forecast, by Technology, 2018–2027
15.6. Asia Pacific Wind Power Coatings Market Attractiveness Analysis
16. Latin America Wind Power Coatings Market Analysis and Forecast
16.1. Key Findings
16.2. Latin America Wind Power Coatings Market Forecast, by Type, 2018–2027
16.3. Latin America Wind Power Coatings Forecast, by Application, 2018–2027
16.4. Latin America Wind Power Coatings Market Forecast, by Technology, 2018–2027
16.5. Latin America Wind Power Coatings Market Forecast, by Country and Sub-region, 2018–2027
16.5.1. Brazil Wind Power Coatings Market Volume (Kilo Liters) and Value (US$ Mn) Forecast, by Type, 2018–2027
16.5.2. Brazil Wind Power Coatings Market Volume (Kilo Liters) and Value (US$ Mn) Forecast, by Application, 2018–2027
16.5.3. Brazil Wind Power Coatings Market Volume (Kilo Liters) and Value (US$ Mn) Forecast, by Technology, 2018–2027
16.5.4. Mexico Wind Power Coatings Market Volume (Kilo Liters) and Value (US$ Mn) Forecast, by Type, 2018–2027
16.5.5. Mexico Wind Power Coatings Market Volume (Kilo Liters) and Value (US$ Mn) Forecast, by Application, 2018–2027
16.5.6. Mexico Wind Power Coatings Market Volume (Kilo Liters) and Value (US$ Mn) Forecast, by Technology, 2018–2027
16.5.7. Rest of Latin America Wind Power Coatings Market Volume (Kilo Liters) and Value (US$ Mn) Forecast, by Type, 2018–2027
16.5.8. Rest of Latin America Wind Power Coatings Market Volume (Kilo Liters) and Value (US$ Mn) Forecast, by Application, 2018–2027
16.5.9. Rest of Latin America Wind Power Coatings Market Volume (Kilo Liters) and Value (US$ Mn) Forecast, by Technology, 2018–2027
16.6. 13.6. Latin America Wind Power Coatings Market Attractiveness Analysis
17. Middle East & Africa Wind Power Coatings Market Analysis and Forecast
17.1. Key Findings
17.2. Middle East & Africa Wind Power Coatings Market Forecast, by Type, 2018–2027
17.3. Middle East & Africa Wind Power Coatings Forecast, by Application, 2018–2027
17.4. Middle East & Africa Wind Power Coatings Market Forecast, by Technology, 2018–2027
17.5. Middle East & Africa Wind Power Coatings Market Forecast, by Country and Sub-region, 2018–2027
17.5.1. South Africa Wind Power Coatings Market Volume (Kilo Liters) and Value (US$ Mn) Forecast, by Type, 2018–2027
17.5.2. South Africa Wind Power Coatings Market Volume (Kilo Liters) and Value (US$ Mn) Forecast, by Application, 2018–2027
17.5.3. South Africa Wind Power Coatings Market Volume (Kilo Liters) and Value (US$ Mn) Forecast, by Technology, 2018–2027
17.5.4. Egypt Wind Power Coatings Market Volume (Kilo Liters) and Value (US$ Mn) Forecast, by Type, 2018–2027
17.5.5. Egypt Wind Power Coatings Market Volume (Kilo Liters) and Value (US$ Mn) Forecast, by Application, 2018–2027
17.5.6. Egypt Wind Power Coatings Market Volume (Kilo Liters) and Value (US$ Mn) Forecast, by Technology, 2018–2027
17.5.7. Rest of Middle East & Africa Wind Power Coatings Market Volume (Kilo Liters) and Value (US$ Mn) Forecast, by Type, 2018–2027
17.5.8. Rest of Middle East & Africa Wind Power Coatings Market Volume (Kilo Liters) and Value (US$ Mn) Forecast, by Application, 2018–2027
17.5.9. Rest of Middle East & Africa Wind Power Coatings Market Volume (Kilo Liters) and Value (US$ Mn) Forecast, by Technology, 2018–2027
17.6. Middle East & Africa Wind Power Coatings Market Attractiveness Analysis
18. Competition Landscape
18.1. Global Wind Power Coatings Market Share Analysis, by Company, 2018
18.2. Competition Matrix
18.2.1. Teknos Group Oy
18.2.2. Hempel A/S
18.2.3. Jotun Group
18.2.4. PPG Industries, Inc.
18.3. Company Profiles
18.3.1. Hempel A/S
18.3.1.1. Company Description
18.3.1.2. Business Overview
18.3.1.3. Financial Details
18.3.1.4. Key Developments
18.3.2. PPG Industries, Inc.
18.3.2.1. Company Description
18.3.2.2. Business Overview
18.3.2.3. Financial Details
18.3.2.4. Key Developments
18.3.3. Akzo Nobel N.V.
18.3.3.1. Company Description
18.3.3.2. Business Overview
18.3.3.3. Financial Details
18.3.3.4. Key Developments
18.3.4. Jotun Group
18.3.4.1. Company Description
18.3.4.2. Business Overview
18.3.4.3. Financial Details
18.3.4.4. Key Developments
18.3.5. Teknos Group Oy
18.3.5.1. Company Description
18.3.5.2. Business Overview
18.3.5.3. Financial Details
18.3.5.4. Key Developments
18.3.6. 3M
18.3.6.1. Company Description
18.3.6.2. Business Overview
18.3.6.3. Financial Details
18.3.6.4. Key Developments
18.3.7. The Sherwin-Williams Company
18.3.7.1. Company Description
18.3.7.2. Business Overview
18.3.7.3. Financial Details
18.3.7.4. Key Developments
18.3.8. Mankiewicz Gebr. & Co. (GmbH & Co. KG)
18.3.8.1. Company Description
18.3.8.2. Business Overview
18.3.9. Bergolin GmbH & Co. KG
18.3.9.1. Company Description
18.3.9.2. Business Overview
18.3.10. Duromar, Inc.
18.3.10.1. Company Description
18.3.10.2. Business Overview
18.3.10.3. Financial Details
18.3.10.4. Key Developments
18.3.11. Aeolus Coatings B.V.
18.3.11.1. Company Description
18.3.11.2. Business Overview
List of Tables
Table 1: Global Wind Power Coatings Market Volume (Kilo Liters) Forecast, by Type, 2018–2027
Table 2: Global Wind Power Coatings Market Value (US$ Mn) Forecast, by Type, 2018–2027
Table 3: Global Wind Power Coatings Market Volume (Kilo Liters) and Forecast, by Application, 2018–2027
Table 4: Global Wind Power Coatings Market Value (US$ Mn) and Forecast, by Application, 2018–2027
Table 5: Global Wind Power Coatings Market Volume (Kilo Liters) and Forecast, by Onshore, 2018–2027
Table 6: Global Wind Power Coatings Market Value (US$ Mn) and Forecast, by Onshore, 2018–2027
Table 7: Global Wind Power Coatings Market Volume (Kilo Liters) and Forecast, by Offshore, 2018–2027
Table 8: Global Wind Power Coatings Market Value (US$ Mn) and Forecast, by Offshore, 2018–2027
Table 9: Global Wind Power Coatings Market Volume (Kilo Liters) Forecast, by Technology, 2018–2027
Table 10: Global Wind Power Coatings Market Value (US$ Mn) Forecast, by Technology, 2018–2027
Table 11: North America Wind Power Coatings Market Volume (Kilo Liters) Forecast, by Type, 2018–2027
Table 12: North America Wind Power Coatings Market Value (US$ Mn) Forecast, by Type, 2018–2027
Table 13: North America Wind Power Coatings Market Volume (Kilo Liters) Forecast, by Application, 2018–2027
Table 14: North America Wind Power Coatings Market Value (US$ Mn) Forecast, by Application, 2018–2027
Table 15: North America Wind Power Coatings Market Volume (Kilo Liters) Forecast, by Onshore, 2018–2027
Table 16: North America Wind Power Coatings Market Value (US$ Mn) Forecast, by Onshore, 2018–2027
Table 17: North America Wind Power Coatings Market Volume (Kilo Liters) Forecast, by Offshore, 2018–2027
Table 18: North America Wind Power Coatings Market Value (US$ Mn) Forecast, by Offshore, 2018–2027
Table 19: North America Wind Power Coatings Market Volume (Kilo Liters) Forecast, by Technology, 2018–2027
Table 20: North America Wind Power Coatings Market Value (US$ Mn) Forecast, by Technology, 2018–2027
Table 21: North America Wind Power Coatings Market Volume (Kilo Liters) Forecast, by Country, 2018–2027
Table 22: North America Wind Power Coatings Market Value (US$ Mn) Forecast, by Country, 2018–2027
Table 23: U.S. Wind Power Coatings Market Volume (Kilo Liters) Forecast, by Type, 2018–2027
Table 24: U.S. Wind Power Coatings Market Value (US$ Mn) Forecast, by Type, 2018–2027
Table 25: U.S. Wind Power Coatings Market Volume (Kilo Liters) Forecast, by Application, 2018–2027
Table 26: U.S. Wind Power Coatings Market Value (US$ Mn) Forecast, by Application, 2018–2027
Table 27: U.S. Wind Power Coatings Market Volume (Kilo Liters) Forecast, by Onshore, 2018–2027
Table 28: U.S. Wind Power Coatings Market Value (US$ Mn) Forecast, by Onshore, 2018–2027
Table 29: U.S. Wind Power Coatings Market Volume (Kilo Liters) Forecast, by Offshore, 2018–2027
Table 30: U.S. Wind Power Coatings Market Value (US$ Mn) Forecast, by Offshore, 2018–2027
Table 31: U.S. Wind Power Coatings Market Volume (Kilo Liters) Forecast, by Technology, 2018–2027
Table 32: U.S. Wind Power Coatings Market Value (US$ Mn) Forecast, by Technology, 2018–2027
Table 33: Canada Wind Power Coatings Market Volume (Kilo Liters) Forecast, by Type, 2018–2027
Table 34: Canada Wind Power Coatings Market Value (US$ Mn) Forecast, by Type, 2018–2027
Table 35: Canada Wind Power Coatings Market Volume (Kilo Liters) Forecast, by Application, 2018–2027
Table 36: Canada Wind Power Coatings Market Value (US$ Mn) Forecast, by Application, 2018–2027
Table 37: Canada Wind Power Coatings Market Volume (Kilo Liters) Forecast, by Onshore, 2018–2027
Table 38: Canada Wind Power Coatings Market Value (US$ Mn) Forecast, by Onshore, 2018–2027
Table 39: Canada Wind Power Coatings Market Volume (Kilo Liters) Forecast, by Technology, 2018–2027
Table 40: Canada Wind Power Coatings Market Value (US$ Mn) Forecast, by Technology, 2018–2027
Table 41: Europe Wind Power Coatings Market Volume (Kilo Liters) Forecast, by Type, 2018–2027
Table 42: Europe Wind Power Coatings Market Value (US$ Mn) Forecast, by Type, 2018–2027
Table 43: Europe Wind Power Coatings Market Volume (Kilo Liters) Forecast, by Application, 2018–2027
Table 44: Europe Wind Power Coatings Market Value (US$ Mn) Forecast, by Application, 2018–2027
Table 45: Europe Wind Power Coatings Market Volume (Kilo Liters) Forecast, by Onshore, 2018–2027
Table 46: Europe Wind Power Coatings Market Value (US$ Mn) Forecast, by Onshore, 2018–2027
Table 47: Europe Wind Power Coatings Market Volume (Kilo Liters) Forecast, by Offshore, 2018–2027
Table 48: Europe Wind Power Coatings Market Value (US$ Mn) Forecast, by Offshore, 2018–2027
Table 49: Europe Wind Power Coatings Market Volume (Kilo Liters) Forecast, by Technology, 2018–2027
Table 50: Europe Wind Power Coatings Market Value (US$ Mn) Forecast, by Technology, 2018–2027
Table 51: Europe Wind Power Coatings Market Volume (Kilo Liters) Forecast, by Country and Sub-region, 2018–2027
Table 52: Europe Wind Power Coatings Market Value (US$ Mn) Forecast, by Country and Sub-region, 2018–2027
Table 53: Germany Wind Power Coatings Market Volume (Kilo Liters) Forecast, by Type, 2018–2027
Table 54: Germany Wind Power Coatings Market Value (US$ Mn) Forecast, by Type, 2018–2027
Table 55: Germany Wind Power Coatings Market Volume (Kilo Liters) Forecast, by Application, 2018–2027
Table 56: Germany Wind Power Coatings Market Value (US$ Mn) Forecast, by Application, 2018–2027
Table 57: Germany Wind Power Coatings Market Volume (Kilo Liters) Forecast, by Onshore, 2018–2027
Table 58: Germany Wind Power Coatings Market Value (US$ Mn) Forecast, by Onshore, 2018–2027
Table 59: Germany Wind Power Coatings Market Volume (Kilo Liters) Forecast, by Offshore, 2018–2027
Table 60: Germany Wind Power Coatings Market Value (US$ Mn) Forecast, by Offshore, 2018–2027
Table 61: Germany Wind Power Coatings Market Volume (Kilo Liters) Forecast, by Technology, 2018–2027
Table 62: Germany Wind Power Coatings Market Value (US$ Mn) Forecast, by Technology, 2018–2027
Table 63: Spain Wind Power Coatings Market Volume (Kilo Liters) Forecast, by Type, 2018–2027
Table 64: Spain Wind Power Coatings Market Value (US$ Mn) Forecast, by Type, 2018–2027
Table 65: Spain Wind Power Coatings Market Volume (Kilo Liters) Forecast, by Application, 2018–2027
Table 66: Spain Wind Power Coatings Market Value (US$ Mn) Forecast, by Application, 2018–2027
Table 67: Spain Wind Power Coatings Market Volume (Kilo Liters) Forecast, by Onshore, 2018–2027
Table 68: Spain Wind Power Coatings Market Value (US$ Mn) Forecast, by Onshore, 2018–2027
Table 69: Spain Wind Power Coatings Market Volume (Kilo Liters) Forecast, by Offshore, 2018–2027
Table 70: Spain Wind Power Coatings Market Value (US$ Mn) Forecast, by Offshore, 2018–2027
Table 71: Spain Wind Power Coatings Market Volume (Kilo Liters) Forecast, by Technology, 2018–2027
Table 72: Spain Wind Power Coatings Market Value (US$ Mn) Forecast, by Technology, 2018–2027
Table 73: U.K. Wind Power Coatings Market Volume (Kilo Liters) Forecast, by Type, 2018–2027
Table 74: U.K. Wind Power Coatings Market Value (US$ Mn) Forecast, by Type, 2018–2027
Table 75: U.K. Wind Power Coatings Market Volume (Kilo Liters) Forecast, by Application, 2018–2027
Table 76: U.K. Wind Power Coatings Market Value (US$ Mn) Forecast, by Application, 2018–2027
Table 77: U.K. Wind Power Coatings Market Volume (Kilo Liters) Forecast, by Onshore, 2018–2027
Table 78: U.K. Wind Power Coatings Market Value (US$ Mn) Forecast, by Onshore, 2018–2027
Table 79: U.K. Wind Power Coatings Market Volume (Kilo Liters) Forecast, by Offshore, 2018–2027
Table 80: U.K. Wind Power Coatings Market Value (US$ Mn) Forecast, by Offshore, 2018–2027
Table 81: U.K. Wind Power Coatings Market Volume (Kilo Liters) Forecast, by Technology, 2018–2027
Table 82: U.K. Wind Power Coatings Market Value (US$ Mn) Forecast, by Technology, 2018–2027
Table 83: France Wind Power Coatings Market Volume (Kilo Liters) Forecast, by Type, 2018–2027
Table 84: France Wind Power Coatings Market Value (US$ Mn) Forecast, by Type, 2018–2027
Table 85: France Wind Power Coatings Market Volume (Kilo Liters) Forecast, by Application, 2018–2027
Table 86: France Wind Power Coatings Market Value (US$ Mn) Forecast, by Application, 2018–2027
Table 87: France Wind Power Coatings Market Volume (Kilo Liters) Forecast, by Onshore, 2018–2027
Table 88: France Wind Power Coatings Market Value (US$ Mn) Forecast, by Onshore, 2018–2027
Table 89: France Wind Power Coatings Market Volume (Kilo Liters) Forecast, by Technology, 2018–2027
Table 90: France Wind Power Coatings Market Value (US$ Mn) Forecast, by Technology, 2018–2027
Table 91: Italy Wind Power Coatings Market Volume (Kilo Liters) Forecast, by Type, 2018–2027
Table 92: Italy Wind Power Coatings Market Value (US$ Mn) Forecast, by Type, 2018–2027
Table 93: Italy Wind Power Coatings Market Volume (Kilo Liters) Forecast, by Application, 2018–2027
Table 94: Italy Wind Power Coatings Market Value (US$ Mn) Forecast, by Application, 2018–2027
Table 95: Italy Wind Power Coatings Market Volume (Kilo Liters) Forecast, by Onshore, 2018–2027
Table 96: Italy Wind Power Coatings Market Value (US$ Mn) Forecast, by Onshore, 2018–2027
Table 97: Italy Wind Power Coatings Market Volume (Kilo Liters) Forecast, by Technology, 2018–2027
Table 98: Italy Wind Power Coatings Market Value (US$ Mn) Forecast, by Technology, 2018–2027
Table 99: Rest of Europe Wind Power Coatings Market Volume (Kilo Liters) Forecast, by Type, 2018–2027
Table 100: Rest of Europe Wind Power Coatings Market Value (US$ Mn) Forecast, by Type, 2018–2027
Table 101: Rest of Europe Wind Power Coatings Market Volume (Kilo Liters) Forecast, by Application, 2018–2027
Table 102: Rest of Europe Wind Power Coatings Market Value (US$ Mn) Forecast, by Application, 2018–2027
Table 103: Rest of Europe Wind Power Coatings Market Volume (Kilo Liters) Forecast, by Onshore, 2018–2027
Table 104: Rest of Europe Wind Power Coatings Market Value (US$ Mn) Forecast, by Onshore, 2018–2027
Table 105: Rest of Europe Wind Power Coatings Market Volume (Kilo Liters) Forecast, by Offshore, 2018–2027
Table 106: Rest of Europe Wind Power Coatings Market Value (US$ Mn) Forecast, by Offshore, 2018–2027
Table 107: Rest of Europe Wind Power Coatings Market Volume (Kilo Liters) Forecast, by Technology, 2018–2027
Table 108: Rest of Europe Wind Power Coatings Market Value (US$ Mn) Forecast, by Technology, 2018–2027
Table 109: Asia Pacific Wind Power Coatings Market Volume (Kilo Liters) Forecast, by Type, 2018–2027
Table 110: Asia Pacific Wind Power Coatings Market Value (US$ Mn) Forecast, by Type, 2018–2027
Table 111: Asia Pacific Wind Power Coatings Market Volume (Kilo Liters) Forecast, by Application, 2018–2027
Table 112: Asia Pacific Wind Power Coatings Market Value (US$ Mn) Forecast, by Application, 2018–2027
Table 113: Asia Pacific Wind Power Coatings Market Volume (Kilo Liters) Forecast, by Onshore, 2018–2027
Table 114: Asia Pacific Wind Power Coatings Market Value (US$ Mn) Forecast, by Onshore, 2018–2027
Table 115: Asia Pacific Wind Power Coatings Market Volume (Kilo Liters) Forecast, by Offshore, 2018–2027
Table 116: Asia Pacific Wind Power Coatings Market Value (US$ Mn) Forecast, by Offshore, 2018–2027
Table 117: Asia Pacific Wind Power Coatings Market Volume (Kilo Liters) Forecast, by Technology, 2018–2027
Table 118: Asia Pacific Wind Power Coatings Market Value (US$ Mn) Forecast, by Technology, 2018–2027
Table 119: Asia Pacific Wind Power Coatings Market Volume (Kilo Liters) Forecast, by Country and Sub-region, 2018–2027
Table 120: Asia Pacific Wind Power Coatings Market Value (US$ Mn) Forecast, by Country and Sub-region, 2018–2027
Table 121: China Wind Power Coatings Market Volume (Kilo Liters) Forecast, by Type, 2018–2027
Table 122: China Wind Power Coatings Market Value (US$ Mn) Forecast, by Type, 2018–2027
Table 123: China Wind Power Coatings Market Volume (Kilo Liters) Forecast, by Application, 2018–2027
Table 124: China Wind Power Coatings Market Value (US$ Mn) Forecast, by Application, 2018–2027
Table 125: China Wind Power Coatings Market Volume (Kilo Liters) Forecast, by Onshore, 2018–2027
Table 126: China Wind Power Coatings Market Value (US$ Mn) Forecast, by Onshore, 2018–2027
Table 127: China Wind Power Coatings Market Volume (Kilo Liters) Forecast, by Offshore, 2018–2027
Table 128: China Wind Power Coatings Market Value (US$ Mn) Forecast, by Offshore, 2018–2027
Table 129: China Wind Power Coatings Market Volume (Kilo Liters) Forecast, by Technology, 2018–2027
Table 130: China Wind Power Coatings Market Value (US$ Mn) Forecast, by Technology, 2018–2027
Table 131: India Wind Power Coatings Market Volume (Kilo Liters) Forecast, by Type, 2018–2027
Table 132: India Wind Power Coatings Market Value (US$ Mn) Forecast, by Type, 2018–2027
Table 133: India Wind Power Coatings Market Volume (Kilo Liters) Forecast, by Application, 2018–2027
Table 134: India Wind Power Coatings Market Value (US$ Mn) Forecast, by Application, 2018–2027
Table 135: India Wind Power Coatings Market Volume (Kilo Liters) Forecast, by Onshore, 2018–2027
Table 136: India Wind Power Coatings Market Value (US$ Mn) Forecast, by Onshore, 2018–2027
Table 137: India Wind Power Coatings Market Volume (Kilo Liters) Forecast, by Technology, 2018–2027
Table 138: India Wind Power Coatings Market Value (US$ Mn) Forecast, by Technology, 2018–2027
Table 139: Australia Wind Power Coatings Market Volume (Kilo Liters) Forecast, by Type, 2018–2027
Table 140: Australia Wind Power Coatings Market Value (US$ Mn) Forecast, by Type, 2018–2027
Table 141: Australia Wind Power Coatings Market Volume (Kilo Liters) Forecast, by Application, 2018–2027
Table 142: Australia Wind Power Coatings Market Value (US$ Mn) Forecast, by Application, 2018–2027
Table 143: Australia Wind Power Coatings Market Volume (Kilo Liters) Forecast, by Onshore, 2018–2027
Table 144: Australia Wind Power Coatings Market Value (US$ Mn) Forecast, by Onshore, 2018–2027
Table 145: Australia Wind Power Coatings Market Volume (Kilo Liters) Forecast, by Technology, 2018–2027
Table 146: Australia Wind Power Coatings Market Value (US$ Mn) Forecast, by Technology, 2018–2027
Table 147: Japan Wind Power Coatings Market Volume (Kilo Liters) Forecast, by Type, 2018–2027
Table 148: Japan Wind Power Coatings Market Value (US$ Mn) Forecast, by Type, 2018–2027
Table 149: Japan Wind Power Coatings Market Volume (Kilo Liters) Forecast, by Application, 2018–2027
Table 150: Japan Wind Power Coatings Market Value (US$ Mn) Forecast, by Application, 2018–2027
Table 151: Japan Wind Power Coatings Market Volume (Kilo Liters) Forecast, by Onshore, 2018–2027
Table 152: Japan Wind Power Coatings Market Value (US$ Mn) Forecast, by Onshore, 2018–2027
Table 153: Japan Wind Power Coatings Market Volume (Kilo Liters) Forecast, by Offshore, 2018–2027
Table 154: Japan Wind Power Coatings Market Value (US$ Mn) Forecast, by Offshore, 2018–2027
Table 155: Japan Wind Power Coatings Market Volume (Kilo Liters) Forecast, by Technology, 2018–2027
Table 156: Japan Wind Power Coatings Market Value (US$ Mn) Forecast, by Technology, 2018–2027
Table 157: Rest of Asia Pacific Wind Power Coatings Market Volume (Kilo Liters) Forecast, by Type, 2018–2027
Table 158: Rest of Asia Pacific Wind Power Coatings Market Value (US$ Mn) Forecast, by Type, 2018–2027
Table 159: Rest of Asia Pacific Wind Power Coatings Market Volume (Kilo Liters) Forecast, by Application, 2018–2027
Table 160: Rest of Asia Pacific Wind Power Coatings Market Value (US$ Mn) Forecast, by Application, 2018–2027
Table 161: Rest of Asia Pacific Wind Power Coatings Market Volume (Kilo Liters) Forecast, by Onshore, 2018–2027
Table 162: Rest of Asia Pacific Wind Power Coatings Market Value (US$ Mn) Forecast, by Onshore, 2018–2027
Table 163: Rest of Asia Pacific Wind Power Coatings Market Volume (Kilo Liters) Forecast, by Offshore, 2018–2027
Table 164: Rest of Asia Pacific Wind Power Coatings Market Value (US$ Mn) Forecast, by Offshore, 2018–2027
Table 165: Rest of Asia Pacific Wind Power Coatings Market Volume (Kilo Liters) Forecast, by Technology, 2018–2027
Table 166: Rest of Asia Pacific Wind Power Coatings Market Value (US$ Mn) Forecast, by Technology, 2018–2027
Table 167: Latin America Wind Power Coatings Market Volume (Kilo Liters) Forecast, by Type, 2018–2027
Table 168: Latin America Wind Power Coatings Market Value (US$ Mn) Forecast, by Type, 2018–2027
Table 169: Latin America Wind Power Coatings Market Volume (Kilo Liters) and Forecast, by Application, 2018–2027
Table 170: Latin America Wind Power Coatings Market Value (US$ Mn) and Forecast, by Application, 2018–2027
Table 171: Global Wind Power Coatings Market Volume (Kilo Liters) and Forecast, by Onshore, 2018–2027
Table 172: Global Wind Power Coatings Market Value (US$ Mn) and Forecast, by Onshore, 2018–2027
Table 173: Latin America Wind Power Coatings Market Volume (Kilo Liters) Forecast, by Technology, 2018–2027
Table 174: Latin America Wind Power Coatings Market Value (US$ Mn) Forecast, by Technology, 2018–2027
Table 175: Latin America Wind Power Coatings Market Volume (Kilo Liters) Forecast, by Country/Sub-region, 2018–2027
Table 176: Latin America Wind Power Coatings Market Value (US$ Mn) Forecast, by Country/Sub-region, 2018–2027
Table 177: Brazil Wind Power Coatings Market Volume (Kilo Liters) Forecast, by Type, 2018–2027
Table 178: Brazil Wind Power Coatings Market Value (US$ Mn) Forecast, by Type, 2018–2027
Table 179: Brazil Wind Power Coatings Market Volume (Kilo Liters) and Forecast, by Application, 2018–2027
Table 180: Brazil Wind Power Coatings Market Value (US$ Mn) and Forecast, by Application, 2018–2027
Table 181: Brazil Wind Power Coatings Market Volume (Kilo Liters) and Forecast, by Onshore, 2018–2027
Table 182: Brazil Wind Power Coatings Market Value (US$ Mn) and Forecast, by Onshore, 2018–2027
Table 183: Brazil Wind Power Coatings Market Volume (Kilo Liters) Forecast, by Technology, 2018–2027
Table 184: Brazil Wind Power Coatings Market Value (US$ Mn) Forecast, by Technology, 2018–2027
Table 185: Mexico Wind Power Coatings Market Volume (Kilo Liters) Forecast, by Type, 2018–2027
Table 186: Mexico Wind Power Coatings Market Value (US$ Mn) Forecast, by Type, 2018–2027
Table 187: Mexico Wind Power Coatings Market Volume (Kilo Liters) and Forecast, by Application, 2018–2027
Table 188: Mexico Wind Power Coatings Market Value (US$ Mn) and Forecast, by Application, 2018–2027
Table 189: Mexico Wind Power Coatings Market Volume (Kilo Liters) and Forecast, by Onshore, 2018–2027
Table 190: Mexico Wind Power Coatings Market Value (US$ Mn) and Forecast, by Onshore, 2018–2027
Table 191: Mexico Wind Power Coatings Market Volume (Kilo Liters) Forecast, by Technology, 2018–2027
Table 192: Mexico Wind Power Coatings Market Value (US$ Mn) Forecast, by Technology, 2018–2027
Table 193: Rest of Latin America Wind Power Coatings Market Volume (Kilo Liters) Forecast, by Type, 2018–2027
Table 194: Rest of Latin America Wind Power Coatings Market Value (US$ Mn) Forecast, by Type, 2018–2027
Table 195: Rest of Latin America Wind Power Coatings Market Volume (Kilo Liters) and Forecast, by Application, 2018–2027
Table 196: Rest of Latin America Wind Power Coatings Market Value (US$ Mn) and Forecast, by Application, 2018–2027
Table 197: Rest of Latin America Wind Power Coatings Market Volume (Kilo Liters) and Forecast, by Onshore, 2018–2027
Table 198: Rest of Latin America Wind Power Coatings Market Value (US$ Mn) and Forecast, by Onshore, 2018–2027
Table 199: Rest of Latin America Wind Power Coatings Market Volume (Kilo Liters) Forecast, by Technology, 2018–2027
Table 200: Rest of Latin America Wind Power Coatings Market Value (US$ Mn) Forecast, by Technology, 2018–2027
Table 201: Middle East & Africa Wind Power Coatings Market Volume (Kilo Liters) Forecast, by Type, 2018–2027
Table 202: Middle East & Africa Wind Power Coatings Market Value (US$ Mn) Forecast, by Type, 2018–2027
Table 203: Middle East & Africa Wind Power Coatings Market Volume (Kilo Liters) Forecast, by Application, 2018–2027
Table 204: Middle East & Africa Wind Power Coatings Market Value (US$ Mn) Forecast, by Application, 2018–2027
Table 205: Global Wind Power Coatings Market Volume (Kilo Liters) Forecast, by Onshore, 2018–2027
Table 206: Global Wind Power Coatings Market Value (US$ Mn) Forecast, by Onshore, 2018–2027
Table 207: Middle East & Africa Wind Power Coatings Market Volume (Kilo Liters) Forecast, by Technology, 2018–2027
Table 208: Middle East & Africa Wind Power Coatings Market Value (US$ Mn) Forecast, by Technology, 2018–2027
Table 209: Middle East & Africa Wind Power Coatings Market Volume (Kilo Liters) Forecast, by Country and Sub-region, 2018–2027
Table 210: Middle East & Africa Wind Power Coatings Market Value (US$ Mn) Forecast, by Country and Sub-region, 2018–2027
Table 211: South Africa Wind Power Coatings Market Volume (Kilo Liters) Forecast, by Type, 2018–2027
Table 212: South Africa Wind Power Coatings Market Value (US$ Mn) Forecast, by Type, 2018–2027
Table 213: South Africa Wind Power Coatings Market Volume (Kilo Liters) Forecast, by Application, 2018–2027
Table 214: South Africa Wind Power Coatings Market Value (US$ Mn) Forecast, by Application, 2018–2027
Table 215: South Africa Wind Power Coatings Market Volume (Kilo Liters) Forecast, by Onshore, 2018–2027
Table 216: South Africa Wind Power Coatings Market Value (US$ Mn) Forecast, by Onshore, 2018–2027
Table 217: South Africa Wind Power Coatings Market Volume (Kilo Liters) Forecast, by Technology, 2018–2027
Table 218: South Africa Wind Power Coatings Market Value (US$ Mn) Forecast, by Technology, 2018–2027
Table 219: Egypt Wind Power Coatings Market Volume (Kilo Liters) Forecast, by Type, 2018–2027
Table 220: Egypt Wind Power Coatings Market Value (US$ Mn) Forecast, by Type, 2018–2027
Table 221: Egypt Wind Power Coatings Market Volume (Kilo Liters) Forecast, by Application, 2018–2027
Table 222: Egypt Wind Power Coatings Market Value (US$ Mn) Forecast, by Application, 2018–2027
Table 223: Egypt Wind Power Coatings Market Volume (Kilo Liters) Forecast, by Onshore, 2018–2027
Table 224: Egypt Wind Power Coatings Market Value (US$ Mn) Forecast, by Onshore, 2018–2027
Table 225: Egypt Wind Power Coatings Market Volume (Kilo Liters) Forecast, by Technology, 2018–2027
Table 226: Egypt Wind Power Coatings Market Value (US$ Mn) Forecast, by Technology, 2018–2027
Table 227: Rest of Middle East & Africa Wind Power Coatings Market Volume (Kilo Liters) Forecast, by Type, 2018–2027
Table 228: Rest of Middle East & Africa Wind Power Coatings Market Value (US$ Mn) Forecast, by Type, 2018–2027
Table 229: Rest of Middle East & Africa Wind Power Coatings Market Volume (Kilo Liters) Forecast, by Application, 2018–2027
Table 230: Rest of Middle East & Africa Wind Power Coatings Market Value (US$ Mn) Forecast, by Application, 2018–2027
Table 231: Rest of Middle East & Africa Wind Power Coatings Market Volume (Kilo Liters) Forecast, by Onshore, 2018–2027
Table 232: Rest of Middle East & Africa Wind Power Coatings Market Value (US$ Mn) Forecast, by Onshore, 2018–2027
Table 233: Rest of Middle East & Africa Wind Power Coatings Market Volume (Kilo Liters) Forecast, by Technology, 2018–2027
Table 234: Rest of Middle East & Africa Wind Power Coatings Market Value (US$ Mn) Forecast, by Technology, 2018–2027
List of Figures
Figure 1: Market Snapshot, Global Wind Power Coatings Market, Indicative Volume (Kilo Liters) and Value (US$ Mn), 2018–2027
Figure 2: Market Snapshot, Indicative % Value Share and Top Trends
Figure 3: Global Wind Power Coatings Market Value Share, by Type, 2018
Figure 4: Global Wind Power Coatings Market Value Share, by Application, 2018
Figure 5: Global Wind Power Coatings Market Value Share Analysis, by Type, 2018 and 2027
Figure 6: Global Wind Power Coatings Market Volume (Kilo Liters) and Value (US$ Mn) Analysis, Polymer Coatings, 2018–2027
Figure 7: Global Wind Power Coatings Market Volume (Kilo Liters) and Value (US$ Mn) Analysis, Metal Coatings, 2018–2027
Figure 8: Global Wind Power Coatings Market Volume (Kilo Liters) and Value (US$ Mn) Analysis, by Ceramic Coatings, 2018–2027
Figure 9: Global Wind Power Coatings Market Attractiveness Analysis, by Type
Figure 10: Global Wind Power Coatings Market Value Share Analysis, by Application, 2018 and 2027
Figure 11: Global Wind Power Coatings Market Volume (Kilo Liters) and Value (US$ Mn) Analysis, by Onshore, 2018–2027
Figure 12: Global Wind Power Coatings Market Volume (Kilo Liters) and Value (US$ Mn) Analysis, by Offshore, 2018–2027
Figure 13: Global Wind Power Coatings Market Attractiveness Analysis, by Application
Figure 14: Global Wind Power Coatings Market Value Share Analysis, by Technology, 2018 and 2027
Figure 15: Global Wind Power Coatings Market Volume (Kilo Liters) and Value (US$ Mn) Analysis, by Water-based, 2018–2027
Figure 16: Global Wind Power Coatings Market Volume (Kilo Liters) and Value (US$ Mn) Analysis, by Solvent-based, 2018–2027
Figure 17: Global Wind Power Coatings Market Volume (Kilo Liters) and Value (US$ Mn) Analysis, by Powder, 2018–2027
Figure 18: Global Wind Power Coatings Market Volume (Kilo Liters) and Value (US$ Mn) Analysis, by UV Cured, 2018–2027
Figure 19: Global Wind Power Coatings Market Attractiveness Analysis, by Technology
Figure 20: North America Wind Power Coatings Market Volume (Kilo Liters) and Value (US$ Mn) Forecast, 2018–2027
Figure 21: North America Wind Power Coatings Market Attractiveness Analysis, by Country
Figure 22: North America Wind Power Coatings Market Value Share Analysis, by Type, 2018 and 2027
Figure 23: North America Wind Power Coatings Market Value Share Analysis, by Application, 2018 and 2027
Figure 24: North America Wind Power Coatings Market Value Share Analysis, by Technology, 2018 and 2027
Figure 25: North America Wind Power Coatings Market Value Share Analysis, by Country, 2018 and 2027
Figure 26: U.S. Wind Power Coatings Market Value (US$ Mn) Forecast, 2018–2027
Figure 27: U.S. Wind Power Coatings Market Volume (Kilo Liters) Forecast, 2018–2027
Figure 28: Canada Wind Power Coatings Market Value (US$ Mn) Forecast, 2018–2027
Figure 29: Canada Wind Power Coatings Market Volume (Kilo Liters) Forecast, 2018–2027
Figure 30: North America Wind Power Coatings Market Attractiveness Analysis, by Type
Figure 31: North America Wind Power Coatings Market Attractiveness Analysis, by Application
Figure 32: North America Wind Power Coatings Market Attractiveness Analysis, by Technology
Figure 33: Europe Wind Power Coatings Market Volume (Kilo Liters) and Value (US$ Mn) Forecast, 2018–2027
Figure 34: Europe Wind Power Coatings Market Attractiveness Analysis, by Country and Sub-region
Figure 35: Europe Wind Power Coatings Market Value Share Analysis, by Type, 2018 and 2027
Figure 36: Europe Wind Power Coatings Market Value Share Analysis, by Application, 2018 and 2027
Figure 37: Europe Wind Power Coatings Market Value Share Analysis, by Technology, 2018 and 2027
Figure 38: Europe Wind Power Coatings Market Value Share Analysis, by Country and Sub-region, 2018 and 2027
Figure 39: Germany Wind Power Coatings Market Value (US$ Mn) Forecast, 2018–2027
Figure 40: Germany Wind Power Coatings Market Volume (Kilo Liters) Forecast, 2018–2027
Figure 41: Spain Wind Power Coatings Market Value (US$ Mn) Forecast, 2018–2027
Figure 42: Spain Wind Power Coatings Market Volume (Kilo Liters) Forecast, 2018–2027
Figure 43: U.K. Wind Power Coatings Market Value (US$ Mn) Forecast, 2018–2027
Figure 44: U.K. Wind Power Coatings Market Volume (Kilo Liters) Forecast, 2018–2027
Figure 45: France Wind Power Coatings Market Value (US$ Mn) Forecast, 2018–2027
Figure 46: France Wind Power Coatings Market Volume (Kilo Liters) Forecast, 2018–2027
Figure 47: Italy Wind Power Coatings Market Value (US$ Mn) Forecast, 2018–2027
Figure 48: Italy Wind Power Coatings Market Volume (Kilo Liters) Forecast, 2018–2027
Figure 49: Rest of Europe Wind Power Coatings Market Value (US$ Mn) Forecast, 2018–2027
Figure 50: Rest of Europe Wind Power Coatings Market Volume (Kilo Liters) Forecast, 2018–2027
Figure 51: Europe Wind Power Coatings Market Attractiveness Analysis, by Type
Figure 52: Europe Wind Power Coatings Market Attractiveness Analysis, by Application
Figure 53: Europe Wind Power Coatings Market Attractiveness Analysis, by Technology
Figure 54: Asia Pacific Wind Power Coatings Market Volume (Kilo Liters) and Value (US$ Mn) Forecast, 2018–2027
Figure 55: Asia Pacific Wind Power Coatings Market Attractiveness Analysis, by Country and Sub-region
Figure 56: Asia Pacific Wind Power Coatings Market Value Share Analysis, by Type, 2018 and 2027
Figure 57: Asia Pacific Wind Power Coatings Market Value Share Analysis, by Application, 2018 and 2027
Figure 58: Asia Pacific Wind Power Coatings Market Value Share Analysis, by Technology, 2018 and 2027
Figure 59: Asia Pacific Wind Power Coatings Market Value Share Analysis, by Country and Sub-region, 2018 and 2027
Figure 60: China Wind Power Coatings Market Value (US$ Mn) Forecast, 2018–2027
Figure 61: China Wind Power Coatings Volume (Kilo Liters) Forecast, 2018–2027
Figure 62: India Wind Power Coatings Market Value (US$ Mn) Forecast, 2018–2027
Figure 63: India Wind Power Coatings Volume (Kilo Liters) Forecast, 2018–2027
Figure 64: Australia Wind Power Coatings Market Value (US$ Mn) Forecast, 2018–2027
Figure 65: Australia Wind Power Coatings Volume (Kilo Liters) Forecast, 2018–2027
Figure 66: Japan Wind Power Coatings Market Value (US$ Mn) Forecast, 2018–2027
Figure 67: Japan Wind Power Coatings Volume (Kilo Liters) Forecast, 2018–2027
Figure 68: Rest of Asia Pacific Wind Power Coatings Market Value (US$ Mn) Forecast, 2018–2027
Figure 69: Rest of Asia Pacific Wind Power Coatings Volume (Kilo Liters) Forecast, 2018–2027
Figure 70: Asia Pacific Wind Power Coatings Market Attractiveness Analysis, by Type
Figure 71: Asia Pacific Wind Power Coatings Market Attractiveness Analysis, by Application
Figure 72: Asia Pacific Wind Power Coatings Market Attractiveness Analysis, by Technology
Figure 73: Latin America Wind Power Coatings Market Volume (Kilo Liters) and Value (US$ Mn) Forecast, 2018–2027
Figure 74: Latin America Wind Power Coatings Market Attractiveness Analysis, by Country and Sub-region
Figure 75: Latin America Wind Power Coatings Market Value Share Analysis, by Type, 2018 and 2027
Figure 76: Latin America Wind Power Coatings Market Value Share Analysis, by Application, 2018 and 2027
Figure 77: Latin America Wind Power Coatings Market Value Share Analysis, by Technology, 2018 and 2027
Figure 78: Latin America Wind Power Coatings Market Value Share Analysis, by Country and Sub-region, 2018 and 2027
Figure 79: Brazil Wind Power Coatings Market Value (US$ Mn) Forecast, 2018–2027
Figure 80: Brazil Wind Power Coatings Volume (Kilo Liters) Forecast, 2018–2027
Figure 81: Mexico Wind Power Coatings Market Value (US$ Mn) Forecast, 2018–2027
Figure 82: Mexico Wind Power Coatings Volume (Kilo Liters) Forecast, 2018–2027
Figure 83: Rest of Latin America Wind Power Coatings Market Value (US$ Mn) Forecast, 2018–2027
Figure 84: Rest of Latin America Wind Power Coatings Volume (Kilo Liters) Forecast, 2018–2027
Figure 85: Latin America Wind Power Coatings Market Attractiveness Analysis, by Type
Figure 86: Latin America Wind Power Coatings Market Attractiveness Analysis, by Application
Figure 87: Latin America Wind Power Coatings Market Attractiveness Analysis, by Technology
Figure 88: Middle East & Africa Wind Power Coatings Market Volume (Kilo Liters) and Value (US$ Mn) Forecast, 2018–2027
Figure 89: Middle East & Africa Wind Power Coatings Market Attractiveness Analysis, by Country and Sub-region
Figure 90: Middle East & Africa Wind Power Coatings Market Value Share Analysis, by Type, 2018 and 2027
Figure 91: Middle East & Africa Wind Power Coatings Market Value Share Analysis, by Application, 2018 and 2027
Figure 92: Middle East & Africa Wind Power Coatings Market Value Share Analysis, by Technology, 2018 and 2027
Figure 93: Middle East & Africa Wind Power Coatings Market Value Share Analysis, by Country and Sub-region, 2018 and 2027
Figure 94: South Africa Wind Power Coatings Market Value (US$ Mn) Forecast, 2018–2027
Figure 95: South Africa Wind Power Coatings Volume (Kilo Liters) Forecast, 2018–2027
Figure 96: Egypt Wind Power Coatings Market Value (US$ Mn) Forecast, 2018–2027
Figure 97: Egypt Wind Power Coatings Volume (Kilo Liters) Forecast, 2018–2027
Figure 98: Rest of Middle East & Africa Wind Power Coatings Market Value (US$ Mn) Forecast, 2018–2027
Figure 99: Rest of Middle East & Africa Wind Power Coatings Volume (Kilo Liters) Forecast, 2018–2027
Figure 100: Middle East & Africa Wind Power Coatings Market Attractiveness Analysis, by Type
Figure 101: Middle East & Africa Wind Power Coatings Market Attractiveness Analysis, by Application
Figure 102: Middle East & Africa Wind Power Coatings Market Attractiveness Analysis, by Technology
Figure 103: Global Wind Power Coatings Market Share Analysis, by Company (2018)
Copyright © Transparency Market Research, Inc. All Rights reserved
Trust Online

Wind Power Coatings Market