
Reports
Reports
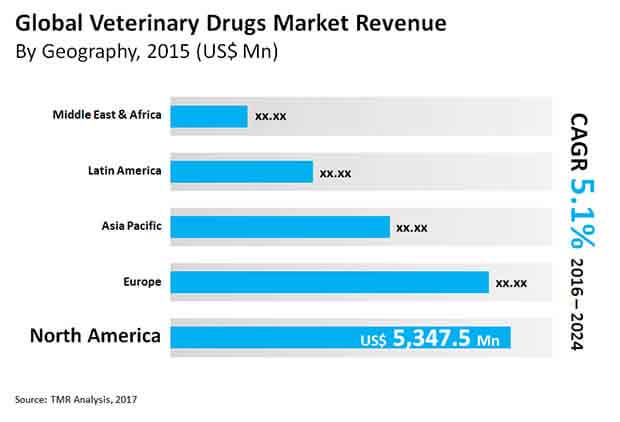
The global veterinary drugs market is estimated to register growth at a CAGR of 5.1% during the forecast period of 2016 to 2024. Thus, the market for veterinary drugs is projected to expand from the valuation of US$17.2 Bn in 2015 to US$26.7 Bn by 2024. This market growth can be ascribed to several factors such as a rise in the trend of pet adoption across several parts of the globe.
The latest study by Transparency Market Research (TMR) provides complete synopsis of factors influencing the growth curve of the global veterinary drugs market. Thus, the report covers assessment on major aspects such as growth drivers, challenges, growth opportunities, trends, and competition landscape in the market.
The analysts at TMR have performed the segmentation of the global veterinary drugs market based on many crucial parameters such as product, animal, route of administration, and region.
Based on product, the market for veterinary drugs is classified into four main categories such as anti-inflammatory, parasiticides, anti-infective, and others. In terms of animal, the market is segmented into two main parts, companion and livestock. On the basis of route of administration, the veterinary drugs market is divided into parenteral, topical, and oral.
People from across the globe, specifically from several developed nations, are inclining toward the acceptance of concept of companion ownership. This factor is fueling the growth of veterinary drugs market. Furthermore, increasing awareness among owners regarding the health of their pets is driving the demand for veterinary drugs that can help in improving mobility as well as quality of life in companion animals.
The veterinary drugs market is being driven by the increasing support from government bodies of many countries around the world. For instance, Animal Husbandry Department of the Government of India and the Ministry of AYUSH entered into an agreement that focuses on the exploration of possibilities of development of quality drugs intended for animals using medicinal herbs.
Several developing nations including India domesticate livestock animals due to their economic value. These animals are important part of different agricultural and farming activities. This factor is estimated to work in favor of the growth of the veterinary drugs market in the forthcoming years.
Some of the important regions supporting the growth of the global veterinary drugs market include Europe, North America, Latin America, Middle East & Africa, and Asia Pacific. Of them, North America dominates the market owing to many factors such as increase in the pet adoption by major regional population. Moreover, the veterinary drugs industry is estimated to gain high demand prospects in Latin America and Asia Pacific owing to surging cases of animal diseases in both the regions.
Together with fragmented nature, the global veterinary drugs market experiences presence of many well-established players. As a result, the competition level in the market seem to be highly intense. To stay ahead in the market competition, companies are using different strategic moves such as mergers, acquisitions, partnerships, and collaborations. Moreover, many enterprises are increasing investments in R&D projects, which are focused on the development and launch of advanced products. In addition, they are focused on improving the efficiency of their existing product offerings. These factors are creating ample growth opportunities in the market for veterinary drugs.
The COVID-19 pandemic has impacted negatively on the growth of major industries including the veterinary drugs industry. Manufacturers in the veterinary drugs market are strategizing their moves in order to maintain their revenue streams during the pandemic situations.
Some key players operating in the veterinary drugs market include Boehringer Ingelheim GmbH, Dechra Pharmaceuticals PLC., Vetoquinol, Virbac, Ceva Santé Animale, Elanco Animal Health (Eli Lilly and Company), and Bayer AG.
The global veterinary drugs market was worth US$17.2 Bn and is projected to reach a value of US$26.7 Bn by the end of 2024
Veterinary drugs market is anticipated to grow at a CAGR of 5.1% during the forecast period
North America accounted for a major share of the global veterinary drugs market
Veterinary Drugs Market is driven by increase in the pet adoption by major regional population, surging cases of animal diseases and increasing support from government bodies
Key players in the global veterinary drugs market include Boehringer Ingelheim GmbH, Dechra Pharmaceuticals PLC., Vetoquinol, Virbac, Ceva Santé Animale, Elanco Animal Health (Eli Lilly and Company), and Bayer AG
Chapter 1. Preface
1.1. Report Scope and Market Segmentation
1.2. Research Highlights
Chapter 2. Assumptions and Research Methodology
2.1. Assumptions
2.2. Research Methodology
Chapter 3. Executive Summary
3.1. Global Veterinary Drugs Market : Snapshot, 2015
3.2. Global Veterinary Drugs Market : Opportunity Map
Chapter 4. Market Overview
4.1. Product Overview
4.2. Global Veterinary Drugs Market Size (US$ Mn) Forecast, 2014–2024
4.3. Global Veterinary Drugs Market Outlook
4.4. Global Veterinary Drugs Market : Key Industry Events
4.5. Global Veterinary Drugs Market : Porter's Analysis
4.6. Key Product Opportunities
Chapter 5. Market Dynamics
5.1. Drivers and Restraints Snapshot Analysis
5.2. Drivers
5.2.1. Increase in pet ownership & spending on companion animals
5.2.2. Increased medical and surgical capabilities for companion animals
5.2.3. Greater emphasis on prevention and wellness by veterinarians and owners
5.2.4. Evolution of new products to combat emergence of new diseases particularly to cope with zoonotic disease concerns
5.2.5. Increased meat consumption and demand for high quality proteins driving demand for livestock animals
5.3. Restraints
5.3.1. Lack of novel veterinary drugs in the global market
5.3.2. Rising concern about the use of antibiotics and growth promoters in food animals
5.3.3. Prevalence of counterfeit medicines
5.4. Global Veterinary Drugs Market : Opportunity Analysis
5.5. Opportunities
5.5.1. Biologics and specialty care offer potential opportunities for players
5.5.2. Growing awareness and affordability of drugs for pets and livestock offer significant opportunity to new entrants
5.6. Key Trends
5.6.1. Launch of generic versions of veterinary drugs by prominent players
5.6.2. Increase in pet insurance globally
5.6.3. Targeted in-licensing and strategic acquisitions by leading players
5.6.4. Viral disease outbreak demands newer medicines every time
Chapter 6. Veterinary Drugs Market Analysis, by Product Type
6.1. Key Findings
6.2. Introduction
6.3. Global Veterinary Drugs Market Value Share Analysis, by Product Type
6.4. Veterinary Drugs Market Analysis, by Product Type
6.4.1. Anti-infective
6.4.2. Anti-inflammatory
6.4.3. Parasiticides
6.4.4. Others
6.5. Market Attractiveness Analysis, by Product Type
6.6. Key Trends
Chapter 7. Veterinary Drugs Market Analysis, by Animal Type
7.1. Key Findings
7.2. Introduction
7.3. Global Veterinary Drugs Market Value Share Analysis, by Animal Type
7.4. Veterinary Drugs Market Analysis, by Animal Type
7.4.1. Companion
7.4.2. Livestock
7.5. Market Attractiveness Analysis, by Animal Type
7.6. Key Trends
Chapter 8. Veterinary Drugs Market Analysis, by Route of Administration
8.1. Key Findings
8.2. Introduction
8.3. Global Veterinary Drugs Market Value Share Analysis, by Route of Administration
8.4. Veterinary Drugs Market Analysis, by Route of Administration
8.4.1. Oral
8.4.2. Parenteral
8.4.3. Topical
8.5. Market Attractiveness Analysis, by Route of Administration
8.6. Key Trends
Chapter 9. Veterinary Drugs Market Analysis, by Region
9.1. Global Veterinary Drugs Market Snapshot, by Country
9.2. Global Veterinary Drugs Market Value Share Analysis, by Region
9.3. Veterinary Drugs Market Forecast, by Region
9.4. Market Attractiveness Analysis, by Region
Chapter 10. North America Veterinary Drugs Market Analysis
10.1. Key Findings
10.2. Market Overview
10.3. Market Analysis, by Product
10.3.1. Market Value Share Analysis, by Product
10.3.2. Market Size (US$ Mn) Forecast, by Product
10.3.2.1. Anti-infective
10.3.2.2. Anti-inflammatory
10.3.2.3. Parasiticides
10.3.2.4. Others
10.4. Market Analysis, by Animal
10.4.1. Market Value Share Analysis, by Animal
10.4.2. Market Size (US$ Mn) Forecast, by Animal
10.4.2.1. Companion
10.4.2.2. Livestock
10.5. Market Analysis, by Route of Administration
10.5.1. Market Value Share Analysis, by Route of Administration
10.5.2. Market Size (US$ Mn) Forecast, by Route of Administration
10.5.2.1. Oral
10.5.2.2. Parenteral
10.5.2.3. Topical
10.6. Market Analysis, by Country
10.6.1. Market Value Share Analysis, by Country
10.6.2. Market Size (US$ Mn) Forecast, by Country, 2016–2024
10.6.2.1. U.S.
10.6.2.2. Canada
10.7. Market Attractiveness Analysis
10.7.1. by Product
10.7.2. by Animal
10.7.3. by Route of Administration
10.7.4. by Country
10.8. Market Trends
Chapter 11. Europe Veterinary Drugs Market Analysis
11.1. Key Findings
11.2. Market Overview
11.3. Market Analysis, by Product
11.3.1. Market Value Share Analysis, by Product
11.3.2. Market Size (US$ Mn) Forecast, by Product
11.3.2.1. Anti-infective
11.3.2.2. Anti-inflammatory
11.3.2.3. Parasiticides
11.3.2.4. Others
11.4. Market Analysis, by Animal
11.4.1. Market Value Share Analysis, by Animal
11.4.2. Market Size (US$ Mn) Forecast, by Animal
11.4.2.1. Companion
11.4.2.2. Livestock
11.5. Market Analysis, by Route of Administration
11.5.1. Market Value Share Analysis, by Route of Administration
11.5.2. Market Size (US$ Mn) Forecast, by Route of Administration
11.5.2.1. Oral
11.5.2.2. Parenteral
11.5.2.3. Topical
11.6. Market Analysis, by Country
11.6.1. Market Value Share Analysis, by Country
11.6.2. Market Size (US$ Mn) Forecast, by Country, 2016–2024
11.6.2.1. U.K.
11.6.2.2. Germany
11.6.2.3. Italy
11.6.2.4. France
11.6.2.5. Spain
11.6.2.6. Russia
11.6.2.7. Rest of Europe
11.7. Market Attractiveness Analysis
11.7.1. by Product
11.7.2. by Animal
11.7.3. by Route of Administration
11.7.4. by Country
11.8. Market Trends
Chapter 12. Asia Pacific Veterinary Drugs Market Analysis
12.1. Key Findings
12.2. Market Overview
12.3. Market Analysis, by Product
12.3.1. Market Value Share Analysis, by Product
12.3.2. Market Size (US$ Mn) Forecast, by Product
12.3.2.1. Anti-infective
12.3.2.2. Anti-inflammatory
12.3.2.3. Parasiticides
12.3.2.4. Others
12.4. Market Analysis, by Animal
12.4.1. Market Value Share Analysis, by Animal
12.4.2. Market Size (US$ Mn) Forecast, by Animal
12.4.2.1. Companion
12.4.2.2. Livestock
12.5. Market Analysis, by Route of Administration
12.5.1. Market Value Share Analysis, by Route of Administration
12.5.2. Market Size (US$ Mn) Forecast, by Route of Administration
12.5.2.1. Oral
12.5.2.2. Parenteral
12.5.2.3. Topical
12.6. Market Analysis, by Country
12.6.1. Market Value Share Analysis, by Country
12.6.2. Market Size (US$ Mn) Forecast, by Country, 2016–2024
12.6.2.1. China
12.6.2.2. Japan
12.6.2.3. India
12.6.2.4. Australia & New Zealand
12.6.2.5. Rest of Asia Pacific
12.7. Market Attractiveness Analysis
12.7.1. by Product
12.7.2. by Animal
12.7.3. by Route of Administration
12.7.4. by Country
12.8. Market Trends
Chapter 13. Latin America Veterinary Drugs Market Analysis
13.1. Key Findings
13.2. Market Overview
13.3. Market Analysis, by Product
13.3.1. Market Value Share Analysis, by Product
13.3.2. Market Size (US$ Mn) Forecast, by Product
13.3.2.1. Anti-infective
13.3.2.2. Anti-inflammatory
13.3.2.3. Parasiticides
13.3.2.4. Others
13.4. Market Analysis, by Animal
13.4.1. Market Value Share Analysis, by Animal
13.4.2. Market Size (US$ Mn) Forecast, by Animal
13.4.2.1. Companion
13.4.2.2. Livestock
13.5. Market Analysis, by Route of Administration
13.5.1. Market Value Share Analysis, by Route of Administration
13.5.2. Market Size (US$ Mn) Forecast, by Route of Administration
13.5.2.1. Oral
13.5.2.2. Parenteral
13.5.2.3. Topical
13.6. Market Analysis, by Country
13.6.1. Market Value Share Analysis, by Country
13.6.2. Market Size (US$ Mn) Forecast, by Country, 2016–2024
13.6.2.1. Brazil
13.6.2.2. Mexico
13.6.2.3. Rest of Latin America
13.7. Market Attractiveness Analysis
13.7.1. by Product
13.7.2. by Animal
13.7.3. by Route of Administration
13.7.4. by Country
13.8. Market Trends
Chapter 14. Middle East & Africa Veterinary Drugs Market Analysis
14.1. Key Findings
14.2. Market Overview
14.3. Market Analysis, by Product
14.3.1. Market Value Share Analysis, by Product
14.3.2. Market Size (US$ Mn) Forecast, by Product
14.3.2.1. Anti-infective
14.3.2.2. Anti-inflammatory
14.3.2.3. Parasiticides
14.3.2.4. Others
14.4. Market Analysis, by Animal
14.4.1. Market Value Share Analysis, by Animal
14.4.2. Market Size (US$ Mn) Forecast, by Animal
14.4.2.1. Companion
14.4.2.2. Livestock
14.5. Market Analysis, by Route of Administration
14.5.1. Market Value Share Analysis, by Route of Administration
14.5.2. Market Size (US$ Mn) Forecast, by Route of Administration
14.5.2.1. Oral
14.5.2.2. Parenteral
14.5.2.3. Topical
14.6. Market Analysis, by Country
14.6.1. Market Value Share Analysis, by Country
14.6.2. Market Size (US$ Mn) Forecast, by Country, 2016–2024
14.6.2.1. GCC Countries
14.6.2.2. South Africa
14.6.2.3. Rest of Middle East & Africa
14.7. Market Attractiveness Analysis
14.7.1. by Product
14.7.2. by Animal
14.7.3. by Route of Administration
14.7.4. by Country
14.8. Market Trends
Chapter 15. Company Profiles
15.1. Veterinary Drugs Market Share Analysis, by Company, 2016 (Estimated)
15.2. Competition Matrix
15.3. Company Profiles
15.3.1. Bayer AG
15.3.1.1. Company Overview (HQ, Business Segments, Employee Strength)
15.3.1.2. Financial Overview
15.3.1.3. Product Portfolio
15.3.1.4. SWOT Analysis
15.3.1.5. Strategic Overview
15.3.2. Boehringer Ingelheim GmbH
15.3.2.1. Company Overview (HQ, Business Segments, Employee Strength)
15.3.2.2. Financial Overview
15.3.2.3. Product Portfolio
15.3.2.4. SWOT Analysis
15.3.2.5. Strategic Overview
15.3.3. Ceva Santé Animale
15.3.3.1. Company Overview (HQ, Business Segments, Employee Strength)
15.3.3.2. Financial Overview
15.3.3.3. Product Portfolio
15.3.3.4. SWOT Analysis
15.3.3.5. Strategic Overview
15.3.4. Dechra Pharmaceuticals PLC
15.3.4.1. Company Overview (HQ, Business Segments, Employee Strength)
15.3.4.2. Financial Overview
15.3.4.3. Product Portfolio
15.3.4.4. SWOT Analysis
15.3.4.5. Strategic Overview
15.3.5. Eli Lilly and Company (Elanco Animal Health)
15.3.5.1. Company Overview (HQ, Business Segments, Employee Strength)
15.3.5.2. Financial Overview
15.3.5.3. Product Portfolio
15.3.5.4. SWOT Analysis
15.3.5.5. Strategic Overview
15.3.6. Merck Animal Health
15.3.6.1. Company Overview (HQ, Business Segments, Employee Strength)
15.3.6.2. Financial Overview
15.3.6.3. Product Portfolio
15.3.6.4. SWOT Analysis
15.3.6.5. Strategic Overview
15.3.7. Virbac
15.3.7.1. Company Overview (HQ, Business Segments, Employee Strength)
15.3.7.2. Financial Overview
15.3.7.3. Product Portfolio
15.3.7.4. SWOT Analysis
15.3.7.5. Strategic Overview
15.3.8. Vetoquinol S.A.
15.3.8.1. Company Overview (HQ, Business Segments, Employee Strength)
15.3.8.2. Financial Overview
15.3.8.3. Product Portfolio
15.3.8.4. SWOT Analysis
15.3.8.5. Strategic Overview
15.3.9. Zoetis, Inc.
15.3.9.1. Company Overview (HQ, Business Segments, Employee Strength)
15.3.9.2. Financial Overview
15.3.9.3. Product Portfolio
15.3.9.4. SWOT Analysis
15.3.9.5. Strategic Overview
List of Tables
Table 1: Global Veterinary Drugs Market Size (US$ Mn) Forecast, by Product Type, 2014–2024
Table 2: Global Veterinary Drugs Market Size (US$ Mn) Forecast, by Animal Type Type, 2014–2024
Table 3: Global Veterinary Drugs Market Size (US$ Mn) Forecast, by Route of Administration, 2014–2024
Table 4: Global Veterinary Drugs Market Size (US$ Mn) Forecast, by Region, 2014–2024
Table 5: North America Veterinary Drugs Market Size (US$ Mn) Forecast, by Product, 2014–2024
Table 6: North America Veterinary Drugs Market Size (US$ Mn) Forecast, by Animal Type, 2014–2024
Table 7: North America Veterinary Drugs Market Size (US$ Mn) Forecast, by Route of Administration, 2014–2024
Table 8: North America Veterinary Drugs Market Size (US$ Mn) Forecast, by Country, 2014–2024
Table 9: Europe Veterinary Drugs Market Size (US$ Mn) Forecast, by Product, 2014–2024
Table 10: Europe Veterinary Drugs Market Size (US$ Mn) Forecast, by Animal Type, 2014–2024
Table 11: Europe Veterinary Drugs Market Size (US$ Mn) Forecast, by Route of Administration, 2014–2024
Table 12: Europe Veterinary Drugs Market Size (US$ Mn) Forecast, by Country, 2014–2024
Table 13: Asia Pacific Veterinary Drugs Market Size (US$ Mn) Forecast, by Product, 2014–2024
Table 14: Asia Pacific Veterinary Drugs Market Size (US$ Mn) Forecast, by Animal Type, 2014–2024
Table 15: Asia Pacific Veterinary Drugs Market Size (US$ Mn) Forecast, by Route of Administration, 2014–2024
Table 16: Asia Pacific Veterinary Drugs Market Size (US$ Mn) Forecast, by Country, 2014–2024
Table 17: Latin America Veterinary Drugs Market Size (US$ Mn) Forecast, by Product, 2014–2024
Table 18: Latin America Veterinary Drugs Market Size (US$ Mn) Forecast, by Animal Type, 2014–2024
Table 19: Latin America Veterinary Drugs Market Size (US$ Mn) Forecast, by Route of Administration, 2014–2024
Table 20: Latin America Veterinary Drugs Market Size (US$ Mn) Forecast, by Country, 2014–2024
Table 21: Middle East & Africa Veterinary Drugs Market Size (US$ Mn) Forecast, by Product, 2014–2024
Table 22: Middle East & Africa Veterinary Drugs Market Size (US$ Mn) Forecast, by Animal Type, 2014–2024
Table 23: Middle East & Africa Veterinary Drugs Market Size (US$ Mn) Forecast, by Route of Administration, 2014–2024
Table 24: Middle East & Africa Veterinary Drugs Market Size (US$ Mn) Forecast, by Country, 2014–2024
List of Figures
Figure 1: Global Veterinary Drugs Market Size (US$ Mn) Forecast and Y-o-Y Growth (%), 2014–2024
Figure 2: Global Veterinary Drugs Market Value Share, by Product Type, 2016 and 2024
Figure 3: Global Anti-infective Market Revenue (US$ Mn) and Y-o-Y Growth (%), 2014–2024
Figure 4: Global Anti-inflammatory Market Revenue (US$ Mn) and Y-o-Y Growth (%), 2014–2024
Figure 5: Global Parasiticides Market Revenue (US$ Mn) and Y-o-Y Growth (%), 2014–2024
Figure 6: Global Others Market Revenue (US$ Mn) and Y-o-Y Growth (%), 2014–2024
Figure 7: Global Veterinary Drugs Market Attractiveness Analysis, by Product Type, 2016–2024
Figure 8: Global Veterinary Drugs Market Value Share, by Animal Type, 2016 and 2024
Figure 9: Global Companion Market Revenue (US$ Mn) and Y-o-Y Growth (%), 2014–2024
Figure 10: Global Livestock Market Revenue (US$ Mn) and Y-o-Y Growth (%), 2014–2024
Figure 11: Global Veterinary Drugs Market Attractiveness Analysis, by Animal Type, 2016–2024
Figure 12: Global Veterinary Drugs Market Value Share, by Route of Administration, 2016 and 2024
Figure 13: Global Oral Route of Administration Market Revenue (US$ Mn) and Y-o-Y Growth (%), 2014–2024
Figure 14: Global Parenteral Route of Administration Market Revenue (US$ Mn) and Y-o-Y Growth (%), 2014–2024
Figure 15: Global Topical Route of Administration Market Revenue (US$ Mn) and Y-o-Y Growth (%), 2014–2024
Figure 16: Global Veterinary Drugs Market Attractiveness Analysis, by Route of Administration, 2016–2024
Figure 17: Global Veterinary Drugs Market Value Share, by Region, 2016 and 2024
Figure 18: Global Veterinary Drugs Market Attractiveness Analysis, by Region, 2016–2024
Figure 19: North America Veterinary Drugs Market Size (US$ Mn) Forecast and Y-o-Y Growth (%), 2016–2024
Figure 20: North America Veterinary Drugs Market Attractiveness Analysis, by Country
Figure 21: North America Veterinary Drugs Market Value Share, by Product, 2016 and 2024
Figure 22: North America Veterinary Drugs Market Value Share, by Animal Type, 2016 and 2024
Figure 23: North America Veterinary Drugs Market Value Share, by Route of Administration, 2016 and 2024
Figure 24: North America Veterinary Drugs Market Value Share Analysis, by Country, 2016 and 2024
Figure 25: North America Veterinary Drugs Market Attractiveness Analysis, by Product
Figure 26: North America Veterinary Drugs Market Attractiveness Analysis, by Animal Type
Figure 27: North America Veterinary Drugs Market Attractiveness Analysis, by Route of Administration
Figure 28: Europe Veterinary Drugs Market Size (US$ Mn) Forecast and Y-o-Y Growth (%), 2016–2024
Figure 29: Europe Veterinary Drugs Market Attractiveness Analysis, by Country
Figure 30: Europe Veterinary Drugs Market Value Share, by Product, 2016 and 2024
Figure 31: Europe Veterinary Drugs Market Value Share, by Animal Type, 2016 and 2024
Figure 32: Europe Veterinary Drugs Market Value Share, by Route of Administration, 2016 and 2024
Figure 33: Europe Veterinary Drugs Market Value Share Analysis, by Country, 2016 and 2024
Figure 34: Europe Veterinary Drugs Market Attractiveness Analysis, by Product
Figure 35: Europe Veterinary Drugs Market Attractiveness Analysis, by Animal Type
Figure 36: Europe Veterinary Drugs Market Attractiveness Analysis, by Route of Administration
Figure 37: Asia Pacific Veterinary Drugs Market Size (US$ Mn) Forecast and Y-o-Y Growth (%), 2016–2024
Figure 38: Asia Pacific Veterinary Drugs Market Attractiveness Analysis, by Country
Figure 39: Asia Pacific Veterinary Drugs Market Value Share, by Product, 2016 and 2024
Figure 40: Asia Pacific Veterinary Drugs Market Value Share, by Animal Type, 2016 and 2024
Figure 41: Asia Pacific Veterinary Drugs Market Value Share, by Route of Administration, 2016 and 2024
Figure 42: Asia Pacific Veterinary Drugs Market Value Share Analysis, by Country, 2016 and 2024
Figure 43: Asia Pacific Veterinary Drugs Market Attractiveness Analysis, by Product
Figure 44: Asia Pacific Veterinary Drugs Market Attractiveness Analysis, by Animal Type
Figure 45: Asia Pacific Veterinary Drugs Market Attractiveness Analysis, by Route of Administration
Figure 46: Latin America Veterinary Drugs Market Size (US$ Mn) Forecast and Y-o-Y Growth (%), 2016–2024
Figure 47: Latin America Veterinary Drugs Market Attractiveness Analysis, by Country
Figure 48: Latin America Veterinary Drugs Market Value Share, by Product, 2016 and 2024
Figure 49: Latin America Veterinary Drugs Market Value Share, by Animal Type, 2016 and 2024
Figure 50: Latin America Veterinary Drugs Market Value Share, by Route of Administration, 2016 and 2024
Figure 51: Latin America Veterinary Drugs Market Value Share Analysis, by Country, 2016 and 2024
Figure 52: Latin America Veterinary Drugs Market Attractiveness Analysis, by Product
Figure 53: Latin America Veterinary Drugs Market Attractiveness Analysis, by Animal Type
Figure 54: Latin America Veterinary Drugs Market Attractiveness Analysis, by Route of Administration
Figure 55: Middle East & Africa Veterinary Drugs Market Size (US$ Mn) Forecast and Y-o-Y Growth (%), 2016–2024
Figure 56: Middle East & Africa Veterinary Drugs Market Attractiveness Analysis, by Country
Figure 57: Middle East & Africa Veterinary Drugs Market Value Share, by Product, 2016 and 2024
Figure 58: Middle East & Africa Veterinary Drugs Market Value Share, by Animal Type, 2016 and 2024
Figure 59: Middle East & Africa Veterinary Drugs Market Value Share, by Route of Administration, 2016 and 2024
Figure 60: Middle East & Africa Veterinary Drugs Market Value Share Analysis, by Country, 2016 and 2024
Figure 61: Middle East & Africa Veterinary Drugs Market Attractiveness Analysis, by Product
Figure 62: Middle East & Africa Veterinary Drugs Market Attractiveness Analysis, by Animal Type
Figure 63: Middle East & Africa Veterinary Drugs Market Attractiveness Analysis, by Route of Administration
Figure 64: Global Veterinary Drugs Market Share Analysis, by Company, 2016 (Estimated)
Copyright © Transparency Market Research, Inc. All Rights reserved
Trust Online

Veterinary Drugs Market Insights, 2016-2024