
Reports
Reports
Analysts’ Viewpoint on Venous Diseases Treatment Market Scenario
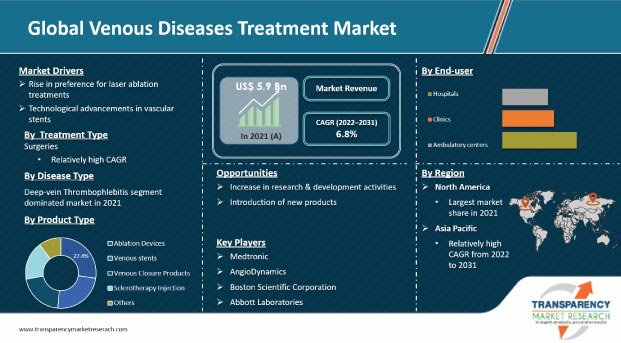
Surge in geriatric population, availability of innovative devices for the treatment of venous diseases, occupations that increase the need for venous therapy, and global technical breakthroughs are driving the venous diseases treatment market. Additionally, rise in awareness about venous diseases and their treatments is propelling the global market. Growth in number of treatment centers with private recovery facilities is resulting in treatment access to a larger population. Furthermore, increase in angioplasty operations, rise in burden of vascular illnesses, and surge in demand for minimally invasive procedures are augmenting the global market. Manufacturers should tap into incremental opportunities by focusing on technologically advanced devices for the treatment of venous diseases in order to broaden their revenue streams.
Venous disorders are diseases that affect the veins in the body. Damaged vein walls obstruct the circulatory system, enabling the blood to collect and flow backward when the muscles relax. This causes an unusually high buildup of pressure in the veins. The accumulation causes stretching and twisting of the veins, increased swelling, valve incompetence, sluggish blood flow, and formation of blood clots. This condition can eventually lead to various disorders known as venous disease. Varicose veins, also known as varicoses or varicosities, are enlarged, twisted veins that can occur anywhere in the body, but are more common in the legs. Varicose veins is one of the most common diseases caused due to damaged vein walls and valves. Rise in prevalence of varicose veins is anticipated to drive the global venous diseases treatment market. According to an article published in the Journal of the American Heart Association, around 23% of adults in the U.S. have varicose veins. Annually, organizations such as the British Association of Sclerotherapies (BAS) launch initiatives to raise awareness and encourage the use of various venous disease treatments. Rise in awareness about deep vein thrombosis treatment, chronic venous occlusions treatment, venous insufficiency treatment, and leg ulcer treatment; and growth in number of product approvals are driving the market. For instance, in November 2020, Vascular Barcelona Devices (VB Devices) received the CE mark approval for Varixio Pod Air, as a Class 1s medical device intended for automated foam preparation for varicose veins sclerotherapy.
Laser ablation treatment does not require lengthy hospital stays. It also does not cause discomfort during the recovery process. Adoption of lasers in varicose vein treatment has increased due to the development of novel technologies and advancements in research activities by key players in the market. Doctors are using laser ablation technology to close smaller varicose and spider veins. This treatment involves directing intense bursts of light at the affected veins, causing them to fade or disappear. The usage of laser treatment is increasing in developed countries due to the rise in healthcare costs and growth in preference for non-invasive procedures.
According to a study published in the British Journal of Surgery in May 2022 titled, "Compression following treatment of superficial venous incompetence: systematic review," laser ablation therapy was cost-effective and the preferred initial treatment for symptomatic venous diseases with a diameter of at least 3 mm and evidence of saphenous vein reflux.
Technological advancements in vascular stents, increase in demand for minimally invasive procedures, and rise in geriatric population are some of the factors driving the global market. Companies are expanding their product portfolio to offer the best services for venous diseases. For instance, in March 2022, Cordis, a global cardiovascular technology company, announced that the FDA approved the S.M.A.R.T. RADIANZ Vascular Stent System, a self-expanding stent designed specifically for radial peripheral procedures. The S.M.A.R.T. RADIANZ Vascular Stent System enables accurate and efficient placement of a stent in the iliac and superficial femoral (SFA) arteries.
In December 2021, Royal Philips, a global leader in health technology, announced that it had agreed to acquire Vesper Medical Inc., a medical technology company based in the U.S., which develops minimally invasive peripheral vascular devices. Vesper Medical would add an advanced venous stent portfolio for the treatment of deep venous disease to Philips' portfolio of diagnostic and therapeutic devices.
In terms of treatment type, the surgeries segment is projected to dominate the global market with 57% share by 2031. Vascular surgery is a surgical subspecialty that treats diseases of the vascular system, which includes arteries, veins, and lymphatic circulation, through medical therapy, minimally invasive catheter procedures, and surgical reconstruction. Vascular diseases are treated using both open surgery and endovascular techniques. Rise in prevalence of varicose veins due to obesity, phlebitis, congenital abnormalities in veins, and blood clots is driving the demand for new treatments. Therefore, companies are offering innovative products, which in turn is propelling the market.
Based on disease type, the varicose veins segment dominated the global market with around 24% share in 2021. Rise in prevalence of small and greater saphenous vein, reticular varicose vein, and genital area varicose veins have prompted people to be more aware and educated about varicose vein warning signals and the importance of a prompt response. In July 2019, India Medtronic Private Limited, a subsidiary of Medtronic plc, launched VenaSeal Closure System in India. This led to an improvement in the quality of life of patients living with varicose veins.
In terms of product type, the ablation devices segment led the global market with around 27% share in 2021. Ablation devices are medical devices used in minimally invasive procedures to remove or excise abnormal body tissues for therapeutic purposes. These systems use the heat generated by radio frequency, energy, extreme cold, or a laser to cause small burns. Rise in adoption of robotic technologies for product application expansion and integration of cutting-edge technologies in ablation devices to improve patient safety and procedural efficiency are expected to drive the segment. Increase in adoption of ablation devices is creating lucrative opportunities for manufacturers in the global venous diseases treatment market.
In terms of end-user, the hospitals segment is projected to dominate the global market with 43% share by 2031. Several hospitals provide treatments for venous diseases. These treatments include endovenous ablation or endovenous laser ablation, radiofrequency ablation, and stripping or surgical ligation. Most surgeons adopt traditional approaches due to high success rates and increase in number of patients preferring traditional approaches. Surge in number of hospitals across the globe along with comparatively higher performance and adoption of minimally invasive surgeries (MISs) in these settings is driving the hospitals segment.
North America dominated the global venous diseases treatment market in 2021. The market in the region is anticipated to grow at a CAGR of 6.8% from 2022 to 2031. It is expected to witness strong growth due to various strategies adopted by key players for market expansion such as product launches, mergers and acquisitions, and collaborations. For instance, in April 2021, Medtronic began an Investigation Device Exemption (IDE) study to determine the efficacy and safety of the Abre venous self-expanding stent device, which is used to treat deep venous disorders.
According to a study titled "Risk assessment for varicose veins among city Police-A cross-sectional study" that was published in Clinical Epidemiology and Global Health in December 2021, in the U.S., around 23% of adults have varicose veins. The prevalence increases to 80% in males and 85% in women when spider telangiectasias and reticular veins are considered. Thus, rise in prevalence of varicose veins among the population of the U.S. is projected to augment the venous diseases treatment market in North America during the forecast period.
The global venous diseases treatment market report concludes with the company profiles section, which includes information about key players in the global venous diseases treatment market. Leading players analyzed in the report are Medtronic, AngioDynamics, Alma Lasers, biolitec AG Untere Viaduktgasse, Becton Dickinson and Company, Boston Scientific Corporation, Abbott Laboratories, B. Braun Melsungen Ag, Teleflex Incorporated, Lumenis, and Philips.
Each of these players has been profiled in the global venous diseases treatment market report based on parameters such as company overview, financial overview, business strategies, application portfolio, business segments, and recent developments.
|
Attribute |
Detail |
|
Market Size Value in 2021 |
US$ 5.9 Bn |
|
Market Forecast Value in 2031 |
More than US$ 11.3 Bn |
|
Growth Rate (CAGR) |
6.8% |
|
Forecast Period |
2022-2031 |
|
Historical Data Available for |
2017-2020 |
|
Quantitative Units |
US$ Bn for Value |
|
Market Analysis |
It includes segment analysis as well as regional level analysis. Moreover, qualitative analysis includes drivers, restraints, opportunities, key trends, and parent industry overview. |
|
Competition Landscape |
|
|
Format |
Electronic (PDF) + Excel |
|
Market Segmentation |
|
|
Regions Covered |
|
|
Countries Covered |
|
|
Companies Profiled |
|
|
Customization Scope |
Available upon request |
|
Pricing |
Available upon request |
The global venous diseases treatment market was valued at US$ 5.9 Bn in 2021.
The global venous diseases treatment market is projected to reach more than US$ 11.3 Bn by 2031.
The global venous diseases treatment market is anticipated to grow at a CAGR of 6.8% from 2022 to 2031.
New product launches and rise in awareness about the benefits of venous diseases treatment are driving the global market.
The surgeries segment held over 57% share of the global venous diseases treatment market in 2021.
North America is expected to account for major share of the global venous diseases treatment market during the forecast period.
Medtronic, AngioDynamics, Alma Lasers, Biolitec AG Untere Viaduktgasse, Becton, Dickinson and Company, Boston Scientific Corporation, Abbott Laboratories, B. Braun Melsungen Ag, Teleflex Incorporated, Lumenis, and Philips.
1. Preface
1.1. Market Definition and Scope
1.2. Market Segmentation
1.3. Key Research Objectives
1.4. Research Highlights
2. Assumptions and Research Methodology
3. Executive Summary: Global Venous Diseases Treatment Market
4. Market Overview
4.1. Introduction
4.1.1. Segment Definition
4.1.2. Industry Evolution / Developments
4.2. Overview
4.3. Market Dynamics
4.3.1. Drivers
4.3.2. Restraints
4.3.3. Opportunities
4.4. Porter’s Five Force Analysis
5. Key Insights
5.1. Regulatory Scenario by Region/globally
5.2. Technological Advancements
5.3. Pipeline Analysis
5.4. Key Mergers & Acquisitions
5.5. Disease Prevalence & Incidence Rate globally with key countries
5.6. Reimbursement Scenario by Region/globally
6. Global Venous Diseases Treatment Analysis and Forecast, by Treatment Type
6.1. Introduction & Definition
6.2. Key Findings / Developments
6.3. Market Value Forecast, by Treatment, 2017–2031
6.3.1. Surgeries
6.3.1.1. Angioplasty or Stenting
6.3.1.2. Vein Ligation and Stripping
6.3.1.3. Vena Cava Filter
6.3.1.4. Ambulatory Phlebectomy
6.3.1.5. Others
6.3.2. Therapies
6.3.2.1. Sclerotherapy
6.3.2.2. Radiofrequency Ablation Therapy
6.3.2.3. Laser Treatment
6.4. Market Attractiveness Analysis, by Treatment
7. Global Venous Diseases Treatment Analysis and Forecast, by Disease Type
7.1. Introduction & Definition
7.2. Key Findings / Developments
7.3. Market Value Forecast, by Disease Type, 2017–2031
7.3.1. Deep-vein Thrombophlebitis
7.3.2. Varicose Veins
7.3.3. Superficial Thrombophlebitis
7.3.4. Chronic Venous Insufficiency
7.3.5. Venous Ulcers
7.3.6. Others
7.4. Market Attractiveness Analysis, by Disease Type
8. Global Venous Diseases Treatment Analysis and Forecast, by Product Type
8.1. Introduction & Definition
8.2. Key Findings / Developments
8.3. Market Value Forecast, by Product Type, 2017–2031
8.3.1. Ablation Devices
8.3.2. Venous Stents
8.3.3. Venous Closure Treatments
8.3.4. Sclerotherapy Injection
8.3.5. Others
8.4. Market Attractiveness Analysis, by Product Type
9. Global Venous Diseases Treatment Analysis and Forecast, by End-user
9.1. Introduction & Definition
9.2. Key Findings / Developments
9.3. Market Value Forecast, by End-user, 2017–2031
9.3.1. Hospitals
9.3.2. Clinics
9.3.3. Ambulatory centers
9.4. Market Attractiveness Analysis, by End-user
10. Global Venous Diseases Treatment Analysis and Forecast, by Region
10.1. Key Findings
10.2. Market Value Forecast, by Region
10.2.1. North America
10.2.2. Europe
10.2.3. Asia Pacific
10.2.4. Latin America
10.2.5. Middle East & Africa
10.3. Market Attractiveness Analysis, by Region
11. North America Venous Diseases Treatment Analysis and Forecast
11.1. Introduction
11.1.1. Key Findings
11.2. Market Value Forecast, by Treatment, 2017–2031
11.2.1. Surgeries
11.2.1.1. Angioplasty or Stenting
11.2.1.2. Vein Ligation and Stripping
11.2.1.3. Vena Cava Filter
11.2.1.4. Ambulatory Phlebectomy
11.2.1.5. Others
11.2.2. Therapies
11.2.2.1. Sclerotherapy
11.2.2.2. Radiofrequency Ablation Therapy
11.2.2.3. Laser Treatment
11.3. Market Value Forecast, by Disease Type, 2017–2031
11.3.1. Deep-vein Thrombophlebitis
11.3.2. Varicose Veins
11.3.3. Superficial Thrombophlebitis
11.3.4. Chronic Venous Insufficiency
11.3.5. Venous Ulcers
11.3.6. Others
11.4. Market Value Forecast, by Product Type, 2017–2031
11.4.1. Ablation Devices
11.4.2. Venous Stents
11.4.3. Venous Closure Treatments
11.4.4. Sclerotherapy Injection
11.4.5. Others
11.5. Market Value Forecast, by End-user, 2017–2031
11.5.1. Hospitals
11.5.2. Clinics
11.5.3. Ambulatory centers
11.6. Market Value Forecast, by Country/Sub-region, 2017–2031
11.6.1. U.S.
11.6.2. Canada
11.7. Market Attractiveness Analysis
11.7.1. By Treatment
11.7.2. By Disease Type
11.7.3. By Product Type
11.7.4. By End-user
11.7.5. By Country/Sub-region
12. Europe Venous Diseases Treatment Analysis and Forecast
12.1. Introduction
12.1.1. Key Findings
12.2. Market Value Forecast, by Treatment, 2017–2031
12.2.1. Surgeries
12.2.1.1. Angioplasty or Stenting
12.2.1.2. Vein Ligation and Stripping
12.2.1.3. VeEnd Use Cava Filter
12.2.1.4. Ambulatory Phlebectomy
12.2.1.5. Others
12.2.2. Therapies
12.2.2.1. Sclerotherapy
12.2.2.2. Radiofrequency Ablation Therapy
12.2.2.3. Laser Treatment
12.3. Market Value Forecast, by Disease Type, 2017–2031
12.3.1. Deep-vein Thrombophlebitis
12.3.2. Varicose Veins
12.3.3. Superficial Thrombophlebitis
12.3.4. Chronic Venous Insufficiency
12.3.5. Venous Ulcers
12.3.6. Others
12.4. Market Value Forecast, by Product Type, 2017–2031
12.4.1. Ablation Devices
12.4.2. Venous Stents
12.4.3. Venous Closure Treatments
12.4.4. Sclerotherapy Injection
12.4.5. Others
12.5. Market Value Forecast, by End-user, 2017–2031
12.5.1. Hospitals
12.5.2. Clinics
12.5.3. Ambulatory centers
12.6. Market Value Forecast, by Country/Sub-region, 2017–2031
12.6.1. Germany
12.6.2. U.K.
12.6.3. France
12.7. Market Attractiveness Analysis
12.7.1. By Treatment
12.7.2. By Disease Type
12.7.3. By Product Type
12.7.4. By End-user
12.7.5. By Country/Sub-region
13. Asia Pacific Venous Diseases Treatment Analysis and Forecast
13.1. Introduction
13.1.1. Key Findings
13.2. Market Value Forecast, by Treatment, 2017–2031
13.2.1. Surgeries
13.2.1.1. Angioplasty or Stenting
13.2.1.2. Vein Ligation and Stripping
13.2.1.3. VeEnd Use Cava Filter
13.2.1.4. Ambulatory Phlebectomy
13.2.1.5. Others
13.2.2. Therapies
13.2.2.1. Sclerotherapy
13.2.2.2. Radiofrequency Ablation Therapy
13.2.2.3. Laser Treatment
13.3. Market Value Forecast, by Disease Type, 2017–2031
13.3.1. Deep-vein Thrombophlebitis
13.3.2. Varicose Veins
13.3.3. Superficial Thrombophlebitis
13.3.4. Chronic Venous Insufficiency
13.3.5. Venous Ulcers
13.3.6. Others
13.4. Market Value Forecast, by Product Type, 2017–2031
13.4.1. Ablation Devices
13.4.2. Venous Stents
13.4.3. Venous Closure Treatments
13.4.4. Sclerotherapy Injection
13.4.5. Others
13.5. Market Value Forecast, by End-user, 2017–2031
13.5.1. Hospitals
13.5.2. Clinics
13.5.3. Ambulatory centers
13.6. Market Value Forecast, by Country/Sub-region, 2017–2031
13.6.1. China
13.6.2. Japan
13.6.3. India
13.6.4. Australia & New Zealand
13.6.5. Rest of Asia Pacific
13.7. Market Attractiveness Analysis
13.7.1. By Treatment
13.7.2. By Disease Type
13.7.3. By Product Type
13.7.4. By End-user
13.7.5. By Country/Sub-region
14. Latin America Venous Diseases Treatment Analysis and Forecast
14.1. Introduction
14.1.1. Key Findings
14.2. Market Value Forecast, by Treatment, 2017–2031
14.2.1. Surgeries
14.2.1.1. Angioplasty or Stenting
14.2.1.2. Vein Ligation and Stripping
14.2.1.3. VeEnd Use Cava Filter
14.2.1.4. Ambulatory Phlebectomy
14.2.1.5. Others
14.2.2. Therapies
14.2.2.1. Sclerotherapy
14.2.2.2. Radiofrequency Ablation Therapy
14.2.2.3. Laser Treatment
14.3. Market Value Forecast, by Disease Type, 2017–2031
14.3.1. Deep-vein Thrombophlebitis
14.3.2. Varicose Veins
14.3.3. Superficial Thrombophlebitis
14.3.4. Chronic Venous Insufficiency
14.3.5. Venous Ulcers
14.3.6. Others
14.4. Market Value Forecast, by Product Type, 2017–2031
14.4.1. Ablation Devices
14.4.2. Venous Stents
14.4.3. Venous Closure Treatments
14.4.4. Sclerotherapy Injection
14.4.5. Others
14.5. Market Value Forecast, by End-user, 2017–2031
14.5.1. Hospitals
14.5.2. Clinics
14.5.3. Ambulatory centers
14.6. Market Value Forecast, by Country/Sub-region, 2017 – 2031
14.6.1. Brazil
14.6.2. Mexico
14.6.3. Rest of Latin America
14.7. Market Attractiveness Analysis
14.7.1. By Treatment
14.7.2. By Disease Type
14.7.3. By Product Type
14.7.4. By End-user
14.7.5. By Country/Sub-region
15. Middle East & Africa Venous Diseases Treatment Analysis and Forecast
15.1. Introduction
15.1.1. Key Findings
15.2. Market Value Forecast, by Treatment, 2017–2031
15.2.1. Surgeries
15.2.1.1. Angioplasty or Stenting
15.2.1.2. Vein Ligation and Stripping
15.2.1.3. VeEnd Use Cava Filter
15.2.1.4. Ambulatory Phlebectomy
15.2.1.5. Others
15.2.2. Therapies
15.2.2.1. Sclerotherapy
15.2.2.2. Radiofrequency Ablation Therapy
15.2.2.3. Laser Treatment
15.3. Market Value Forecast, by Disease Type, 2017–2031
15.3.1. Deep-vein Thrombophlebitis
15.3.2. Varicose Veins
15.3.3. Superficial Thrombophlebitis
15.3.4. Chronic Venous Insufficiency
15.3.5. Venous Ulcers
15.3.6. Others
15.4. Market Value Forecast, by Product Type, 2017–2031
15.4.1. Ablation Devices
15.4.2. Venous Stents
15.4.3. Venous Closure Treatments
15.4.4. Sclerotherapy Injection
15.4.5. Others
15.5. Market Value Forecast, by End-user, 2017–2031
15.5.1. Hospitals
15.5.2. Clinics
15.5.3. Ambulatory centers
15.6. Market Value Forecast, by Country/Sub-region, 2017–2031
16. Competitive Landscape
16.1. Market Player - Competition Matrix (by tier and size of companies)
16.2. Market Share Analysis, by Company, 2021
16.3. Company Profiles
16.3.1. Zimmer Biomet Holdings, Inc.
16.3.1.1. Company Overview (HQ, Business Segments, Employee Strength)
16.3.1.2. Company Financials
16.3.1.3. Growth Strategies
16.3.1.4. SWOT Analysis
16.3.2. Medtronic
16.3.2.1. Company Overview (HQ, Business Segments, Employee Strength)
16.3.2.2. Company Financials
16.3.2.3. Growth Strategies
16.3.2.4. SWOT Analysis
16.3.3. AngioDynamics
16.3.3.1. Company Overview (HQ, Business Segments, Employee Strength)
16.3.3.2. Company Financials
16.3.3.3. Growth Strategies
16.3.3.4. SWOT Analysis
16.3.4. Alma Lasers
16.3.4.1. Company Overview (HQ, Business Segments, Employee Strength)
16.3.4.2. Company Financials
16.3.4.3. Growth Strategies
16.3.4.4. SWOT Analysis
16.3.5. Biolitec AG Untere Viaduktgasse
16.3.5.1. Company Overview (HQ, Business Segments, Employee Strength)
16.3.5.2. Company Financials
16.3.5.3. Growth Strategies
16.3.5.4. SWOT Analysis
16.3.6. Becton, Dickinson and Company
16.3.6.1. Company Overview (HQ, Business Segments, Employee Strength)
16.3.6.2. Company Financials
16.3.6.3. Growth Strategies
16.3.6.4. SWOT Analysis
16.3.7. Boston Scientific Corporation
16.3.7.1. Company Overview (HQ, Business Segments, Employee Strength)
16.3.7.2. Company Financials
16.3.7.3. Growth Strategies
16.3.7.4. SWOT Analysis
16.3.8. Abbott Laboratories
16.3.8.1. Company Overview (HQ, Business Segments, Employee Strength)
16.3.8.2. Company Financials
16.3.8.3. Growth Strategies
16.3.8.4. SWOT Analysis
16.3.9. B. Braun Melsungen AG
16.3.9.1. Company Overview (HQ, Business Segments, Employee Strength)
16.3.9.2. Company Financials
16.3.9.3. Growth Strategies
16.3.9.4. SWOT Analysis
16.3.10. Teleflex Incorporated
16.3.10.1. Company Overview (HQ, Business Segments, Employee Strength)
16.3.10.2. Company Financials
16.3.10.3. Growth Strategies
16.3.10.4. SWOT Analysis
16.3.11. Lumenis
16.3.11.1. Company Overview (HQ, Business Segments, Employee Strength)
16.3.11.2. Company Financials
16.3.11.3. Growth Strategies
16.3.11.4. SWOT Analysis
16.3.12. Philips
16.3.12.1. Company Overview (HQ, Business Segments, Employee Strength)
16.3.12.2. Company Financials
16.3.12.3. Growth Strategies
16.3.12.4. SWOT Analysis
List of Tables
Table 01: Global Venous Diseases Treatment Revenue (US$ Bn) Forecast, by Treatment Type, 2017–2031
Table 02: Global Venous Diseases Treatment Value (US$ Bn) Forecast, by Disease Type, 2017‒2031
Table 03: Global Venous Diseases Treatment Revenue (US$ Bn) Forecast, by Product Type, 2017–2031
Table 04: Global Venous Diseases Treatment Value (US$ Bn) Forecast, by End-use, 2017‒2031
Table 05: Global Venous Diseases Treatment Value (US$ Bn) Forecast, by Region, 2017–2031
Table 06: North America Venous Diseases Treatment Value (US$ Bn) Forecast, by Country, 2017–2031
Table 07: North America Venous Diseases Treatment Revenue (US$ Bn) Forecast, by Treatment Type, 2017–2031
Table 08: North America Venous Diseases Treatment Value (US$ Bn) Forecast, by Disease Type, 2017‒2031
Table 09: North America Venous Diseases Treatment Revenue (US$ Bn) Forecast, by Product Type, 2017–2031
Table 10: North America Venous Diseases Treatment Value (US$ Bn) Forecast, by End-use, 2017‒2031
Table 11: Europe Venous Diseases Treatment Value (US$ Bn) Forecast, by Country/Sub-region, 2017–2031
Table 12: Europe Venous Diseases Treatment Revenue (US$ Bn) Forecast, by Treatment Type, 2017–2031
Table 13: Europe Venous Diseases Treatment Value (US$ Bn) Forecast, by Disease Type, 2017‒2031
Table 14: Europe Venous Diseases Treatment Revenue (US$ Bn) Forecast, by Product Type, 2017–2031
Table 15: Europe Venous Diseases Treatment Value (US$ Bn) Forecast, by End-use, 2017‒2031
Table 16: Asia Pacific Venous Diseases Treatment Value (US$ Bn) Forecast, by Country/Sub-region, 2017–2031
Table 17: Asia Pacific Venous Diseases Treatment Revenue (US$ Bn) Forecast, by Treatment Type, 2017–2031
Table 18: Asia Pacific Venous Diseases Treatment Value (US$ Bn) Forecast, by Disease Type, 2017‒2031
Table 19: Asia Pacific Venous Diseases Treatment Revenue (US$ Bn) Forecast, by Product Type, 2017–2031
Table 20: Asia Pacific Venous Diseases Treatment Value (US$ Bn) Forecast, by End-use, 2017‒2031
Table 21: India Venous Diseases Treatment Revenue (US$ Bn) Forecast, by Treatment Type, 2017–2031
Table 22: India Venous Diseases Treatment Value (US$ Bn) Forecast, by Disease Type, 2017‒2031
Table 23: India Venous Diseases Treatment Revenue (US$ Bn) Forecast, by Product Type, 2017–2031
Table 24: India Venous Diseases Treatment Value (US$ Bn) Forecast, by End-use, 2017‒2031
Table 25: Latin America Venous Diseases Treatment Value (US$ Bn) Forecast, by Country/Sub-region, 2017–2031
Table 26: Latin America Venous Diseases Treatment Revenue (US$ Bn) Forecast, by Treatment Type, 2017–2031
Table 27: Latin America Venous Diseases Treatment Value (US$ Bn) Forecast, by Disease Type, 2017‒2031
Table 28: Latin America Venous Diseases Treatment Revenue (US$ Bn) Forecast, by Product Type, 2017–2031
Table 29: Latin America Venous Diseases Treatment Value (US$ Bn) Forecast, by End-use, 2017‒2031
Table 30: Middle East & Africa Venous Diseases Treatment Value (US$ Bn) Forecast, by Country/Sub-region, 2017–2031
Table 31: Middle East & Africa Venous Diseases Treatment Revenue (US$ Bn) Forecast, by Treatment Type, 2017–2031
Table 32: Middle East & Africa Venous Diseases Treatment Value (US$ Bn) Forecast, by Disease Type, 2017‒2031
Table 33: Middle East & Africa Venous Diseases Treatment Revenue (US$ Bn) Forecast, by Product Type, 2017–2031
Table 34: Middle East & Africa Venous Diseases Treatment Value (US$ Bn) Forecast, by End-use, 2017‒2031
List of Figures
Figure 01: Global Venous Diseases Treatment Value Share Analysis, by Treatment Type, 2021 and 2031
Figure 02: Global Venous Diseases Treatment Attractiveness Analysis, by Treatment Type, 2022–2031
Figure 03: Global Venous Diseases Treatment Revenue (US$ Bn), by Surgeries, 2017–2031
Figure 04: Global Venous Diseases Treatment Revenue (US$ Bn), by Therapies, 2017–2031
Figure 05: Global Venous Diseases Treatment Value (US$ Bn) Forecast, by Disease Type, 2017–2031
Figure 06: Global Venous Diseases Treatment Value (US$ Bn) Forecast, by Product Type, 2017–2031
Figure 07: Global Venous Diseases Treatment Value Share Analysis, by End-use, 2021 and 2031
Figure 08: Global Venous Diseases Treatment Attractiveness Analysis, by Angioplasty or Stenting, 2022–2031
Figure 09: Global Venous Diseases Treatment Value (US$ Bn) Forecast, by Vein Ligation and stripping, 2017–2031
Figure 10: Global Venous Diseases Treatment Value (US$ Bn) Forecast, by Vena Cava Filter, 2017–2031
Figure 11: Global Venous Diseases Treatment Value Share Analysis, by Ambulatory Phlebectomy Type, 2021 and 2031
Figure 12: Global Venous Diseases Treatment Attractiveness Analysis, by Others, 2022–2031
Figure 13: Global Venous Diseases Treatment Revenue (US$ Bn), by Sclerotherapy, 2017–2031
Figure 14: Global Venous Diseases Treatment Revenue (US$ Bn), by Laser treatment, 2017–2031
Figure 15: Global Venous Diseases Treatment Value (US$ Bn) Forecast, by Radiofrequency ablation therapy, 2017–2031
Figure 16: Global Venous Diseases Treatment Value (US$ Bn) Forecast, by Varicose Veins 2017–2031
Figure 17: Global Venous Diseases Treatment Value Share Analysis, by Superficial Thrombophlebitis, 2021 and 2031
Figure 18: Global Venous Diseases Treatment Attractiveness Analysis, by Deep-vein Thrombophlebitis, 2022–2031
Figure 19: Global Venous Diseases Treatment Value (US$ Bn) Forecast, by Chronic Venous Insufficiency, 2017–2031
Figure 20: Global Venous Diseases Treatment Value (US$ Bn) Forecast, by Venous ulcers, 2017–2031
Figure 21: Global Venous Diseases Treatment Value (US$ Bn) Forecast, by Others, 2017–2031
Figure 22: Global Venous Diseases Treatment Value (US$ Bn) Forecast, by Ablation Devices, 2017–2031
Figure 23: Global Venous Diseases Treatment Value (US$ Bn) Forecast, by Sclerotherapy Injection, 2017–2031
Figure 24: Global Venous Diseases Treatment Attractiveness Analysis, by Venous Closure Treatments, 2022–2031
Figure 25: Global Venous Diseases Treatment Value (US$ Bn) Forecast, by Venous stents
Figure 26: Global Venous Diseases Treatment Value (US$ Bn) Forecast, by Others, 2017–2031
Figure 27: Global Venous Diseases Treatment Value (US$ Bn) Forecast, by Hospitals, 2017–2031
Figure 28: Global Venous Diseases Treatment Value (US$ Bn) Forecast, by Clinics, 2017–2031
Figure 29: Global Venous Diseases Treatment Value (US$ Bn) Forecast, by Ambulatory centers, 2017–2031
Figure 30: Global Venous Diseases Treatment Value Share Analysis, by Region, 2021 and 2031
Figure 31: Global Venous Diseases Treatment Attractiveness Analysis, by Region, 2022-2031
Figure 32: North America Venous Diseases Treatment Value (US$ Bn) Forecast, 2017–2031
Figure 33: North America Venous Diseases Treatment Value Share Analysis, by Country, 2021 and 2031
Figure 34: North America Venous Diseases Treatment Attractiveness Analysis, by Country, 2022–2031
Figure 35: North America Venous Diseases Treatment Value Share Analysis, by Treatment Type, 2021 and 2031
Figure 36: North America Venous Diseases Treatment Attractiveness Analysis, by Treatment Type, 2022–2031
Figure 37: North America Venous Diseases Treatment Value Share Analysis, by Disease Type, 2021 and 2031
Figure 38: North America Venous Diseases Treatment Attractiveness Analysis, by Disease Type, 2022–2031
Figure 39: North America Venous Diseases Treatment Value Share Analysis, by Product Type, 2021 and 2031
Figure 40: North America Venous Diseases Treatment Attractiveness Analysis, by Product Type, 2022–2031
Figure 41: North America Venous Diseases Treatment Value Share Analysis, by End-use, 2021 and 2031
Figure 36: North America Venous Diseases Treatment Attractiveness Analysis, by End-use, 2022–2031
Figure 37: Europe Venous Diseases Treatment Value (US$ Bn) Forecast, 2017–2031
Figure 38: Europe Venous Diseases Treatment Value Share Analysis, by Country/Sub-region, 2021 and 2031
Figure 39: Europe Venous Diseases Treatment Attractiveness Analysis, by Country/Sub-region, 2022–2031
Figure 40: Europe Venous Diseases Treatment Value Share Analysis, by Treatment Type, 2021 and 2031
Figure 41: Europe Venous Diseases Treatment Attractiveness Analysis, by Treatment Type, 2022–2031
Figure 42: Europe Venous Diseases Treatment Value Share Analysis, by Disease Type, 2021 and 2031
Figure 43: Europe Venous Diseases Treatment Attractiveness Analysis, by Disease Type, 2022–2031
Figure 44: Europe Venous Diseases Treatment Value Share Analysis, by Product Type, 2021 and 2031
Figure 45: Europe Venous Diseases Treatment Attractiveness Analysis, by Product Type, 2022–2031
Figure 46: Europe Venous Diseases Treatment Value Share Analysis, by End-use, 2021 and 2031
Figure 47: Europe Venous Diseases Treatment Attractiveness Analysis, by End-use, 2022–2031
Figure 48: Asia Pacific Venous Diseases Treatment Value (US$ Bn) Forecast, 2017–2031
Figure 49: Asia Pacific Venous Diseases Treatment Value Share Analysis, by Country/Sub-region, 2021 and 2031
Figure 50: Asia Pacific Venous Diseases Treatment Attractiveness Analysis, by Country/Sub-region, 2022–2031
Figure 51: Asia Pacific Venous Diseases Treatment Value Share Analysis, by Treatment Type, 2021 and 2031
Figure 52: Asia Pacific Venous Diseases Treatment Attractiveness Analysis, by Treatment Type, 2022–2031
Figure 53: Asia Pacific Venous Diseases Treatment Value Share Analysis, by Disease Type, 2021 and 2031
Figure 54: Asia Pacific Venous Diseases Treatment Attractiveness Analysis, by Disease Type, 2022–2031
Figure 55: Asia Pacific Venous Diseases Treatment Value Share Analysis, by Product Type, 2021 and 2031
Figure 56: Asia Pacific Venous Diseases Treatment Attractiveness Analysis, by Product Type, 2022–2031
Figure 57: Asia Pacific Venous Diseases Treatment Value Share Analysis, by End-use, 2021 and 2031
Figure 58: Asia Pacific Venous Diseases Treatment Attractiveness Analysis, by End-use, 2022–2031
Figure 59: Latin America Venous Diseases Treatment Value (US$ Bn) Forecast, 2017–2031
Figure 60: Latin America Venous Diseases Treatment Value Share Analysis, by Country/Sub-region, 2021 and 2031
Figure 61: Latin America Venous Diseases Treatment Attractiveness Analysis, by Country/Sub-region, 2022–2031
Figure 62: Latin America Venous Diseases Treatment Value Share Analysis, by Treatment Type, 2021 and 2031
Figure 63: Latin America Venous Diseases Treatment Attractiveness Analysis, by Treatment Type, 2022–2031
Figure 64: Latin America Venous Diseases Treatment Value Share Analysis, by Disease Type, 2021 and 2031
Figure 65: Latin America Venous Diseases Treatment Attractiveness Analysis, by Disease Type, 2022–2031
Figure 66: Latin America Venous Diseases Treatment Value Share Analysis, by Product Type, 2021 and 2031
Figure 67: Latin America Venous Diseases Treatment Attractiveness Analysis, by Product Type, 2022–2031
Figure 68: Latin America Venous Diseases Treatment Value Share Analysis, by End-use, 2021 and 2031
Figure 69: Latin America Venous Diseases Treatment Attractiveness Analysis, by End-use, 2022–2031
Figure 70: Middle East & Africa Venous Diseases Treatment Value (US$ Bn) Forecast, 2017–2031
Figure 71: Middle East & Africa Venous Diseases Treatment Value Share Analysis, by Country/Sub-region, 2021 and 2031
Figure 72: Middle East & Africa Venous Diseases Treatment Attractiveness Analysis, by Country/Sub-region, 2022–2031
Figure 73: Middle East & Africa Venous Diseases Treatment Value Share Analysis, by Treatment Type, 2021 and 2031
Figure 74: Middle East & Africa Venous Diseases Treatment Attractiveness Analysis, by Treatment Type, 2022–2031
Figure 75: Middle East & Africa Venous Diseases Treatment Value Share Analysis, by Disease Type, 2021 and 2031
Figure 76: Middle East & Africa Venous Diseases Treatment Attractiveness Analysis, by Disease Type, 2022–2031
Figure 77: Middle East & Africa Venous Diseases Treatment Value Share Analysis, by Product Type, 2021 and 2031
Figure 78: Middle East & Africa Venous Diseases Treatment Attractiveness Analysis, by Product Type, 2022–2031
Figure 79: Middle East & Africa Venous Diseases Treatment Value Share Analysis, by End-use, 2021 and 2031
Figure 80: Middle East & Africa Venous Diseases Treatment Attractiveness Analysis, by End-use, 2022–2031
Figure 81: Company Market Share Analysis, 2021
Copyright © Transparency Market Research, Inc. All Rights reserved
Trust Online

Venous Diseases Treatment Market