
Reports
Reports
Analysts’ Viewpoint on Vehicle Cameras Market Scenario
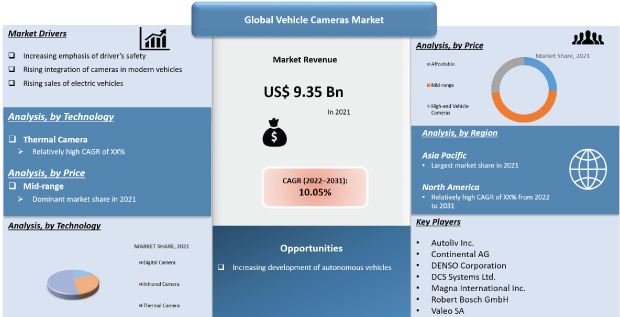
Increasing vehicle production across the globe, government safety norms, consumer demand for safer vehicles, growing emphasis on drivers]’ safety, rising integration of cameras in modern vehicles, and surging sales of electric vehicles are some of the key factors driving the vehicle cameras market. Manufacturers should tap into incremental opportunities in developing technologically advanced products to broaden their revenue streams. Furthermore, all companies should increase their R&D efforts in the development of advanced cameras integrated with the advanced driver assistance system (ADAS). Government initiatives related to vehicle safety features in economically-advanced countries are also projected to propel the market for vehicle cameras during the forecast period.
The vehicle camera is intentionally designed to capture the highest quality images and videos to enhance driver safety. It is integrated with advanced technology, such as computer vision algorithms, which, in response, can extract important data that can be useful for driver assistance. It is extensively utilized in advanced driver assistance systems (ADAS). It helps the driver park his vehicle with ease. A dashboard camera, also known as a car digital video recorder, driving recorder, or event data recorder (EDR), is an onboard camera that continuously records the view through a vehicle's front windscreen and sometimes rear or other windows. Externally mounted cameras help the driver maintain a safe distance from the leading vehicles, identify pedestrians and avoid them, and track road edges. They also provide enhanced night vision using HUD. Internally mounted automotive camera & camera module system detect drowsy drivers and set off an alarm and identify the occupant on the passenger seat for the proper deployment of an airbag.
Every year, the lives of approximately 1.3 million people are lost due to road traffic crashes. Between 20 and 50 million more people suffer non-fatal injuries, with many incurring a disability as a result of their injury. In most of cases, the driver of the vehicle is at high risk. Taking into consideration the safety of drivers, several safety measures have been implemented by the automobile industry. Installation of a camera cleaning system in automobiles is one of these steps for safety of the drivers. Regular use of passenger and commercial vehicles leads to the deposition of dirt or snow on the camera and consequently, reduced visibility. This disturbs the front and rear view of the car and hence, the driver of car is prone to accidents. The vehicle camera cleaning system cleans the camera periodically. These systems also protect the camera from dust, water, etc., and provide the driver with a clear view of the front and rear of the vehicle. Hence, this automotive safety system ensures the safety of the driver.
For Instance, MS FOSTER & ASSOCIATES, INC. has developed a CAMWASH VEHICLE CAMERA WASHING SYSTEM for commercial and passenger vehicles. Advances in technology have led to the installation of several types of sensors in vehicles. Furthermore, an increase in demand for safety has led to the development of camera-dependent systems including lane assist systems, ADAS, and parking assist systems. These sensors and camera lenses need to be cleaned and kept free of dirt, ice, and snow in order to function properly and provide a clear view of the road ahead, which can be achieved by the CAMWASH system. Thus, increased emphasis on driver’s safety is anticipated to drive the vehicle cameras market during the forecast period.
The increasing adoption of advanced cameras integrated with the advanced driver assistance system (ADAS) is expected to drive the market during the forecast period. For instance, cameras integrated with a driver monitoring system (DMS) detect the drowsy behavior of the driver. A combination of these components focuses on the driver’s driving pattern and facial expressions. If the driver’s driving pattern changes, the DMS sends a warning signal to the driver. Furthermore, if the driver doesn’t stop the vehicle, the DMS, along with adaptive cruise controls steers the vehicle away from the road and stops it automatically. Additionally, cameras integrated with the ADAS system are utilized in various applications such as lane keep assist, park assist, adaptive cruise control (ACC), etc. The global positioning system (GPS) is being employed to enable cars to navigate without human aid. The rising preference of consumers toward ADAS is also projected to boost the global vehicle cameras market during the forecast period.
In terms of price, the global vehicle cameras market has been classified into affordable, mid-range, and high-end vehicle cameras. Among these, the mid-range vehicle cameras segment led the global vehicle cameras market, in terms of revenue share, in 2021. This was primarily due to the high return on investment provided by these cameras. Mid-range vehicle camera system provides numerous features, as compared to that offered by affordable cameras, and are cheaper than high-end cameras. This makes mid-range vehicle cameras highly preferred over high-end and affordable vehicle cameras. Affordable cameras are cheaper as compared to mid-range and high-end cameras. However, demand for affordable vehicle cameras is significantly low as they offer fewer features.
In terms of technology, the global vehicle cameras market has been split into digital cameras, infrared cameras, and thermal cameras. The thermal camera segment held a major share of 37.12% of the market in 2021. It is expected to maintain its position in the market and grow at a growth rate of more than 9.56% during the forecast period, owing to the application of such devices in night vision systems and usefulness in adverse weather conditions, such as fog and rain. Furthermore, the need for detecting pedestrians and wide life even in no-light areas to avoid collisions is expected to increase in the adoption of thermal cameras. Followed by the thermal camera segment, the infrared camera segment is also estimated to grow at a significant pace during the forecast period owing to the increasing need for detecting obstacles even from a long range. In addition, the increasing need to detect objects that produce heat such as automobiles, animals, and people, without lights or headlights is expected to increase in demand for infrared cameras. The vision positioning system is used for locating the position of automated devices by thermal cameras and sensors.
In terms of volume, Asia Pacific held a 36.24% share of the global vehicle cameras market in 2021. Vehicle hybridization and electrification, increasing production of electric vehicles, and increasing sales of passenger vehicles are key factors driving the vehicle cameras market in the Asia Pacific. Several original equipment manufacturers have shifted their automobile manufacturing plants to countries in the Asia Pacific, as these countries offer significant opportunities. The rising population and government policies promoting industrial growth have made the Asia Pacific a perfect destination for automobile manufacturers to establish their facilities. These factors and increasing sales and production of vehicles contributed to the Asia Pacific holding a prominent share in the global vehicle cameras market.
North America and Europe also accounted for significant shares of the global vehicle cameras market. The U.S. is expected to dominate the market in North America owing to safety regulations imposed by the government. For instance, in May 2018, the U.S. Transportation Department made it mandatory to install rear view cameras in vehicles weighing less than 10,000 Ibs.
The global vehicle cameras market is fragmented with a more number of manufacturers controlling the overall market share. A majority of the firms are spending significantly on comprehensive research and development of self-driving vehicles equipped with various sensors and vehicle cameras in order to ensure a safe, efficient, and modern transportation systems. Diversification of product portfolios and mergers and acquisitions are major strategies adopted by the key players. Aptiv, Autoliv Inc., Continental AG, Robert Bosch GmbH, Denso Corporation, DCS Systems Ltd., Ficosa International Inc., Magna International Inc., and Valeo SA are the prominent entities operating in the market.
|
Attribute |
Detail |
|
Market Size Value in 2021 |
US$ 9.35 Bn |
|
Market Forecast Value in 2031 |
US$ 24.37 Bn |
|
Growth Rate (CAGR) |
10.05% |
|
Forecast Period |
2022–2031 |
|
Historical Data Available for |
2017–2021 |
|
Quantitative Units |
US$ Bn for Value & Units for Volume |
|
Market Analysis |
It includes cross segment analysis at global as well as regional level. Furthermore, qualitative analysis includes drivers, restraints, opportunities, key trends, Porter’s Five Forces analysis, value chain analysis, and key trend analysis. |
|
Competition Landscape |
|
|
Format |
Electronic (PDF) + Excel |
|
Market Segmentation |
|
|
Regions Covered |
|
|
Countries Covered |
|
|
Companies Profiled |
|
|
Customization Scope |
Available upon request |
|
Pricing |
Available upon request |
The market size of vehicle cameras stood at US$ 9.35 Bn in 2021.
The vehicle cameras market is expected to expand at a CAGR of 10.05% from 2022 to 2031.
Increasing vehicle production across the globe, government safety norms, consumer demand for safer vehicles, increasing emphasis on driver’s safety, rising integration of cameras in modern vehicles, and rising sales of electric vehicles are key factors that are driving the vehicle cameras market.
The passenger vehicle segment accounted for major share of 41.69% of the vehicle cameras market in 2021.
Asia Pacific is a more attractive region for vendors in the vehicle cameras market.
Key players operating in the vehicle cameras market include Aptiv, Autoliv Inc., Continental AG, Robert Bosch GmbH, Denso Corporation, DCS Systems Ltd., Ficosa International Inc., Magna International Inc., and Valeo SA.
1. Executive Summary
1.1. Global Market Outlook
1.1.1. Market Value US$ Bn, 2017‒2031
1.2. Competitive Dashboard Analysis
2. Market Overview
2.1. TMR Analysis and Recommendations
2.2. Market Dynamics
2.2.1. Drivers
2.2.2. Restraints
2.2.3. Opportunity
2.3. Market Factor Analysis
2.3.1. Porter’s Five Force Analysis
2.3.2. SWOT Analysis
2.3.3. Value Chain Analysis
2.3.3.1. Raw Material
2.3.3.2. Tier 2 Suppliers
2.3.3.3. Tier 1 Suppliers
2.3.3.4. End-users
2.4. Regulatory Scenario
2.5. Key Trend Analysis
3. COVID-19 Impact Analysis – Vehicle Cameras Market
4. Global Vehicle Cameras Market, by Camera View Type
4.1. Market Snapshot
4.1.1. Introduction, Definition, and Key Findings
4.1.2. Market Growth & Y-o-Y Projections
4.1.3. Base Point Share Analysis
4.2. Global Vehicle Cameras Market Size Analysis & Forecast, by Camera View Type, 2017‒2031
4.2.1. Mono Camera
4.2.2. Rear View Camera
4.2.3. Surround View Camera
5. Global Vehicle Cameras Market, By Technology
5.1. Market Snapshot
5.1.1. Introduction, Definition, and Key Findings
5.1.2. Market Growth & Y-o-Y Projections
5.1.3. Base Point Share Analysis
5.2. Global Vehicle Cameras Market Size Analysis & Forecast, by Technology, 2017‒2031
5.2.1. Digital Camera
5.2.2. Infrared Camera
5.2.3. Thermal Camera
6. Global Vehicle Cameras Market, By Price
6.1. Market Snapshot
6.1.1. Introduction, Definition, and Key Findings
6.1.2. Market Growth & Y-o-Y Projections
6.1.3. Base Point Share Analysis
6.2. Global Vehicle Cameras Market Size Analysis & Forecast, by Price, 2017‒2031
6.2.1. Affordable
6.2.2. Mid-range
6.2.3. High-end Vehicle Cameras
7. Global Vehicle Cameras Market, By Vehicle Type
7.1. Market Snapshot
7.1.1. Introduction, Definition, and Key Findings
7.1.2. Market Growth & Y-o-Y Projections
7.1.3. Base Point Share Analysis
7.2. Global Vehicle Cameras Market Size Analysis & Forecast, by Vehicle Type, 2017‒2031
7.2.1. Passenger Vehicle
7.2.1.1. Hatchback
7.2.1.2. Sedan
7.2.1.3. Utility Vehicles
7.2.2. Light Commercial Vehicles
7.2.3. Trucks
7.2.4. Buses & Coaches
8. Global Vehicle Cameras Market, By Application
8.1. Market Snapshot
8.1.1. Introduction, Definition, and Key Findings
8.1.2. Market Growth & Y-o-Y Projections
8.1.3. Base Point Share Analysis
8.2. Global Vehicle Cameras Market Size Analysis & Forecast, by Application, 2017‒2031
8.2.1. Park Assist System
8.2.2. Driver Monitoring System
8.2.3. Blind Spot Detection
8.2.4. Night Vision System
8.2.5. Adaptive Cruise Control
8.2.6. Pedestrian Detection
8.2.7. Road Sign Recognition
8.2.8. Others
9. Global Vehicle Cameras Market, By Sales Channel
9.1. Market Snapshot
9.1.1. Introduction, Definition, and Key Findings
9.1.2. Market Growth & Y-o-Y Projections
9.1.3. Base Point Share Analysis
9.2. Global Vehicle Cameras Market Size Analysis & Forecast, by Sales Channel, 2017‒2031
9.2.1. OEM
9.2.2. Aftermarket
10. Global Vehicle Cameras Market, by Region
10.1. Market Snapshot
10.1.1. Introduction, Definition, and Key Findings
10.1.2. Market Growth & Y-o-Y Projections
10.1.3. Base Point Share Analysis
10.2. Global Vehicle Cameras Market Size Analysis & Forecast, by Region, 2017‒2031
10.2.1. North America
10.2.2. Europe
10.2.3. Asia Pacific
10.2.4. Middle East & Africa
10.2.5. South America
11. North America Vehicle Cameras Market
11.1. Market Snapshot
11.2. Vehicle Cameras Market Size Analysis & Forecast, by Camera View Type, 2017‒2031
11.2.1. Mono Camera
11.2.2. Rear View Camera
11.2.3. Surround View Camera
11.3. Vehicle Cameras Market Size Analysis & Forecast, by Technology, 2017‒2031
11.3.1. Digital Camera
11.3.2. Infrared Camera
11.3.3. Thermal Camera
11.4. Vehicle Cameras Market Size Analysis & Forecast, by Price, 2017‒2031
11.4.1. Affordable
11.4.2. Mid-range
11.4.3. High-end Vehicle Cameras
11.5. Vehicle Cameras Market Size Analysis & Forecast, by Vehicle Type, 2017‒2031
11.5.1. Passenger Vehicle
11.5.1.1. Hatchback
11.5.1.2. Sedan
11.5.1.3. Utility Vehicles
11.5.2. Light Commercial Vehicles
11.5.3. Trucks
11.5.4. Buses & Coaches
11.6. Vehicle Cameras Market Size Analysis & Forecast, by Application, 2017‒2031
11.6.1. Park Assist System
11.6.2. Driver Monitoring System
11.6.3. Blind Spot Detection
11.6.4. Night Vision System
11.6.5. Adaptive Cruise Control
11.6.6. Pedestrian Detection
11.6.7. Road Sign Recognition
11.6.8. Others
11.7. Vehicle Cameras Market Size Analysis & Forecast, by Sales Channel, 2017‒2031
11.7.1. OEM
11.7.2. Aftermarket
11.8. Key Country Analysis – North America Vehicle Cameras Market Size Analysis & Forecast, 2017‒2031
11.8.1. U.S.
11.8.2. Canada
11.8.3. Mexico
12. Europe Vehicle Cameras Market
12.1. Market Snapshot
12.2. Vehicle Cameras Market Size Analysis & Forecast, by Camera View Type, 2017‒2031
12.2.1. Mono Camera
12.2.2. Rear View Camera
12.2.3. Surround View Camera
12.3. Vehicle Cameras Market Size Analysis & Forecast, by Technology, 2017‒2031
12.3.1. Digital Camera
12.3.2. Infrared Camera
12.3.3. Thermal Camera
12.4. Vehicle Cameras Market Size Analysis & Forecast, by Price, 2017‒2031
12.4.1. Affordable
12.4.2. Mid-range
12.4.3. High-end Vehicle Cameras
12.5. Vehicle Cameras Market Size Analysis & Forecast, by Vehicle Type, 2017‒2031
12.5.1. Passenger Vehicle
12.5.1.1. Hatchback
12.5.1.2. Sedan
12.5.1.3. Utility Vehicles
12.5.2. Light Commercial Vehicles
12.5.3. Trucks
12.5.4. Buses & Coaches
12.6. Vehicle Cameras Market Size Analysis & Forecast, by Application, 2017‒2031
12.6.1. Park Assist System
12.6.2. Driver Monitoring System
12.6.3. Blind Spot Detection
12.6.4. Night Vision System
12.6.5. Adaptive Cruise Control
12.6.6. Pedestrian Detection
12.6.7. Road Sign Recognition
12.6.8. Others
12.7. Vehicle Cameras Market Size Analysis & Forecast, by Sales Channel, 2017‒2031
12.7.1. OEM
12.7.2. Aftermarket
12.8. Key Country Analysis – Europe Vehicle Cameras Market Size Analysis & Forecast, 2017‒2031
12.8.1. Germany
12.8.2. U. K.
12.8.3. France
12.8.4. Italy
12.8.5. Spain
12.8.6. Nordic Countries
12.8.7. Russia & CIS
12.8.8. Rest of Europe
13. Asia Pacific Vehicle Cameras Market
13.1. Market Snapshot
13.2. Vehicle Cameras Market Size Analysis & Forecast, by Camera View Type, 2017‒2031
13.2.1. Mono Camera
13.2.2. Rear View Camera
13.2.3. Surround View Camera
13.3. Vehicle Cameras Market Size Analysis & Forecast, by Technology, 2017‒2031
13.3.1. Digital Camera
13.3.2. Infrared Camera
13.3.3. Thermal Camera
13.4. Vehicle Cameras Market Size Analysis & Forecast, by Price, 2017‒2031
13.4.1. Affordable
13.4.2. Mid-range
13.4.3. High-end Vehicle Cameras
13.5. Vehicle Cameras Market Size Analysis & Forecast, by Vehicle Type, 2017‒2031
13.5.1. Passenger Vehicle
13.5.1.1. Hatchback
13.5.1.2. Sedan
13.5.1.3. Utility Vehicles
13.5.2. Light Commercial Vehicles
13.5.3. Trucks
13.5.4. Buses & Coaches
13.6. Vehicle Cameras Market Size Analysis & Forecast, by Application, 2017‒2031
13.6.1. Park Assist System
13.6.2. Driver Monitoring System
13.6.3. Blind Spot Detection
13.6.4. Night Vision System
13.6.5. Adaptive Cruise Control
13.6.6. Pedestrian Detection
13.6.7. Road Sign Recognition
13.6.8. Others
13.7. Vehicle Cameras Market Size Analysis & Forecast, by Sales Channel, 2017‒2031
13.7.1. OEM
13.7.2. Aftermarket
13.8. Key Country Analysis – Asia Pacific Vehicle Cameras Market Size Analysis & Forecast, 2017‒2031
13.8.1. China
13.8.2. India
13.8.3. Japan
13.8.4. ASEAN Countries
13.8.5. South Korea
13.8.6. ANZ
13.8.7. Rest of Asia Pacific
14. Middle East & Africa Vehicle Cameras Market
14.1. Market Snapshot
14.2. Vehicle Cameras Market Size Analysis & Forecast, by Camera View Type, 2017‒2031
14.2.1. Mono Camera
14.2.2. Rear View Camera
14.2.3. Surround View Camera
14.3. Vehicle Cameras Market Size Analysis & Forecast, by Technology, 2017‒2031
14.3.1. Digital Camera
14.3.2. Infrared Camera
14.3.3. Thermal Camera
14.4. Vehicle Cameras Market Size Analysis & Forecast, by Price, 2017‒2031
14.4.1. Affordable
14.4.2. Mid-range
14.4.3. High-end Vehicle Cameras
14.5. Vehicle Cameras Market Size Analysis & Forecast, by Vehicle Type, 2017‒2031
14.5.1. Passenger Vehicle
14.5.1.1. Hatchback
14.5.1.2. Sedan
14.5.1.3. Utility Vehicles
14.5.2. Light Commercial Vehicles
14.5.3. Trucks
14.5.4. Buses & Coaches
14.6. Vehicle Cameras Market Size Analysis & Forecast, by Application, 2017‒2031
14.6.1. Park Assist System
14.6.2. Driver Monitoring System
14.6.3. Blind Spot Detection
14.6.4. Night Vision System
14.6.5. Adaptive Cruise Control
14.6.6. Pedestrian Detection
14.6.7. Road Sign Recognition
14.6.8. Others
14.7. Vehicle Cameras Market Size Analysis & Forecast, by Sales Channel, 2017‒2031
14.7.1. OEM
14.7.2. Aftermarket
14.8. Key Country Analysis – Middle East & Africa Vehicle Cameras Market Size Analysis & Forecast, 2017‒2031
14.8.1. GCC
14.8.2. South Africa
14.8.3. Turkey
14.8.4. Rest of Middle East & Africa
15. South America Vehicle Cameras Market
15.1. Market Snapshot
15.2. Vehicle Cameras Market Size Analysis & Forecast, by Camera View Type, 2017‒2031
15.2.1. Mono Camera
15.2.2. Rear View Camera
15.2.3. Surround View Camera
15.3. Vehicle Cameras Market Size Analysis & Forecast, by Technology, 2017‒2031
15.3.1. Digital Camera
15.3.2. Infrared Camera
15.3.3. Thermal Camera
15.4. Vehicle Cameras Market Size Analysis & Forecast, by Price, 2017‒2031
15.4.1. Affordable
15.4.2. Mid-range
15.4.3. High-end Vehicle Cameras
15.5. Vehicle Cameras Market Size Analysis & Forecast, by Vehicle Type, 2017‒2031
15.5.1. Passenger Vehicle
15.5.1.1. Hatchback
15.5.1.2. Sedan
15.5.1.3. Utility Vehicles
15.5.2. Light Commercial Vehicles
15.5.3. Trucks
15.5.4. Buses & Coaches
15.6. Vehicle Cameras Market Size Analysis & Forecast, by Application, 2017‒2031
15.6.1. Park Assist System
15.6.2. Driver Monitoring System
15.6.3. Blind Spot Detection
15.6.4. Night Vision System
15.6.5. Adaptive Cruise Control
15.6.6. Pedestrian Detection
15.6.7. Road Sign Recognition
15.6.8. Others
15.7. Vehicle Cameras Market Size Analysis & Forecast, by Sales Channel, 2017‒2031
15.7.1. OEM
15.7.2. Aftermarket
15.8. Key Country Analysis – South America Vehicle Cameras Market Size Analysis & Forecast, 2017‒2031
15.8.1. Brazil
15.8.2. Argentina
15.8.3. Rest of South America
16. Competitive Landscape
16.1. Company Share Analysis/ Brand Share Analysis, 2020
16.2. Pricing comparison among key players
16.3. Company Analysis for each player (Company Overview, Company Footprints, Production Locations, Product Portfolio, Competitors & Customers, Subsidiaries & Parent Organization, Recent Developments, Financial Analysis, Profitability, Revenue Share)
17. Company Profile/ Key Players
17.1.1. AIPTEK International, Inc.
17.1.1.1. Company Overview
17.1.1.2. Company Footprints
17.1.1.3. Production Locations
17.1.1.4. Product Portfolio
17.1.1.5. Competitors & Customers
17.1.1.6. Subsidiaries & Parent Organization
17.1.1.7. Recent Developments
17.1.1.8. Financial Analysis
17.1.1.9. Profitability
17.1.1.10. Revenue Share
17.1.2. Aptiv
17.1.2.1. Company Overview
17.1.2.2. Company Footprints
17.1.2.3. Production Locations
17.1.2.4. Product Portfolio
17.1.2.5. Competitors & Customers
17.1.2.6. Subsidiaries & Parent Organization
17.1.2.7. Recent Developments
17.1.2.8. Financial Analysis
17.1.2.9. Profitability
17.1.2.10. Revenue Share
17.1.3. Autoliv Inc.
17.1.3.1. Company Overview
17.1.3.2. Company Footprints
17.1.3.3. Production Locations
17.1.3.4. Product Portfolio
17.1.3.5. Competitors & Customers
17.1.3.6. Subsidiaries & Parent Organization
17.1.3.7. Recent Developments
17.1.3.8. Financial Analysis
17.1.3.9. Profitability
17.1.3.10. Revenue Share
17.1.4. Continental AG
17.1.4.1. Company Overview
17.1.4.2. Company Footprints
17.1.4.3. Production Locations
17.1.4.4. Product Portfolio
17.1.4.5. Competitors & Customers
17.1.4.6. Subsidiaries & Parent Organization
17.1.4.7. Recent Developments
17.1.4.8. Financial Analysis
17.1.4.9. Profitability
17.1.4.10. Revenue Share
17.1.5. DENSO Corporation
17.1.5.1. Company Overview
17.1.5.2. Company Footprints
17.1.5.3. Production Locations
17.1.5.4. Product Portfolio
17.1.5.5. Competitors & Customers
17.1.5.6. Subsidiaries & Parent Organization
17.1.5.7. Recent Developments
17.1.5.8. Financial Analysis
17.1.5.9. Profitability
17.1.5.10. Revenue Share
17.1.6. DCS Systems Ltd.
17.1.6.1. Company Overview
17.1.6.2. Company Footprints
17.1.6.3. Production Locations
17.1.6.4. Product Portfolio
17.1.6.5. Competitors & Customers
17.1.6.6. Subsidiaries & Parent Organization
17.1.6.7. Recent Developments
17.1.6.8. Financial Analysis
17.1.6.9. Profitability
17.1.6.10. Revenue Share
17.1.7. Ficosa International SA
17.1.7.1. Company Overview
17.1.7.2. Company Footprints
17.1.7.3. Production Locations
17.1.7.4. Product Portfolio
17.1.7.5. Competitors & Customers
17.1.7.6. Subsidiaries & Parent Organization
17.1.7.7. Recent Developments
17.1.7.8. Financial Analysis
17.1.7.9. Profitability
17.1.7.10. Revenue Share
17.1.8. GoPro, Inc.
17.1.8.1. Company Overview
17.1.8.2. Company Footprints
17.1.8.3. Production Locations
17.1.8.4. Product Portfolio
17.1.8.5. Competitors & Customers
17.1.8.6. Subsidiaries & Parent Organization
17.1.8.7. Recent Developments
17.1.8.8. Financial Analysis
17.1.8.9. Profitability
17.1.8.10. Revenue Share
17.1.9. Garmin International, Inc.
17.1.9.1. Company Overview
17.1.9.2. Company Footprints
17.1.9.3. Production Locations
17.1.9.4. Product Portfolio
17.1.9.5. Competitors & Customers
17.1.9.6. Subsidiaries & Parent Organization
17.1.9.7. Recent Developments
17.1.9.8. Financial Analysis
17.1.9.9. Profitability
17.1.9.10. Revenue Share
17.1.10. Gentex Corporation
17.1.10.1. Company Overview
17.1.10.2. Company Footprints
17.1.10.3. Production Locations
17.1.10.4. Product Portfolio
17.1.10.5. Competitors & Customers
17.1.10.6. Subsidiaries & Parent Organization
17.1.10.7. Recent Developments
17.1.10.8. Financial Analysis
17.1.10.9. Profitability
17.1.10.10. Revenue Share
17.1.11. Hyundai MnSOFT
17.1.11.1. Company Overview
17.1.11.2. Company Footprints
17.1.11.3. Production Locations
17.1.11.4. Product Portfolio
17.1.11.5. Competitors & Customers
17.1.11.6. Subsidiaries & Parent Organization
17.1.11.7. Recent Developments
17.1.11.8. Financial Analysis
17.1.11.9. Profitability
17.1.11.10. Revenue Share
17.1.12. Magna International Inc.
17.1.12.1. Company Overview
17.1.12.2. Company Footprints
17.1.12.3. Production Locations
17.1.12.4. Product Portfolio
17.1.12.5. Competitors & Customers
17.1.12.6. Subsidiaries & Parent Organization
17.1.12.7. Recent Developments
17.1.12.8. Financial Analysis
17.1.12.9. Profitability
17.1.12.10. Revenue Share
17.1.13. Pittasoft Co. Ltd.
17.1.13.1. Company Overview
17.1.13.2. Company Footprints
17.1.13.3. Production Locations
17.1.13.4. Product Portfolio
17.1.13.5. Competitors & Customers
17.1.13.6. Subsidiaries & Parent Organization
17.1.13.7. Recent Developments
17.1.13.8. Financial Analysis
17.1.13.9. Profitability
17.1.13.10. Revenue Share
17.1.14. Qrontech Co. Ltd. (Lukas)
17.1.14.1. Company Overview
17.1.14.2. Company Footprints
17.1.14.3. Production Locations
17.1.14.4. Product Portfolio
17.1.14.5. Competitors & Customers
17.1.14.6. Subsidiaries & Parent Organization
17.1.14.7. Recent Developments
17.1.14.8. Financial Analysis
17.1.14.9. Profitability
17.1.14.10. Revenue Share
17.1.15. Robert Bosch GmbH
17.1.15.1. Company Overview
17.1.15.2. Company Footprints
17.1.15.3. Production Locations
17.1.15.4. Product Portfolio
17.1.15.5. Competitors & Customers
17.1.15.6. Subsidiaries & Parent Organization
17.1.15.7. Recent Developments
17.1.15.8. Financial Analysis
17.1.15.9. Profitability
17.1.15.10. Revenue Share
17.1.16. S. Will Industrial Ltd.
17.1.16.1. Company Overview
17.1.16.2. Company Footprints
17.1.16.3. Production Locations
17.1.16.4. Product Portfolio
17.1.16.5. Competitors & Customers
17.1.16.6. Subsidiaries & Parent Organization
17.1.16.7. Recent Developments
17.1.16.8. Financial Analysis
17.1.16.9. Profitability
17.1.16.10. Revenue Share
17.1.17. Transcend Information, Inc.
17.1.17.1. Company Overview
17.1.17.2. Company Footprints
17.1.17.3. Production Locations
17.1.17.4. Product Portfolio
17.1.17.5. Competitors & Customers
17.1.17.6. Subsidiaries & Parent Organization
17.1.17.7. Recent Developments
17.1.17.8. Financial Analysis
17.1.17.9. Profitability
17.1.17.10. Revenue Share
17.1.18. Valeo SA
17.1.18.1. Company Overview
17.1.18.2. Company Footprints
17.1.18.3. Production Locations
17.1.18.4. Product Portfolio
17.1.18.5. Competitors & Customers
17.1.18.6. Subsidiaries & Parent Organization
17.1.18.7. Recent Developments
17.1.18.8. Financial Analysis
17.1.18.9. Profitability
17.1.18.10. Revenue Share
17.1.19. Other Key Players
List of Tables
Table 1: Global Vehicle Cameras Market Volume (Million Units) Forecast, by Camera View Type, 2017‒2031
Table 2: Global Vehicle Cameras Market Value (US$ Bn) Forecast, by Camera View Type, 2017‒2031
Table 3: Global Vehicle Cameras Market Volume (Million Units) Forecast, by Technology, 2017‒2031
Table 4: Global Vehicle Cameras Market Value (US$ Bn) Forecast, by Technology, 2017‒2031
Table 5: Global Vehicle Cameras Market Volume (Million Units) Forecast, by Price, 2017‒2031
Table 6: Global Vehicle Cameras Market Value (US$ Bn) Forecast, by Price, 2017‒2031
Table 7: Global Vehicle Cameras Market Volume (Million Units) Forecast, by Vehicle Type, 2017‒2031
Table 8: Global Vehicle Cameras Market Value (US$ Bn) Forecast, by Vehicle Type, 2017‒2031
Table 9: Global Vehicle Cameras Market Volume (Million Units) Forecast, by Application, 2017‒2031
Table 10: Global Vehicle Cameras Market Value (US$ Bn) Forecast, by Application, 2017‒2031
Table 11: Global Vehicle Cameras Market Volume (Million Units) Forecast, by Sales Channel, 2017‒2031
Table 12: Global Vehicle Cameras Market Value (US$ Bn) Forecast, by Sales Channel, 2017‒2031
Table 13: Global Vehicle Cameras Market Volume (Million Units) Forecast, by Region, 2017‒2031
Table 14: Global Vehicle Cameras Market Value (US$ Bn) Forecast, by Region, 2017‒2031
Table 15: North America Vehicle Cameras Market Volume (Million Units) Forecast, by Camera View Type, 2017‒2031
Table 16: North America Vehicle Cameras Market Value (US$ Bn) Forecast, by Camera View Type, 2017‒2031
Table 17: North America Vehicle Cameras Market Volume (Million Units) Forecast, by Technology, 2017‒2031
Table 18: North America Vehicle Cameras Market Value (US$ Bn) Forecast, by Technology, 2017‒2031
Table 19: North America Vehicle Cameras Market Volume (Million Units) Forecast, by Price, 2017‒2031
Table 20: North America Vehicle Cameras Market Value (US$ Bn) Forecast, by Price, 2017‒2031
Table 21: North America Vehicle Cameras Market Volume (Million Units) Forecast, by Vehicle Type, 2017‒2031
Table 22: North America Vehicle Cameras Market Value (US$ Bn) Forecast, by Vehicle Type, 2017‒2031
Table 23: North America Vehicle Cameras Market Volume (Million Units) Forecast, by Application, 2017‒2031
Table 24: North America Vehicle Cameras Market Value (US$ Bn) Forecast, by Application, 2017‒2031
Table 25: North America Vehicle Cameras Market Volume (Million Units) Forecast, by Sales Channel, 2017‒2031
Table 26: North America Vehicle Cameras Market Value (US$ Bn) Forecast, by Sales Channel, 2017‒2031
Table 27: North America Vehicle Cameras Market Volume (Million Units) Forecast, by Country, 2017‒2031
Table 28: North America Vehicle Cameras Market Value (US$ Bn) Forecast, by Country, 2017‒2031
Table 29: Europe Vehicle Cameras Market Volume (Million Units) Forecast, by Camera View Type, 2017‒2031
Table 30: Europe Vehicle Cameras Market Value (US$ Bn) Forecast, by Camera View Type, 2017‒2031
Table 31: Europe Vehicle Cameras Market Volume (Million Units) Forecast, by Technology, 2017‒2031
Table 32: Europe Vehicle Cameras Market Value (US$ Bn) Forecast, by Technology, 2017‒2031
Table 33: Europe Vehicle Cameras Market Volume (Million Units) Forecast, by Price, 2017‒2031
Table 34: Europe Vehicle Cameras Market Value (US$ Bn) Forecast, by Price, 2017‒2031
Table 35: Europe Vehicle Cameras Market Volume (Million Units) Forecast, by Vehicle Type, 2017‒2031
Table 36: Europe Vehicle Cameras Market Value (US$ Bn) Forecast, by Vehicle Type, 2017‒2031
Table 37: Europe Vehicle Cameras Market Volume (Million Units) Forecast, by Application, 2017‒2031
Table 38: Europe Vehicle Cameras Market Value (US$ Bn) Forecast, by Application, 2017‒2031
Table 39: Europe Vehicle Cameras Market Volume (Million Units) Forecast, by Sales Channel, 2017‒2031
Table 40: Europe Vehicle Cameras Market Value (US$ Bn) Forecast, by Sales Channel, 2017‒2031
Table 41: Europe Vehicle Cameras Market Volume (Million Units) Forecast, by Country & Sub-region, 2017‒2031
Table 42: Europe Vehicle Cameras Market Value (US$ Bn) Forecast, by Country & Sub-region, 2017‒2031
Table 43: Asia Pacific Vehicle Cameras Market Volume (Million Units) Forecast, by Camera View Type, 2017‒2031
Table 44: Asia Pacific Vehicle Cameras Market Value (US$ Bn) Forecast, by Camera View Type, 2017‒2031
Table 45: Asia Pacific Vehicle Cameras Market Volume (Million Units) Forecast, by Technology, 2017‒2031
Table 46: Asia Pacific Vehicle Cameras Market Value (US$ Bn) Forecast, by Technology, 2017‒2031
Table 47: Asia Pacific Vehicle Cameras Market Volume (Million Units) Forecast, by Price, 2017‒2031
Table 48: Asia Pacific Vehicle Cameras Market Value (US$ Bn) Forecast, by Price, 2017‒2031
Table 49: Asia Pacific Vehicle Cameras Market Volume (Million Units) Forecast, by Vehicle Type, 2017‒2031
Table 50: Asia Pacific Vehicle Cameras Market Value (US$ Bn) Forecast, by Vehicle Type, 2017‒2031
Table 51: Asia Pacific Vehicle Cameras Market Volume (Million Units) Forecast, by Application, 2017‒2031
Table 52: Asia Pacific Vehicle Cameras Market Value (US$ Bn) Forecast, by Application, 2017‒2031
Table 53: Asia Pacific Vehicle Cameras Market Volume (Million Units) Forecast, by Sales Channel, 2017‒2031
Table 54: Asia Pacific Vehicle Cameras Market Value (US$ Bn) Forecast, by Sales Channel, 2017‒2031
Table 55: Asia Pacific Vehicle Cameras Market Volume (Million Units) Forecast, by Country & Sub-region, 2017‒2031
Table 56: Asia Pacific Vehicle Cameras Market Value (US$ Bn) Forecast, by Country & Sub-region, 2017‒2031
Table 57: Middle East & Africa Vehicle Cameras Market Volume (Million Units) Forecast, by Camera View Type, 2017‒2031
Table 58: Middle East & Africa Vehicle Cameras Market Value (US$ Bn) Forecast, by Camera View Type, 2017‒2031
Table 59: Middle East & Africa Vehicle Cameras Market Volume (Million Units) Forecast, by Technology, 2017‒2031
Table 60: Middle East & Africa Vehicle Cameras Market Value (US$ Bn) Forecast, by Technology, 2017‒2031
Table 61: Middle East & Africa Vehicle Cameras Market Volume (Million Units) Forecast, by Price, 2017‒2031
Table 62: Middle East & Africa Vehicle Cameras Market Value (US$ Bn) Forecast, by Price, 2017‒2031
Table 63: Middle East & Africa Vehicle Cameras Market Volume (Million Units) Forecast, by Vehicle Type, 2017‒2031
Table 64: Middle East & Africa Vehicle Cameras Market Value (US$ Bn) Forecast, by Vehicle Type, 2017‒2031
Table 65: Middle East & Africa Vehicle Cameras Market Volume (Million Units) Forecast, by Application, 2017‒2031
Table 66: Middle East & Africa Vehicle Cameras Market Value (US$ Bn) Forecast, by Application, 2017‒2031
Table 67: Middle East & Africa Vehicle Cameras Market Volume (Million Units) Forecast, by Sales Channel, 2017‒2031
Table 68: Middle East & Africa Vehicle Cameras Market Value (US$ Bn) Forecast, by Sales Channel, 2017‒2031
Table 69: Middle East & Africa Vehicle Cameras Market Volume (Million Units) Forecast, by Country, 2017‒2031
Table 70: Middle East & Africa Vehicle Cameras Market Value (US$ Bn) Forecast, by Country, 2017‒2031
Table 71: South America Vehicle Cameras Market Volume (Million Units) Forecast, by Camera View Type, 2017‒2031
Table 72: South America Vehicle Cameras Market Value (US$ Bn) Forecast, by Camera View Type, 2017‒2031
Table 73: South America Vehicle Cameras Market Volume (Million Units) Forecast, by Technology, 2017‒2031
Table 74: South America Vehicle Cameras Market Value (US$ Bn) Forecast, by Technology, 2017‒2031
Table 75: South America Vehicle Cameras Market Volume (Million Units) Forecast, by Price, 2017‒2031
Table 76: South America Vehicle Cameras Market Value (US$ Bn) Forecast, by Price, 2017‒2031
Table 77: South America Vehicle Cameras Market Volume (Million Units) Forecast, by Vehicle Type, 2017‒2031
Table 78: South America Vehicle Cameras Market Value (US$ Bn) Forecast, by Vehicle Type, 2017‒2031
Table 79: South America Vehicle Cameras Market Volume (Million Units) Forecast, by Application, 2017‒2031
Table 80: South America Vehicle Cameras Market Value (US$ Bn) Forecast, by Application, 2017‒2031
Table 81: South America Vehicle Cameras Market Volume (Million Units) Forecast, by Sales Channel, 2017‒2031
Table 82: South America Vehicle Cameras Market Value (US$ Bn) Forecast, by Sales Channel, 2017‒2031
Table 83: South America Vehicle Cameras Market Volume (Million Units) Forecast, by Country & Sub-region, 2017‒2031
Table 84: South America Vehicle Cameras Market Value (US$ Bn) Forecast, by Country & Sub-region, 2017‒2031
List of Figures
Figure 1: Global Vehicle Cameras Market Volume (Million Units) Forecast, by Camera View Type, 2017‒2031
Figure 2: Global Vehicle Cameras Market Value (US$ Bn) Forecast, by Camera View Type, 2017‒2031
Figure 3: Global Vehicle Cameras Market, Incremental Opportunity, by Camera View Type, Value (US$ Bn), 2022‒2031
Figure 4: Global Vehicle Cameras Market Volume (Million Units) Forecast, by Technology, 2017‒2031
Figure 5: Global Vehicle Cameras Market Value (US$ Bn) Forecast, by Technology, 2017‒2031
Figure 6: Global Vehicle Cameras Market, Incremental Opportunity, by Technology, Value (US$ Bn), 2022‒2031
Figure 7: Global Vehicle Cameras Market Volume (Million Units) Forecast, by Price, 2017‒2031
Figure 8: Global Vehicle Cameras Market Value (US$ Bn) Forecast, by Price, 2017‒2031
Figure 9: Global Vehicle Cameras Market, Incremental Opportunity, by Price, Value (US$ Bn), 2022‒2031
Figure 10: Global Vehicle Cameras Market Volume (Million Units) Forecast, by Vehicle Type, 2017‒2031
Figure 11: Global Vehicle Cameras Market Value (US$ Bn) Forecast, by Vehicle Type, 2017‒2031
Figure 12: Global Vehicle Cameras Market, Incremental Opportunity, by Vehicle Type, Value (US$ Bn), 2022‒2031
Figure 13: Global Vehicle Cameras Market Volume (Million Units) Forecast, by Application, 2017‒2031
Figure 14: Global Vehicle Cameras Market Value (US$ Bn) Forecast, by Application, 2017‒2031
Figure 15: Global Vehicle Cameras Market, Incremental Opportunity, by Application, Value (US$ Bn), 2022‒2031
Figure 16: Global Vehicle Cameras Market Volume (Million Units) Forecast, by Sales Channel, 2017‒2031
Figure 17: Global Vehicle Cameras Market Value (US$ Bn) Forecast, by Sales Channel, 2017‒2031
Figure 18: Global Vehicle Cameras Market, Incremental Opportunity, by Sales Channel, Value (US$ Bn), 2022‒2031
Figure 19: Global Vehicle Cameras Market Volume (Million Units) Forecast, by Region, 2017‒2031
Figure 20: Global Vehicle Cameras Market Value (US$ Bn) Forecast, by Region, 2017‒2031
Figure 21: Global Vehicle Cameras Market, Incremental Opportunity, by Region, Value (US$ Bn), 2022‒2031
Figure 22: North America Vehicle Cameras Market Volume (Million Units) Forecast, by Camera View Type, 2017‒2031
Figure 23: North America Vehicle Cameras Market Value (US$ Bn) Forecast, by Camera View Type, 2017‒2031
Figure 24: North America Vehicle Cameras Market, Incremental Opportunity, by Camera View Type, Value (US$ Bn), 2022‒2031
Figure 25: North America Vehicle Cameras Market Volume (Million Units) Forecast, by Technology, 2017‒2031
Figure 26: North America Vehicle Cameras Market Value (US$ Bn) Forecast, by Technology, 2017‒2031
Figure 27: North America Vehicle Cameras Market, Incremental Opportunity, by Technology, Value (US$ Bn), 2022‒2031
Figure 28: North America Vehicle Cameras Market Volume (Million Units) Forecast, by Price, 2017‒2031
Figure 29: North America Vehicle Cameras Market Value (US$ Bn) Forecast, by Price, 2017‒2031
Figure 30: North America Vehicle Cameras Market, Incremental Opportunity, by Price, Value (US$ Bn), 2022‒2031
Figure 31: North America Vehicle Cameras Market Volume (Million Units) Forecast, by Vehicle Type, 2017‒2031
Figure 32: North America Vehicle Cameras Market Value (US$ Bn) Forecast, by Vehicle Type, 2017‒2031
Figure 33: North America Vehicle Cameras Market, Incremental Opportunity, by Vehicle Type, Value (US$ Bn), 2022‒2031
Figure 34: North America Vehicle Cameras Market Volume (Million Units) Forecast, by Application, 2017‒2031
Figure 35: North America Vehicle Cameras Market Value (US$ Bn) Forecast, by Application, 2017‒2031
Figure 36: North America Vehicle Cameras Market, Incremental Opportunity, by Application, Value (US$ Bn), 2022‒2031
Figure 37: North America Vehicle Cameras Market Volume (Million Units) Forecast, by Sales Channel, 2017‒2031
Figure 38: North America Vehicle Cameras Market Value (US$ Bn) Forecast, by Sales Channel, 2017‒2031
Figure 39: North America Vehicle Cameras Market, Incremental Opportunity, by Sales Channel, Value (US$ Bn), 2022‒2031
Figure 40: North America Vehicle Cameras Market Volume (Million Units) Forecast, by Country, 2017‒2031
Figure 41: North America Vehicle Cameras Market Value (US$ Bn) Forecast, by Country, 2017‒2031
Figure 42: North America Vehicle Cameras Market, Incremental Opportunity, by Country, Value (US$ Bn), 2022‒2031
Figure 43: Europe Vehicle Cameras Market Volume (Million Units) Forecast, by Camera View Type, 2017‒2031
Figure 44: Europe Vehicle Cameras Market Value (US$ Bn) Forecast, by Camera View Type, 2017‒2031
Figure 45: Europe Vehicle Cameras Market, Incremental Opportunity, by Camera View Type, Value (US$ Bn), 2022‒2031
Figure 46: Europe Vehicle Cameras Market Volume (Million Units) Forecast, by Technology, 2017‒2031
Figure 47: Europe Vehicle Cameras Market Value (US$ Bn) Forecast, by Technology, 2017‒2031
Figure 48: Europe Vehicle Cameras Market, Incremental Opportunity, by Technology, Value (US$ Bn), 2022‒2031
Figure 49: Europe Vehicle Cameras Market Volume (Million Units) Forecast, by Price, 2017‒2031
Figure 50: Europe Vehicle Cameras Market Value (US$ Bn) Forecast, by Price, 2017‒2031
Figure 51: Europe Vehicle Cameras Market, Incremental Opportunity, by Price, Value (US$ Bn), 2022‒2031
Figure 52: Europe Vehicle Cameras Market Volume (Million Units) Forecast, by Vehicle Type, 2017‒2031
Figure 53: Europe Vehicle Cameras Market Value (US$ Bn) Forecast, by Vehicle Type, 2017‒2031
Figure 54: Europe Vehicle Cameras Market, Incremental Opportunity, by Vehicle Type, Value (US$ Bn), 2022‒2031
Figure 55: Europe Vehicle Cameras Market Volume (Million Units) Forecast, by Application, 2017‒2031
Figure 56: Europe Vehicle Cameras Market Value (US$ Bn) Forecast, by Application, 2017‒2031
Figure 57: Europe Vehicle Cameras Market, Incremental Opportunity, by Application, Value (US$ Bn), 2022‒2031
Figure 58: Europe Vehicle Cameras Market Volume (Million Units) Forecast, by Sales Channel, 2017‒2031
Figure 59: Europe Vehicle Cameras Market Value (US$ Bn) Forecast, by Sales Channel, 2017‒2031
Figure 60: Europe Vehicle Cameras Market, Incremental Opportunity, by Sales Channel, Value (US$ Bn), 2022‒2031
Figure 61: Europe Vehicle Cameras Market Volume (Million Units) Forecast, by Country & Sub-region, 2017‒2031
Figure 62: Europe Vehicle Cameras Market Value (US$ Bn) Forecast, by Country & Sub-region, 2017‒2031
Figure 63: Europe Vehicle Cameras Market, Incremental Opportunity, by Country & Sub-region, Value (US$ Bn), 2022‒2031
Figure 64: Asia Pacific Vehicle Cameras Market Volume (Million Units) Forecast, by Camera View Type, 2017‒2031
Figure 65: Asia Pacific Vehicle Cameras Market Value (US$ Bn) Forecast, by Camera View Type, 2017‒2031
Figure 66: Asia Pacific Vehicle Cameras Market, Incremental Opportunity, by Camera View Type, Value (US$ Bn), 2022‒2031
Figure 67: Asia Pacific Vehicle Cameras Market Volume (Million Units) Forecast, by Technology, 2017‒2031
Figure 68: Asia Pacific Vehicle Cameras Market Value (US$ Bn) Forecast, by Technology, 2017‒2031
Figure 69: Asia Pacific Vehicle Cameras Market, Incremental Opportunity, by Technology, Value (US$ Bn), 2022‒2031
Figure 70: Asia Pacific Vehicle Cameras Market Volume (Million Units) Forecast, by Price, 2017‒2031
Figure 71: Asia Pacific Vehicle Cameras Market Value (US$ Bn) Forecast, by Price, 2017‒2031
Figure 72: Asia Pacific Vehicle Cameras Market, Incremental Opportunity, by Price, Value (US$ Bn), 2022‒2031
Figure 73: Asia Pacific Vehicle Cameras Market Volume (Million Units) Forecast, by Vehicle Type, 2017‒2031
Figure 74: Asia Pacific Vehicle Cameras Market Value (US$ Bn) Forecast, by Vehicle Type, 2017‒2031
Figure 75: Asia Pacific Vehicle Cameras Market, Incremental Opportunity, by Vehicle Type, Value (US$ Bn), 2022‒2031
Figure 76: Asia Pacific Vehicle Cameras Market Volume (Million Units) Forecast, by Application, 2017‒2031
Figure 77: Asia Pacific Vehicle Cameras Market Value (US$ Bn) Forecast, by Application, 2017‒2031
Figure 78: Asia Pacific Vehicle Cameras Market, Incremental Opportunity, by Application, Value (US$ Bn), 2022‒2031
Figure 79: Asia Pacific Vehicle Cameras Market Volume (Million Units) Forecast, by Sales Channel, 2017‒2031
Figure 80: Asia Pacific Vehicle Cameras Market Value (US$ Bn) Forecast, by Sales Channel, 2017‒2031
Figure 81: Asia Pacific Vehicle Cameras Market, Incremental Opportunity, by Sales Channel, Value (US$ Bn), 2022‒2031
Figure 82: Asia Pacific Vehicle Cameras Market Volume (Million Units) Forecast, by Country & Sub-region, 2017‒2031
Figure 83: Asia Pacific Vehicle Cameras Market Value (US$ Bn) Forecast, by Country & Sub-region, 2017‒2031
Figure 84: Asia Pacific Vehicle Cameras Market, Incremental Opportunity, by Country & Sub-region, Value (US$ Bn), 2022‒2031
Figure 85: Middle East & Africa Vehicle Cameras Market Volume (Million Units) Forecast, by Camera View Type, 2017‒2031
Figure 86: Middle East & Africa Vehicle Cameras Market Value (US$ Bn) Forecast, by Camera View Type, 2017‒2031
Figure 87: Middle East & Africa Vehicle Cameras Market, Incremental Opportunity, by Camera View Type, Value (US$ Bn), 2022‒2031
Figure 88: Middle East & Africa Vehicle Cameras Market Volume (Million Units) Forecast, by Technology, 2017‒2031
Figure 89: Middle East & Africa Vehicle Cameras Market Value (US$ Bn) Forecast, by Technology, 2017‒2031
Figure 90: Middle East & Africa Vehicle Cameras Market, Incremental Opportunity, by Technology, Value (US$ Bn), 2022‒2031
Figure 91: Middle East & Africa Vehicle Cameras Market Volume (Million Units) Forecast, by Price, 2017‒2031
Figure 92: Middle East & Africa Vehicle Cameras Market Value (US$ Bn) Forecast, by Price, 2017‒2031
Figure 93: Middle East & Africa Vehicle Cameras Market, Incremental Opportunity, by Price, Value (US$ Bn), 2022‒2031
Figure 94: Middle East & Africa Vehicle Cameras Market Volume (Million Units) Forecast, by Vehicle Type, 2017‒2031
Figure 95: Middle East & Africa Vehicle Cameras Market Value (US$ Bn) Forecast, by Vehicle Type, 2017‒2031
Figure 96: Middle East & Africa Vehicle Cameras Market, Incremental Opportunity, by Vehicle Type, Value (US$ Bn), 2022‒2031
Figure 97: Middle East & Africa Vehicle Cameras Market Volume (Million Units) Forecast, by Application, 2017‒2031
Figure 98: Middle East & Africa Vehicle Cameras Market Value (US$ Bn) Forecast, by Application, 2017‒2031
Figure 99: Middle East & Africa Vehicle Cameras Market, Incremental Opportunity, by Application, Value (US$ Bn), 2022‒2031
Figure 100: Middle East & Africa Vehicle Cameras Market Volume (Million Units) Forecast, by Sales Channel, 2017‒2031
Figure 101: Middle East & Africa Vehicle Cameras Market Value (US$ Bn) Forecast, by Sales Channel, 2017‒2031
Figure 102: Middle East & Africa Vehicle Cameras Market, Incremental Opportunity, by Sales Channel, Value (US$ Bn), 2022‒2031
Figure 103: Middle East & Africa Vehicle Cameras Market Volume (Million Units) Forecast, by Country & Sub-region, 2017‒2031
Figure 104: Middle East & Africa Vehicle Cameras Market Value (US$ Bn) Forecast, by Country & Sub-region, 2017‒2031
Figure 105: Middle East & Africa Vehicle Cameras Market, Incremental Opportunity, by Country & Sub-region, Value (US$ Bn), 2022‒2031
Figure 106: South America Vehicle Cameras Market Volume (Million Units) Forecast, by Camera View Type, 2017‒2031
Figure 107: South America Vehicle Cameras Market Value (US$ Bn) Forecast, by Camera View Type, 2017‒2031
Figure 108: South America Vehicle Cameras Market, Incremental Opportunity, by Camera View Type, Value (US$ Bn), 2022‒2031
Figure 109: South America Vehicle Cameras Market Volume (Million Units) Forecast, by Technology, 2017‒2031
Figure 110: South America Vehicle Cameras Market Value (US$ Bn) Forecast, by Technology, 2017‒2031
Figure 111: South America Vehicle Cameras Market, Incremental Opportunity, by Technology, Value (US$ Bn), 2022‒2031
Figure 112: South America Vehicle Cameras Market Volume (Million Units) Forecast, by Price, 2017‒2031
Figure 113: South America Vehicle Cameras Market Value (US$ Bn) Forecast, by Price, 2017‒2031
Figure 114: South America Vehicle Cameras Market, Incremental Opportunity, by Price, Value (US$ Bn), 2022‒2031
Figure 115: South America Vehicle Cameras Market Volume (Million Units) Forecast, by Vehicle Type, 2017‒2031
Figure 116: South America Vehicle Cameras Market Value (US$ Bn) Forecast, by Vehicle Type, 2017‒2031
Figure 117: South America Vehicle Cameras Market, Incremental Opportunity, by Vehicle Type, Value (US$ Bn), 2022‒2031
Figure 118: South America Vehicle Cameras Market Volume (Million Units) Forecast, by Application, 2017‒2031
Figure 119: South America Vehicle Cameras Market Value (US$ Bn) Forecast, by Application, 2017‒2031
Figure 120: South America Vehicle Cameras Market, Incremental Opportunity, by Application, Value (US$ Bn), 2022‒2031
Figure 121: South America Vehicle Cameras Market Volume (Million Units) Forecast, by Sales Channel, 2017‒2031
Figure 122: South America Vehicle Cameras Market Value (US$ Bn) Forecast, by Sales Channel, 2017‒2031
Figure 123: South America Vehicle Cameras Market, Incremental Opportunity, by Sales Channel, Value (US$ Bn), 2022‒2031
Figure 124: South America Vehicle Cameras Market Volume (Million Units) Forecast, by Country & Sub-region, 2017‒2031
Figure 125: South America Vehicle Cameras Market Value (US$ Bn) Forecast, by Country & Sub-region, 2017‒2031
Figure 126: South America Vehicle Cameras Market, Incremental Opportunity, by Country & Sub-region, Value (US$ Bn), 2022‒2031
Copyright © Transparency Market Research, Inc. All Rights reserved
Trust Online

Vehicle Cameras Market